Grundlæggende statistik
| Institutionelle ejere | 140 total, 140 long only, 0 short only, 0 long/short - change of -3,47% MRQ |
| Gennemsnitlig porteføljeallokering | 0.1757 % - change of -60,20% MRQ |
| Institutionelle aktier (lange) | 6.402.651 (ex 13D/G) - change of -12,99MM shares -67,00% MRQ |
| Institutionel værdi (lang) | $ 295.643 USD ($1000) |
Institutionelt ejerskab og aktionærer
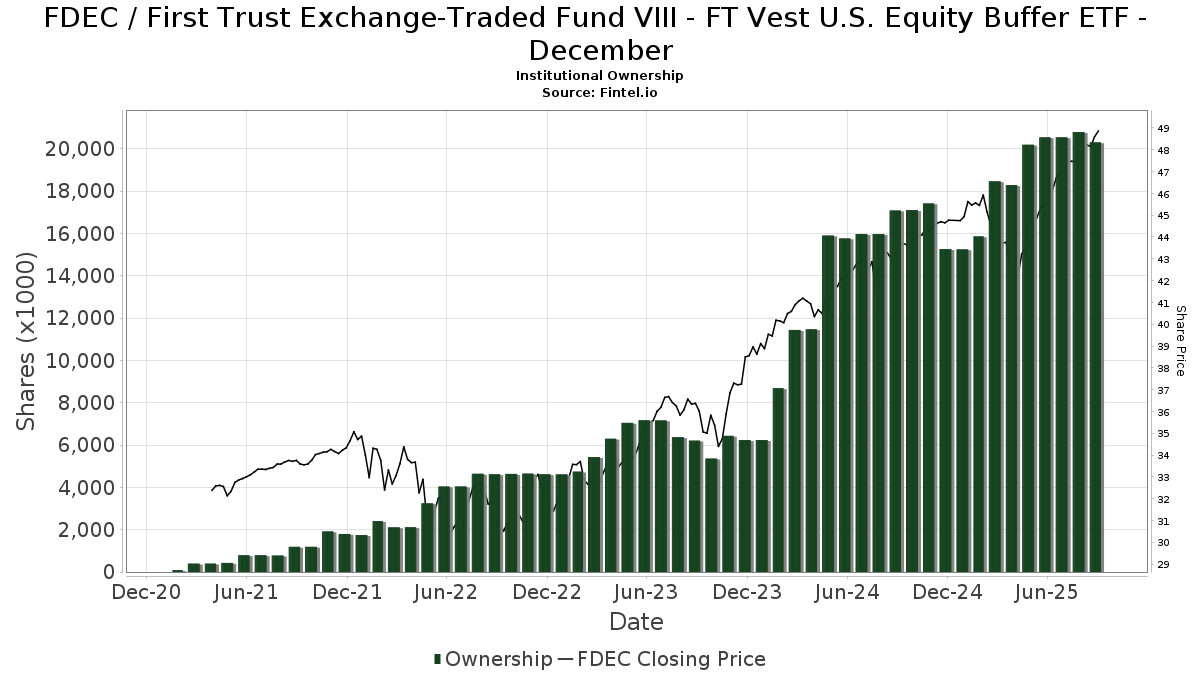
First Trust Exchange-Traded Fund VIII - FT Vest U.S. Equity Buffer ETF - December (US:FDEC) har 140 institutionelle ejere og aktionærer, der har indsendt 13D/G- eller 13F-formularer til Securities Exchange Commission (SEC). Disse institutioner har i alt 6,402,651 aktier. Største aktionærer omfatter Griffith & Werner, Inc., Envestnet Asset Management Inc, Raymond James Financial Inc, Cetera Investment Advisers, Cwm, Llc, Commonwealth Equity Services, Llc, Assetmark, Inc, LPL Financial LLC, We Are One Seven, LLC, and Advisor Group Holdings, Inc. .
First Trust Exchange-Traded Fund VIII - FT Vest U.S. Equity Buffer ETF - December (BATS:FDEC) institutionel ejerskabsstruktur viser aktuelle positioner i virksomheden efter institutioner og fonde, samt seneste ændringer i positionsstørrelse. Større aktionærer kan omfatte individuelle investorer, investeringsforeninger, hedgefonde eller institutioner. Skema 13D angiver, at investoren besidder (eller besidder) mere end 5 % af virksomheden og har til hensigt (eller har til hensigt at) aktivt at forfølge en ændring i forretningsstrategi. Skema 13G indikerer en passiv investering på over 5%.
The share price as of March 13, 2026 is 50,18 / share. Previously, on March 17, 2025, the share price was 43,78 / share. This represents an increase of 14,62% over that period.
Fondens stemningsscore
Fund Sentiment Score (fka Ownership Accumulation Score) finder de aktier, der bliver mest købt af fonde. Det er resultatet af en sofistikeret, multi-faktor kvantitativ model, der identificerer virksomheder med de højeste niveauer af institutionel akkumulering. Scoringsmodellen bruger en kombination af den samlede stigning i oplyste ejere, ændringerne i porteføljeallokeringer i disse ejere og andre målinger. Tallet går fra 0 til 100, hvor højere tal indikerer et højere niveau af akkumulering for sine jævnaldrende, og 50 er gennemsnittet.
Opdateringsfrekvens: Dagligt
Se Ownership Explorer, som giver en liste over højest rangerende virksomheder.
AI+ Ask Fintel’s AI assistant about First Trust Exchange-Traded Fund VIII - FT Vest U.S. Equity Buffer ETF - December.
Select a question to share a public post with an AI-crafted answer.
Thinking of good questions…
Institutionel Put/Call-forhold
Ud over at indberette standardaktie- og gældsudstedelser skal institutter med mere end 100 mill. aktiver under forvaltning også oplyse deres put- og call-optionsbeholdninger. Da salgsoptioner generelt indikerer negativ stemning, og købsoptioner indikerer positiv stemning, kan vi få en fornemmelse af den overordnede institutionelle stemning ved at plotte forholdet mellem put og kald. Diagrammet til højre viser det historiske put/call-forhold for dette instrument.
Brug af Put/Call Ratio som en indikator for investorernes stemning overvinder en af de vigtigste mangler ved at bruge totalt institutionelt ejerskab, som er, at en betydelig mængde af aktiver under forvaltning investeres passivt for at spore indekser. Passivt forvaltede fonde køber typisk ikke optioner, så indikatoren for put/call-forholdet følger mere nøje følelsen af aktivt forvaltede fonde.
13D/G-arkivering
Vi præsenterer 13D/G ansøgninger separat fra 13F ansøgninger på grund af den forskellige behandling af SEC. 13D/G-ansøgninger kan indgives af grupper af investorer (med én ledende), hvorimod 13F-ansøgninger ikke kan. Dette resulterer i situationer, hvor en investor kan indsende en 13D/G, der rapporterer én værdi for de samlede aktier (der repræsenterer alle de aktier, der ejes af investorgruppen), men derefter indsender en 13F, der rapporterer en anden værdi for de samlede aktier (der udelukkende repræsenterer deres egne) ejendomsret). Det betyder, at aktieejerskab af 13D/G-arkiver og 13F-arkiveringer ofte ikke er direkte sammenlignelige, så vi præsenterer dem separat.
Bemærk: Fra den 16. maj 2021 viser vi ikke længere ejere, der ikke har indsendt en 13D/G inden for det seneste år. Tidligere viste vi den fulde historie af 13D/G-arkiver. Generelt skal enheder, der er forpligtet til at indgive 13D/G-ansøgninger, indgive mindst årligt, før de indsender en afsluttende ansøgning. Dog forlader fonde nogle gange positioner uden at indsende en afsluttende ansøgning (dvs. de afvikler), så visning af den fulde historie resulterede nogle gange i forvirring om det nuværende ejerskab. For at undgå forvirring viser vi nu kun 'aktuelle' ejere - det vil sige - ejere, der har anmeldt inden for det seneste år.
Upgrade to unlock premium data.
| Fil dato | Form | Investor | Forrige Aktier |
Seneste Aktier |
Δ Aktier (Procent) |
Ejendomsret (Procent) |
Δ Ejerskab (Procent) |
|
|---|---|---|---|---|---|---|---|---|
| 2026-01-23 | FIRST TRUST PORTFOLIOS LP | 13,745,552 | 14,637,185 | 6.49 | 60.67 | -3.01 |
13F og NPORT arkivering
Detaljer om 13F-arkivering er gratis. Detaljer om NP-ansøgninger kræver et premium-medlemskab. Grønne rækker angiver nye positioner. Røde rækker angiver lukkede positioner. Klik på linket ikon for at se den fulde transaktionshistorik.
Opgrader
for at låse premium-data op og eksportere til Excel ![]() .
.
| Fil dato | Kilde | Investor | Type | Gennemsnitlig pris (Øst) |
Aktier | Δ Aktier (%) |
Rapporteret Værdi ($1000) |
Δ Værdi (%) |
Port Alloc (%) |
|
|---|---|---|---|---|---|---|---|---|---|---|
| 2026-01-21 | 13F | New Wave Wealth Advisors Llc | 4.537 | 232 | ||||||
| 2026-02-09 | 13F | Keating Financial Advisory Services, Inc. | 9.734 | 498 | ||||||
| 2026-02-17 | 13F | Signature Equity Partners, LLC | 292 | 15 | ||||||
| 2026-02-17 | 13F | Aqr Capital Management Llc | 14.600 | 52,08 | 747 | 58,26 | ||||
| 2026-02-13 | 13F | Morgan Stanley | 1.579 | 0,00 | 81 | 3,90 | ||||
| 2026-02-17 | 13F | United Capital Financial Advisers, Llc | 7.000 | 64,13 | 358 | 70,48 | ||||
| 2026-02-06 | 13F | Pnc Financial Services Group, Inc. | 12.586 | 18,59 | 644 | 23,37 | ||||
| 2026-01-21 | 13F | Capital Investment Advisory Services, LLC | 156 | 8 | ||||||
| 2026-02-10 | 13F | Foundations Investment Advisors, LLC | 23.851 | 26,77 | 1.221 | 31,75 | ||||
| 2026-01-12 | 13F | World Equity Group, Inc. | 13.267 | 11,11 | 679 | 15,67 | ||||
| 2026-02-10 | 13F | Envestnet Asset Management Inc | 520.651 | -11,06 | 26.648 | -7,55 | ||||
| 2025-10-24 | 13F | ORG Partners LLC | 0 | -100,00 | 0 | |||||
| 2026-02-06 | 13F | McKinley Carter Wealth Services, Inc. | 34.931 | 0,00 | 1.788 | 3,90 | ||||
| 2026-02-04 | 13F | Ameritas Advisory Services, LLC | 12.744 | 14,40 | 652 | 18,98 | ||||
| 2026-02-11 | 13F | 1776 Wealth LLC | 31.969 | 1.636 | ||||||
| 2026-02-13 | 13F | Integrated Wealth Concepts LLC | 5.875 | 0,00 | 301 | 3,81 | ||||
| 2026-02-18 | 13F | GWM Advisors LLC | 0 | -100,00 | 0 | |||||
| 2025-11-14 | 13F | Citadel Advisors Llc | 0 | -100,00 | 0 | -100,00 | ||||
| 2026-01-08 | 13F | Wealth Enhancement Advisory Services, Llc | 26.203 | 2,76 | 1.351 | 7,40 | ||||
| 2026-02-06 | 13F | Creative Financial Designs Inc /adv | 2.930 | -4,34 | 150 | -0,67 | ||||
| 2026-02-13 | 13F | Share Andrew L. | 7.650 | 0,00 | 392 | 3,99 | ||||
| 2026-02-05 | 13F | Schulz Wealth, LTD. | 148.314 | -1,47 | 7.591 | 2,43 | ||||
| 2025-10-07 | 13F | Grant Private Wealth Management Inc | 0 | -100,00 | 0 | |||||
| 2026-01-30 | 13F | Sigma Planning Corp | 8.252 | -88,65 | 422 | -88,22 | ||||
| 2026-02-13 | 13F | Smartleaf Asset Management LLC | 78 | 4 | ||||||
| 2026-01-23 | 13F | Clear Creek Financial Management, LLC | 10.741 | 0,00 | 550 | 3,98 | ||||
| 2026-01-30 | 13F | Wagner Wealth Management, Llc | 3.000 | 0,00 | 154 | 4,08 | ||||
| 2026-01-29 | 13F | Kestra Private Wealth Services, Llc | 17.980 | 5,76 | 920 | 9,92 | ||||
| 2026-02-06 | 13F | Global Retirement Partners, LLC | 575 | 0,00 | 29 | 3,57 | ||||
| 2026-02-13 | 13F | Kestra Advisory Services, LLC | 0 | -100,00 | 0 | |||||
| 2026-02-04 | 13F | Topsail Wealth Management, LLC | 125 | 6 | ||||||
| 2026-02-10 | 13F | REAP Financial Group, LLC | 81.687 | 15,26 | 4.181 | 19,81 | ||||
| 2026-02-09 | 13F | Valtinson Bruner Financial Planning LLC | 22.583 | -1,31 | 1.156 | 2,58 | ||||
| 2026-02-10 | 13F | Alpha Financial Partners, LLC | 4.926 | 252 | ||||||
| 2026-02-10 | 13F | Founders Financial Securities Llc | 29.164 | 12,26 | 1.493 | 16,65 | ||||
| 2026-02-05 | 13F | Cambridge Investment Research Advisors, Inc. | 100.706 | 2,31 | 5 | 25,00 | ||||
| 2026-01-28 | 13F | Arbor Capital Management Inc /adv | 9.602 | 4,83 | 493 | 9,09 | ||||
| 2026-02-13 | 13F | Pitti Group Wealth Management, LLC | 0 | -100,00 | 0 | |||||
| 2026-01-23 | 13F | DHJJ Financial Advisors, Ltd. | 16.256 | 3,44 | 832 | 7,63 | ||||
| 2026-01-14 | 13F | Wolff Wiese Magana Llc | 193 | 0,00 | 10 | 0,00 | ||||
| 2025-11-14 | 13F | Brown Advisory Inc | 0 | -100,00 | 0 | |||||
| 2026-01-26 | 13F | AE Wealth Management LLC | 33.103 | 2,92 | 1.694 | 7,01 | ||||
| 2026-02-12 | 13F | Jane Street Group, Llc | 26.811 | 1.372 | ||||||
| 2026-02-13 | 13F | Change Path, LLC | 72.983 | 12,48 | 3.735 | 16,90 | ||||
| 2026-02-10 | 13F | Evolution Wealth Management Inc. | 1.727 | -0,46 | 88 | 3,53 | ||||
| 2026-02-03 | 13F | RFG Advisory, LLC | 23.074 | 14,41 | 1.181 | 18,83 | ||||
| 2026-02-17 | 13F | Gallagher Fiduciary Advisors, LLC | 19.347 | 34,42 | 990 | 39,83 | ||||
| 2026-02-11 | 13F | Ameritas Investment Partners, Inc. | 1.680 | 86 | ||||||
| 2026-02-05 | 13F | Stephens Inc /ar/ | 123.589 | -9,73 | 6.326 | -6,17 | ||||
| 2026-01-29 | 13F | UBS Group AG | 0 | -100,00 | 0 | |||||
| 2026-01-26 | 13F | Merit Financial Group, LLC | 4.786 | -20,33 | 245 | -17,29 | ||||
| 2025-11-12 | 13F | Park Square Financial Group, LLC | 0 | -100,00 | 0 | |||||
| 2026-01-22 | 13F | Apollon Wealth Management, LLC | 4.804 | -9,43 | 246 | -6,13 | ||||
| 2026-02-09 | 13F | Blue Bell Private Wealth Management, Llc | 17.658 | 5,74 | 904 | 9,85 | ||||
| 2025-11-14 | 13F | Wood Tarver Financial Group, LLC | 0 | -100,00 | 0 | |||||
| 2026-02-13 | 13F | Arkadios Wealth Advisors | 77.145 | 4,45 | 3.948 | 8,58 | ||||
| 2026-02-17 | 13F | Capasso Planning Partners LLC | 0 | -100,00 | 0 | |||||
| 2026-02-17 | 13F | Advisor Group Holdings, Inc. | 154.679 | -23,02 | 7.916 | -19,22 | ||||
| 2025-11-12 | 13F | Armis Advisers, LLC | 0 | -100,00 | 0 | -100,00 | ||||
| 2026-02-12 | 13F | Lbmc Investment Advisors, Llc | 16.748 | 0,00 | 857 | 4,00 | ||||
| 2026-01-13 | 13F | Signal Advisors Wealth, LLC | 16.407 | 73,53 | 840 | 80,43 | ||||
| 2026-01-13 | 13F | Mather Group, Llc. | 0 | -100,00 | 0 | |||||
| 2025-10-22 | 13F | WESPAC Advisors SoCal, LLC | 0 | -100,00 | 0 | |||||
| 2026-03-13 | 13F/A | Pensionmark Financial Group, Llc | 5.694 | 291 | ||||||
| 2026-01-26 | 13F | Cwm, Llc | 365.745 | -1,77 | 19 | 0,00 | ||||
| 2026-01-27 | 13F | First Horizon Corp | 0 | -100,00 | 0 | |||||
| 2026-01-22 | 13F | Paragon Capital Management Ltd | 4.481 | -11,70 | 229 | -8,03 | ||||
| 2026-02-13 | 13F | Financial Network Wealth Advisors LLC | 5.900 | 0,00 | 302 | 3,79 | ||||
| 2026-01-20 | 13F | BAM Wealth Management, LLC | 102.891 | 9,92 | 5.266 | 14,25 | ||||
| 2026-02-20 | 13F | Sunbelt Securities, Inc. | 8.701 | 0,90 | 445 | 4,95 | ||||
| 2026-01-12 | 13F | Rialto Wealth Management, LLC | 330 | 17 | ||||||
| 2026-01-23 | 13F | Farther Finance Advisors, LLC | 33.368 | -7,81 | 1.708 | -4,21 | ||||
| 2026-02-06 | 13F | Envestnet Portfolio Solutions, Inc. | 5.565 | 14,04 | 285 | 18,33 | ||||
| 2026-02-06 | 13F | Tanglewood Legacy Advisors, LLC | 29.171 | -4,91 | 1.493 | -1,13 | ||||
| 2026-02-13 | 13F | Griffith & Werner, Inc. | 643.437 | -1,55 | 32.933 | 0,77 | ||||
| 2026-02-12 | 13F | Steward Partners Investment Advisory, Llc | 33.592 | 5,92 | 1.719 | 10,12 | ||||
| 2026-01-28 | 13F | Family Wealth Group, LLC | 33.464 | 12,94 | 1.713 | 17,34 | ||||
| 2026-01-27 | 13F | Summit Financial Wealth Advisors, LLC | 0 | -100,00 | 0 | |||||
| 2026-02-13 | 13F | Integrity Financial Corp /WA | 31.573 | 2,38 | 1.616 | 6,39 | ||||
| 2026-02-03 | 13F | Fsb Premier Wealth Management, Inc. | 15.897 | 103,86 | 814 | 112,27 | ||||
| 2026-02-13 | 13F | Barclays Plc | 0 | -100,00 | 0 | |||||
| 2026-02-02 | 13F | Oppenheimer & Co Inc | 19.702 | -0,93 | 1.008 | 2,96 | ||||
| 2026-02-12 | 13F | Fortress Private Ledger, Llc | 3.964 | -76,16 | 203 | -75,31 | ||||
| 2026-02-13 | 13F | Aptus Capital Advisors, LLC | 1.803 | -9,85 | 92 | -6,12 | ||||
| 2025-11-14 | 13F | Wolverine Trading, Llc | 0 | -100,00 | 0 | |||||
| 2026-02-17 | 13F | Advisory Services Network, LLC | 0 | -100,00 | 0 | |||||
| 2026-02-17 | 13F | Wiley Bros.-aintree Capital, Llc | 0 | -100,00 | 0 | |||||
| 2026-01-23 | 13F | Assetmark, Inc | 254.747 | 14,24 | 13.039 | 18,74 | ||||
| 2026-02-17 | 13F | Susquehanna International Group, Llp | 28.467 | 393,70 | 1.457 | 414,84 | ||||
| 2026-02-02 | 13F | Mutual Advisors, LLC | 10.351 | 44,08 | 530 | 49,01 | ||||
| 2026-02-05 | 13F | WealthPlan Investment Management, LLC | 4.932 | -64,53 | 252 | -63,16 | ||||
| 2026-02-02 | 13F | Bullseye Investment Management, LLC | 25.367 | 0,00 | 1.101 | 0,00 | ||||
| 2025-11-06 | 13F | BlueChip Wealth Advisors LLC | 0 | -100,00 | 0 | -100,00 | ||||
| 2026-02-09 | 13F | Harbour Investments, Inc. | 41.831 | 23,98 | 2.141 | 28,90 | ||||
| 2026-01-05 | 13F | Park Avenue Securities Llc | 9.368 | 19,87 | 0 | |||||
| 2026-02-12 | 13F | Commonwealth Equity Services, Llc | 294.462 | 30,59 | 15.071 | 136.909,09 | ||||
| 2026-02-13 | 13F | Wells Fargo & Company/mn | 325 | 17 | ||||||
| 2026-02-02 | 13F | Truist Financial Corp | 99.933 | 2,82 | 5.115 | 6,88 | ||||
| 2026-02-11 | 13F | Capital Analysts, Inc. | 2.427 | -7,33 | 0 | |||||
| 2026-01-30 | 13F | Archer Investment Corp | 4.041 | 0,00 | 207 | 4,04 | ||||
| 2026-01-26 | 13F | Nicholson Wealth Management Group, LLC | 10.609 | 543 | ||||||
| 2026-01-28 | 13F | Grant Street Asset Management, Inc. | 7.216 | 0,00 | 369 | 3,94 | ||||
| 2025-09-26 | 13F | Capital A Wealth Management, LLC | 8 | 0 | ||||||
| 2026-02-17 | 13F | Old Mission Capital Llc | 0 | -100,00 | 0 | |||||
| 2025-10-16 | 13F | HBW Advisory Services LLC | 0 | -100,00 | 0 | |||||
| 2026-02-02 | 13F | Grantvest Financial Group LLC | 21.141 | -3,81 | 1.082 | 0,00 | ||||
| 2026-02-10 | 13F | Murphy & Mullick Capital Management Corp | 500 | 0,00 | 26 | 4,17 | ||||
| 2026-02-12 | 13F | Wedbush Securities Inc | 8.164 | 0,00 | 0 | |||||
| 2026-01-16 | 13F | Catalina Capital Group, LLC | 18.861 | 0,00 | 965 | 3,99 | ||||
| 2026-01-29 | 13F | Nbc Securities, Inc. | 3.913 | -6,72 | 200 | -2,91 | ||||
| 2026-01-15 | 13F | Brookstone Capital Management | 14.036 | 4,32 | 718 | 8,46 | ||||
| 2026-02-17 | 13F | Raymond James Financial Inc | 417.303 | 11,39 | 21.359 | 15,78 | ||||
| 2026-02-06 | 13F | HighTower Advisors, LLC | 34.397 | 255,49 | 1.761 | 269,75 | ||||
| 2026-02-05 | 13F | Atria Investments Llc | 151.062 | 19,60 | 7.732 | 24,31 | ||||
| 2025-11-14 | 13F | SRS Capital Advisors, Inc. | 0 | -100,00 | 0 | |||||
| 2026-01-28 | 13F | Kingswood Wealth Advisors, Llc | 9.048 | 0,00 | 463 | 4,04 | ||||
| 2026-02-06 | 13F | IFP Advisors, Inc | 10.626 | 27,92 | 544 | 32,76 | ||||
| 2026-01-12 | 13F | Central Valley Advisors, Llc | 4.392 | 0,00 | 225 | 3,70 | ||||
| 2026-01-29 | 13F | Concurrent Investment Advisors, LLC | 5.359 | 274 | ||||||
| 2025-11-10 | 13F | Signature Securities Group Corporation | 0 | -100,00 | 0 | |||||
| 2026-01-27 | 13F | Novem Group | 75.810 | -5,17 | 3.880 | -1,42 | ||||
| 2026-02-17 | 13F | Royal Bank Of Canada | 27.372 | -6,28 | 1.401 | -2,57 | ||||
| 2026-02-13 | 13F | Centaurus Financial, Inc. | 18.219 | -0,22 | 1 | |||||
| 2026-02-13 | 13F | TFB Advisors LLC | 15.704 | -2,62 | 804 | 1,52 | ||||
| 2026-01-14 | 13F | Chris Bulman Inc | 7.968 | 85,73 | 408 | 92,89 | ||||
| 2026-01-13 | 13F | CoreCap Advisors, LLC | 14.435 | 0,77 | 739 | 4,68 | ||||
| 2026-01-23 | 13F | Octavia Wealth Advisors, LLC | 4.437 | 0,00 | 227 | 4,13 | ||||
| 2026-02-17 | 13F | Captrust Financial Advisors | 14.769 | -8,57 | 756 | -5,03 | ||||
| 2026-01-20 | 13F | Savvy Advisors, Inc. | 4.890 | -33,80 | 250 | -31,13 | ||||
| 2026-02-06 | 13F | Signature Estate & Investment Advisors Llc | 7.902 | 0,00 | 404 | 3,86 | ||||
| 2026-02-12 | 13F | WealthPLAN Partners, LLC | 0 | -100,00 | 0 | |||||
| 2026-01-21 | 13F | Sowell Financial Services LLC | 7.085 | -14,42 | 363 | -11,06 | ||||
| 2026-01-15 | 13F | SILVER OAK SECURITIES, Inc | 6.825 | 350 | ||||||
| 2026-02-03 | 13F | We Are One Seven, LLC | 215.037 | 26,94 | 11.006 | 31,95 | ||||
| 2026-02-12 | 13F | Principal Securities, Inc. | 0 | -100,00 | 0 | -100,00 | ||||
| 2026-02-02 | 13F | Cornerstone Planning Group LLC | 3.038 | 0,00 | 157 | 3,97 | ||||
| 2026-01-14 | 13F | Legacy Solutions, Llc | 8.145 | 417 | ||||||
| 2026-01-14 | 13F | Spire Wealth Management | 600 | -45,45 | 31 | -44,44 | ||||
| 2026-02-17 | 13F | VestGen Advisors, LLC | 5.162 | 0,00 | 264 | 3,94 | ||||
| 2026-02-13 | 13F | Mariner, LLC | 23.138 | 29,58 | 1.184 | 34,70 | ||||
| 2026-02-13 | 13F | Ambassador Advisors, LLC | 60.532 | 16,34 | 3.098 | 20,97 | ||||
| 2026-02-09 | 13F | Prospera Financial Services Inc | 12.686 | -1,57 | 649 | 2,37 | ||||
| 2026-02-17 | 13F | Harvest Investment Services, LLC | 64.988 | 75,63 | 3.326 | 82,55 | ||||
| 2026-02-18 | 13F | Crusonia Wealth Advisors LLC | 73.688 | 3.772 | ||||||
| 2026-02-03 | 13F | Buck Wealth Strategies, LLC | 5.250 | 0,00 | 269 | 3,88 | ||||
| 2026-02-18 | 13F | Hanlon Investment Management, Inc. | 20.374 | 38,81 | 1.043 | 44,32 | ||||
| 2026-01-07 | 13F | Fragasso Group Inc. | 5.633 | -1,66 | 288 | 2,13 | ||||
| 2026-02-17 | 13F | Evergreen Wealth Solutions, LLC | 4.244 | 217 | ||||||
| 2026-02-13 | 13F | Gts Securities Llc | 0 | -100,00 | 0 | |||||
| 2026-02-11 | 13F | Janney Montgomery Scott LLC | 117.853 | 8,61 | 6 | 20,00 | ||||
| 2026-01-20 | 13F | SOA Wealth Advisors, LLC. | 8.071 | 1,39 | 413 | 5,63 | ||||
| 2026-02-14 | 13F | Rockefeller Capital Management L.P. | 40.876 | 42,38 | 2.092 | 48,05 | ||||
| 2026-01-26 | 13F | Keystone Wealth Services, LLC | 0 | -100,00 | 0 | |||||
| 2026-01-27 | 13F | PFG Advisors | 4.565 | -6,34 | 234 | -2,51 | ||||
| 2026-02-02 | 13F | Avidian Wealth Solutions, LLC | 5.188 | 0,00 | 266 | 3,92 | ||||
| 2026-02-12 | 13F | Leigh Baldwin & Co., Llc | 5.820 | -53,44 | 298 | 25,74 | ||||
| 2026-01-23 | 13F | McCarthy & Cox | 0 | -100,00 | 0 | |||||
| 2026-01-29 | 13F | Sanctuary Advisors, LLC | 27.323 | 0,58 | 1.398 | 4,56 | ||||
| 2026-02-11 | 13F | LPL Financial LLC | 236.582 | 25,21 | 12.109 | 30,15 | ||||
| 2026-02-17 | 13F | National Asset Management, Inc. | 5.000 | 0,00 | 256 | 3,66 | ||||
| 2026-01-30 | 13F | Strategic Blueprint, LLC | 26.692 | 22,91 | 1.366 | 27,78 | ||||
| 2026-02-02 | 13F | PKS Advisory Services, LLC | 0 | -100,00 | 0 | |||||
| 2026-02-17 | 13F | Cetera Investment Advisers | 374.354 | 2,54 | 19.160 | 6,59 | ||||
| 2026-02-17 | 13F | Main Street Financial Solutions, LLC | 7.808 | 5,26 | 400 | 9,32 | ||||
| 2026-02-06 | 13F | GPS Wealth Strategies Group, LLC | 0 | -100,00 | 0 | |||||
| 2026-01-21 | 13F | NovaPoint Capital, LLC | 87.980 | -8,51 | 4.503 | -4,90 | ||||
| 2026-02-10 | 13F | Swmg, Llc | 8.188 | 0,95 | 423 | 5,24 | ||||
| 2026-02-17 | 13F | Snowden Capital Advisors LLC | 9.601 | 45,80 | 491 | 51,54 | ||||
| 2026-02-18 | 13F | Skyview Financial Group LLC | 7.528 | 385 | ||||||
| 2026-02-13 | 13F | Mml Investors Services, Llc | 58.564 | -49,54 | 2.997 | -47,55 | ||||
| 2026-02-06 | 13F | Ignite Planners, LLC | 45.285 | -12,60 | 2.334 | -8,55 |