Grundlæggende statistik
| Institutionelle ejere | 86 total, 86 long only, 0 short only, 0 long/short - change of 3,61% MRQ |
| Gennemsnitlig porteføljeallokering | 0.0076 % - change of 5,07% MRQ |
| Institutionelle aktier (lange) | 621.121 (ex 13D/G) - change of -0,06MM shares -9,32% MRQ |
| Institutionel værdi (lang) | $ 27.547 USD ($1000) |
Institutionelt ejerskab og aktionærer
Invesco Exchange-Traded Fund Trust - Invesco MSCI Sustainable Future ETF (US:ERTH) har 86 institutionelle ejere og aktionærer, der har indsendt 13D/G- eller 13F-formularer til Securities Exchange Commission (SEC). Disse institutioner har i alt 621,121 aktier. Største aktionærer omfatter UBS Group AG, Bank Of America Corp /de/, Morgan Stanley, Jane Street Group, Llc, LPL Financial LLC, Stifel Financial Corp, Flow Traders U.s. Llc, Royal Bank Of Canada, Franklin Resources Inc, and Altfest L J & Co Inc .
Invesco Exchange-Traded Fund Trust - Invesco MSCI Sustainable Future ETF (ARCA:ERTH) institutionel ejerskabsstruktur viser aktuelle positioner i virksomheden efter institutioner og fonde, samt seneste ændringer i positionsstørrelse. Større aktionærer kan omfatte individuelle investorer, investeringsforeninger, hedgefonde eller institutioner. Skema 13D angiver, at investoren besidder (eller besidder) mere end 5 % af virksomheden og har til hensigt (eller har til hensigt at) aktivt at forfølge en ændring i forretningsstrategi. Skema 13G indikerer en passiv investering på over 5%.
The share price as of April 20, 2026 is 50,10 / share. Previously, on April 21, 2025, the share price was 37,10 / share. This represents an increase of 35,03% over that period.

Fondens stemningsscore
Fund Sentiment Score (fka Ownership Accumulation Score) finder de aktier, der bliver mest købt af fonde. Det er resultatet af en sofistikeret, multi-faktor kvantitativ model, der identificerer virksomheder med de højeste niveauer af institutionel akkumulering. Scoringsmodellen bruger en kombination af den samlede stigning i oplyste ejere, ændringerne i porteføljeallokeringer i disse ejere og andre målinger. Tallet går fra 0 til 100, hvor højere tal indikerer et højere niveau af akkumulering for sine jævnaldrende, og 50 er gennemsnittet.
Opdateringsfrekvens: Dagligt
Se Ownership Explorer, som giver en liste over højest rangerende virksomheder.
AI+ Ask Fintel’s AI assistant about Invesco Exchange-Traded Fund Trust - Invesco MSCI Sustainable Future ETF.
Select a question to share a public post with an AI-crafted answer.
Thinking of good questions…
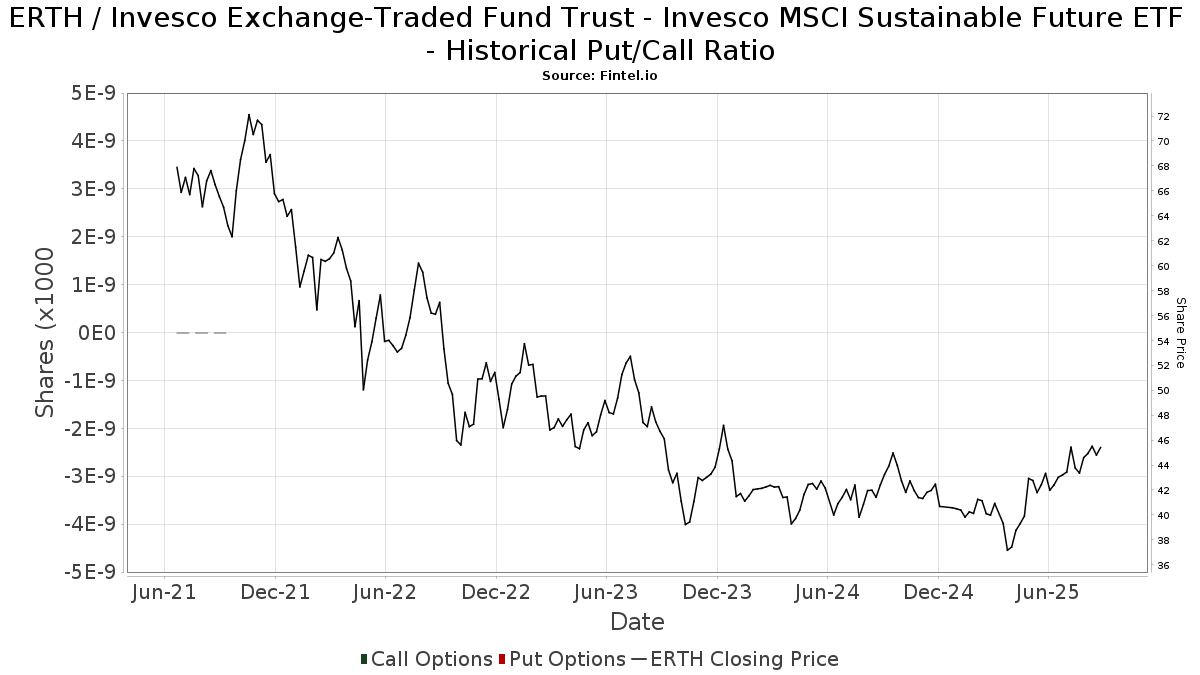
Institutionel Put/Call-forhold
Ud over at indberette standardaktie- og gældsudstedelser skal institutter med mere end 100 mill. aktiver under forvaltning også oplyse deres put- og call-optionsbeholdninger. Da salgsoptioner generelt indikerer negativ stemning, og købsoptioner indikerer positiv stemning, kan vi få en fornemmelse af den overordnede institutionelle stemning ved at plotte forholdet mellem put og kald. Diagrammet til højre viser det historiske put/call-forhold for dette instrument.
Brug af Put/Call Ratio som en indikator for investorernes stemning overvinder en af de vigtigste mangler ved at bruge totalt institutionelt ejerskab, som er, at en betydelig mængde af aktiver under forvaltning investeres passivt for at spore indekser. Passivt forvaltede fonde køber typisk ikke optioner, så indikatoren for put/call-forholdet følger mere nøje følelsen af aktivt forvaltede fonde.
13F og NPORT arkivering
Detaljer om 13F-arkivering er gratis. Detaljer om NP-ansøgninger kræver et premium-medlemskab. Grønne rækker angiver nye positioner. Røde rækker angiver lukkede positioner. Klik på linket ikon for at se den fulde transaktionshistorik.
Opgrader
for at låse premium-data op og eksportere til Excel ![]() .
.
| Fil dato | Kilde | Investor | Type | Gennemsnitlig pris (Øst) |
Aktier | Δ Aktier (%) |
Rapporteret Værdi ($1000) |
Δ Værdi (%) |
Port Alloc (%) |
|
|---|---|---|---|---|---|---|---|---|---|---|
| 2026-02-06 | 13F | Pnc Financial Services Group, Inc. | 587 | 0,00 | 28 | 0,00 | ||||
| 2026-03-31 | 13F | Sankala Group LLC | 1.172 | 0,60 | 54 | -3,57 | ||||
| 2026-01-26 | 13F | AE Wealth Management LLC | 0 | -100,00 | 0 | |||||
| 2026-04-13 | 13F | Hm Payson & Co | 1.019 | 0,00 | 48 | 0,00 | ||||
| 2025-11-13 | 13F | Banque Transatlantique SA | 0 | -100,00 | 0 | |||||
| 2026-02-03 | 13F | Coston, McIsaac & Partners | 130 | 0,00 | 0 | |||||
| 2026-02-17 | 13F | Bank Of America Corp /de/ | 72.952 | 4,76 | 3.442 | 3,71 | ||||
| 2026-02-12 | 13F | McMillan Office, Inc. | 245 | 12 | ||||||
| 2026-02-12 | 13F | Hollencrest Capital Management | 58 | 0,00 | 3 | 0,00 | ||||
| 2026-02-13 | 13F | Kestra Advisory Services, LLC | 0 | -100,00 | 0 | |||||
| 2026-02-12 | 13F | Federation des caisses Desjardins du Quebec | 166 | 0,00 | 8 | 0,00 | ||||
| 2026-02-13 | 13F | Kcm Investment Advisors Llc | 7.651 | -7,20 | 361 | -8,16 | ||||
| 2026-02-05 | 13F | AlphaCore Capital LLC | 1.306 | 62 | ||||||
| 2025-11-04 | 13F | Legend Financial Advisors, Inc. | 0 | -100,00 | 0 | |||||
| 2026-02-17 | 13F | Fmr Llc | 1.423 | -1,93 | 67 | -2,90 | ||||
| 2026-02-13 | 13F | Golden State Wealth Management, LLC | 36 | 0,00 | 2 | 0,00 | ||||
| 2026-02-12 | 13F | BRYN MAWR TRUST Co | 20 | 0,00 | 1 | |||||
| 2026-01-26 | 13F | PFG Investments, LLC | 5.948 | 0,08 | 281 | -1,06 | ||||
| 2025-11-13 | 13F | Glenmede Investment Management, LP | 308 | 0,00 | 15 | 7,69 | ||||
| 2026-01-30 | 13F | Urban Wealth Management, LLC | 0 | -100,00 | 0 | -100,00 | ||||
| 2025-11-12 | 13F | Willow Creek Wealth Management Inc. | 4.241 | 202 | ||||||
| 2026-02-10 | 13F | Basepoint Wealth LLC | 96 | 5 | ||||||
| 2026-02-17 | 13F | Susquehanna International Group, Llp | 18.077 | -38,25 | 853 | -38,92 | ||||
| 2026-02-14 | 13F | Howe & Rusling Inc | 631 | 0,00 | 30 | -3,33 | ||||
| 2026-02-12 | 13F | Bank Of Montreal /can/ | 1.554 | 17,02 | 73 | 15,87 | ||||
| 2026-04-17 | 13F | Hanson & Doremus Investment Management | 140 | 0,00 | 0 | |||||
| 2026-01-23 | 13F | Steigerwald, Gordon & Koch Inc. | 96 | 0,00 | 5 | 0,00 | ||||
| 2026-02-14 | 13F | Rockefeller Capital Management L.P. | 10 | -98,64 | 0 | -100,00 | ||||
| 2026-04-16 | 13F | Capital Advisors, Ltd. LLC | 224 | 0,00 | 0 | |||||
| 2026-02-12 | 13F | Moneta Group Investment Advisors Llc | 10.977 | -2,23 | 518 | -3,18 | ||||
| 2026-01-21 | 13F | Indiana Trust & Investment Management CO | 870 | 0,00 | 41 | 0,00 | ||||
| 2026-02-13 | 13F | Stifel Financial Corp | 29.236 | -2,94 | 1.379 | -3,90 | ||||
| 2026-04-13 | 13F | LexAurum Advisors, LLC | 0 | -100,00 | 0 | |||||
| 2026-02-17 | 13F | Aqr Capital Management Llc | 5.185 | 0,00 | 245 | -1,21 | ||||
| 2026-01-21 | 13F | Albion Financial Group /ut | 3.556 | 0,00 | 168 | -1,18 | ||||
| 2026-02-12 | 13F | Principal Securities, Inc. | 0 | -100,00 | 0 | -100,00 | ||||
| 2026-01-26 | 13F | Cwm, Llc | 734 | 0,27 | 0 | |||||
| 2026-02-11 | 13F | Franklin Resources Inc | 21.925 | -13,10 | 1.034 | -13,98 | ||||
| 2026-02-17 | 13F | Advisory Services Network, LLC | 0 | -100,00 | 0 | |||||
| 2026-02-10 | 13F | Envestnet Asset Management Inc | 4.900 | 231 | ||||||
| 2026-01-21 | 13F | Townsend Asset Management Corp /nc/ /adv | 1.594 | 0,44 | 75 | 0,00 | ||||
| 2026-04-17 | 13F | AdvisorNet Financial, Inc | 115 | 0,00 | 5 | 0,00 | ||||
| 2026-02-11 | 13F | LPL Financial LLC | 31.665 | -2,64 | 1.494 | -3,62 | ||||
| 2026-02-03 | 13F | Emerald Investment Partners, Llc | 1.035 | 0,00 | 49 | -2,04 | ||||
| 2026-03-04 | 13F | SHP Wealth Management | 9 | 0 | ||||||
| 2026-01-27 | 13F | Hoertkorn Richard Charles | 448 | 0,00 | 21 | 0,00 | ||||
| 2026-02-13 | 13F | Aptus Capital Advisors, LLC | 556 | 117,19 | 26 | 116,67 | ||||
| 2026-02-13 | 13F | Flow Traders U.s. Llc | 26.743 | 103,69 | 1 | |||||
| 2026-02-17 | 13F | Ameriprise Financial Inc | 6.116 | -13,17 | 289 | -14,03 | ||||
| 2026-02-13 | 13F | Commerce Bank | 4.401 | 2,59 | 208 | 1,47 | ||||
| 2026-02-17 | 13F | SageView Advisory Group, LLC | 144 | 7 | ||||||
| 2026-02-17 | 13F | Raymond James Financial Inc | 5.690 | -22,26 | 268 | -22,99 | ||||
| 2026-02-12 | 13F | CIBC Private Wealth Group, LLC | 0 | -100,00 | 0 | |||||
| 2026-02-04 | 13F | Ameritas Advisory Services, LLC | 0 | -100,00 | 0 | |||||
| 2026-02-05 | 13F | WHI TRUST Co LLC | 1.842 | 87 | ||||||
| 2025-11-14 | 13F | Gts Securities Llc | 0 | -100,00 | 0 | -100,00 | ||||
| 2026-04-10 | 13F | Piscataqua Savings Bank | 200 | 0,00 | 9 | 0,00 | ||||
| 2026-04-07 | 13F | Farther Finance Advisors, LLC | 233 | 102,61 | 11 | 120,00 | ||||
| 2026-02-06 | 13F | GPS Wealth Strategies Group, LLC | 0 | -100,00 | 0 | |||||
| 2026-01-28 | 13F | Geneos Wealth Management Inc. | 427 | 0,00 | 20 | 0,00 | ||||
| 2026-02-17 | 13F | Royal Bank Of Canada | 24.499 | -1,06 | 1.156 | -2,03 | ||||
| 2026-04-15 | 13F | Valley National Advisers Inc | 35 | 0,00 | 0 | |||||
| 2026-01-27 | 13F | TD Waterhouse Canada Inc. | 100 | 0,00 | 5 | 0,00 | ||||
| 2026-04-20 | 13F | Ronald Blue Trust, Inc. | 3 | 0 | ||||||
| 2026-02-17 | 13F | Jones Financial Companies Lllp | 5.906 | 3,51 | 279 | 3,73 | ||||
| 2026-01-23 | 13F | Altfest L J & Co Inc | 18.884 | -1,24 | 891 | -2,31 | ||||
| 2026-02-13 | 13F | Smartleaf Asset Management LLC | 53 | -1,85 | 3 | 0,00 | ||||
| 2025-11-14 | 13F | Old Mission Capital Llc | 0 | -100,00 | 0 | |||||
| 2026-02-05 | 13F | Allworth Financial LP | 850 | 0,00 | 40 | 0,00 | ||||
| 2026-02-12 | 13F | Rossby Financial, LCC | 161 | 0,00 | 8 | 0,00 | ||||
| 2026-02-13 | 13F | Wells Fargo & Company/mn | 6.930 | 45,83 | 327 | 44,25 | ||||
| 2026-01-21 | 13F | South Shore Capital Advisors | 0 | -100,00 | 0 | |||||
| 2026-02-12 | 13F | Jane Street Group, Llc | 37.592 | 88,87 | 1.773 | 87,03 | ||||
| 2026-02-13 | 13F | National Bank Of Canada /fi/ | 6.251 | 168,28 | 294 | 167,27 | ||||
| 2026-02-05 | 13F | Plante Moran Financial Advisors, LLC | 100 | 0,00 | 5 | 0,00 | ||||
| 2025-11-14 | 13F | Guardian Wealth Advisors, Llc / Nc | 0 | -100,00 | 0 | |||||
| 2026-02-17 | 13F | Glenmede Trust Co Na | 308 | 0,00 | 15 | 27,27 | ||||
| 2026-01-20 | 13F | SOA Wealth Advisors, LLC. | 376 | 0,53 | 18 | 0,00 | ||||
| 2026-02-09 | 13F | Harbour Investments, Inc. | 435 | 0,00 | 21 | 0,00 | ||||
| 2026-02-04 | 13F | Raelipskie Partnership | 10 | 0,00 | 0 | |||||
| 2026-02-17 | 13F | Advisor Group Holdings, Inc. | 3.972 | -5,13 | 187 | -2,60 | ||||
| 2026-02-17 | 13F | Cetera Investment Advisers | 7.843 | -7,48 | 370 | -8,44 | ||||
| 2026-04-10 | 13F | Perigon Wealth Management, LLC | 15.383 | -17,35 | 729 | -16,97 | ||||
| 2026-01-29 | 13F | UBS Group AG | 95.349 | -19,51 | 4.498 | -20,30 | ||||
| 2026-02-13 | 13F | Pacific Center for Financial Services | 390 | 0,00 | 19 | 0,00 | ||||
| 2025-11-14 | 13F | Northwestern Mutual Wealth Management Co | 0 | -100,00 | 0 | |||||
| 2026-01-28 | 13F | Migdal Insurance & Financial Holdings Ltd. | 69 | 0 | ||||||
| 2026-02-10 | 13F | Bnp Paribas Arbitrage, Sa | 0 | -100,00 | 0 | |||||
| 2026-02-20 | 13F | Sunbelt Securities, Inc. | 37 | 68,18 | 2 | 0,00 | ||||
| 2026-02-09 | 13F | Blue Bell Private Wealth Management, Llc | 13 | 0,00 | 1 | |||||
| 2026-02-12 | 13F | Commonwealth Equity Services, Llc | 7.503 | -0,92 | 354 | |||||
| 2026-01-23 | 13F | Natural Investments, Llc | 8.320 | 0 | ||||||
| 2026-01-30 | 13F | Us Bancorp \de\ | 11.900 | 0,00 | 561 | -1,06 | ||||
| 2026-02-11 | 13F | Jpmorgan Chase & Co | 3.075 | 0,00 | 145 | -0,68 | ||||
| 2026-02-13 | 13F | Morgan Stanley | 65.469 | -2,40 | 3.089 | -3,38 | ||||
| 2026-02-11 | 13F | Flagship Wealth Advisors, Llc | 223 | 0,00 | 11 | 0,00 | ||||
| 2026-02-13 | 13F | MAI Capital Management | 35 | 0,00 | 2 | 0,00 | ||||
| 2026-02-11 | 13F | Capital Analysts, Inc. | 148 | -68,71 | 0 | |||||
| 2026-02-11 | 13F | Cerity Partners LLC | 8.270 | -0,61 | 390 | -1,52 | ||||
| 2026-02-02 | 13F | Millstone Evans Group, LLC | 3.950 | 0,00 | 186 | -1,06 | ||||
| 2026-04-07 | 13F | Eastern Bank | 490 | 0,00 | 23 | 0,00 | ||||
| 2026-01-27 | 13F | WealthCollab, LLC | 2.238 | 0,00 | 106 | -0,94 | ||||
| 2026-04-08 | 13F | Wealth Enhancement Advisory Services, Llc | 7.260 | -0,18 | 344 | -1,15 |