Grundlæggende statistik
| Institutionelle ejere | 115 total, 115 long only, 0 short only, 0 long/short - change of 0,87% MRQ |
| Gennemsnitlig porteføljeallokering | 0.1328 % - change of -44,97% MRQ |
| Institutionelle aktier (lange) | 8.076.007 (ex 13D/G) - change of -1,01MM shares -11,15% MRQ |
| Institutionel værdi (lang) | $ 319.251 USD ($1000) |
Institutionelt ejerskab og aktionærer
iShares, Inc. - iShares J.P. Morgan EM High Yield Bond ETF (US:EMHY) har 115 institutionelle ejere og aktionærer, der har indsendt 13D/G- eller 13F-formularer til Securities Exchange Commission (SEC). Disse institutioner har i alt 8,076,007 aktier. Største aktionærer omfatter Assetmark, Inc, Sound Income Strategies, LLC, BlackRock, Inc., Wells Fargo & Company/mn, Bank Of America Corp /de/, Horizon Wealth Management, LLC, LPL Financial LLC, Summit Financial, LLC, Bank Julius Baer & Co. Ltd, Zurich, and Envestnet Asset Management Inc .
iShares, Inc. - iShares J.P. Morgan EM High Yield Bond ETF (BATS:EMHY) institutionel ejerskabsstruktur viser aktuelle positioner i virksomheden efter institutioner og fonde, samt seneste ændringer i positionsstørrelse. Større aktionærer kan omfatte individuelle investorer, investeringsforeninger, hedgefonde eller institutioner. Skema 13D angiver, at investoren besidder (eller besidder) mere end 5 % af virksomheden og har til hensigt (eller har til hensigt at) aktivt at forfølge en ændring i forretningsstrategi. Skema 13G indikerer en passiv investering på over 5%.
The share price as of April 27, 2026 is 40,43 / share. Previously, on April 28, 2025, the share price was 37,98 / share. This represents an increase of 6,45% over that period.

Fondens stemningsscore
Fund Sentiment Score (fka Ownership Accumulation Score) finder de aktier, der bliver mest købt af fonde. Det er resultatet af en sofistikeret, multi-faktor kvantitativ model, der identificerer virksomheder med de højeste niveauer af institutionel akkumulering. Scoringsmodellen bruger en kombination af den samlede stigning i oplyste ejere, ændringerne i porteføljeallokeringer i disse ejere og andre målinger. Tallet går fra 0 til 100, hvor højere tal indikerer et højere niveau af akkumulering for sine jævnaldrende, og 50 er gennemsnittet.
Opdateringsfrekvens: Dagligt
Se Ownership Explorer, som giver en liste over højest rangerende virksomheder.
AI+ Ask Fintel’s AI assistant about iShares, Inc. - iShares J.P. Morgan EM High Yield Bond ETF.
Select a question to share a public post with an AI-crafted answer.
Thinking of good questions…
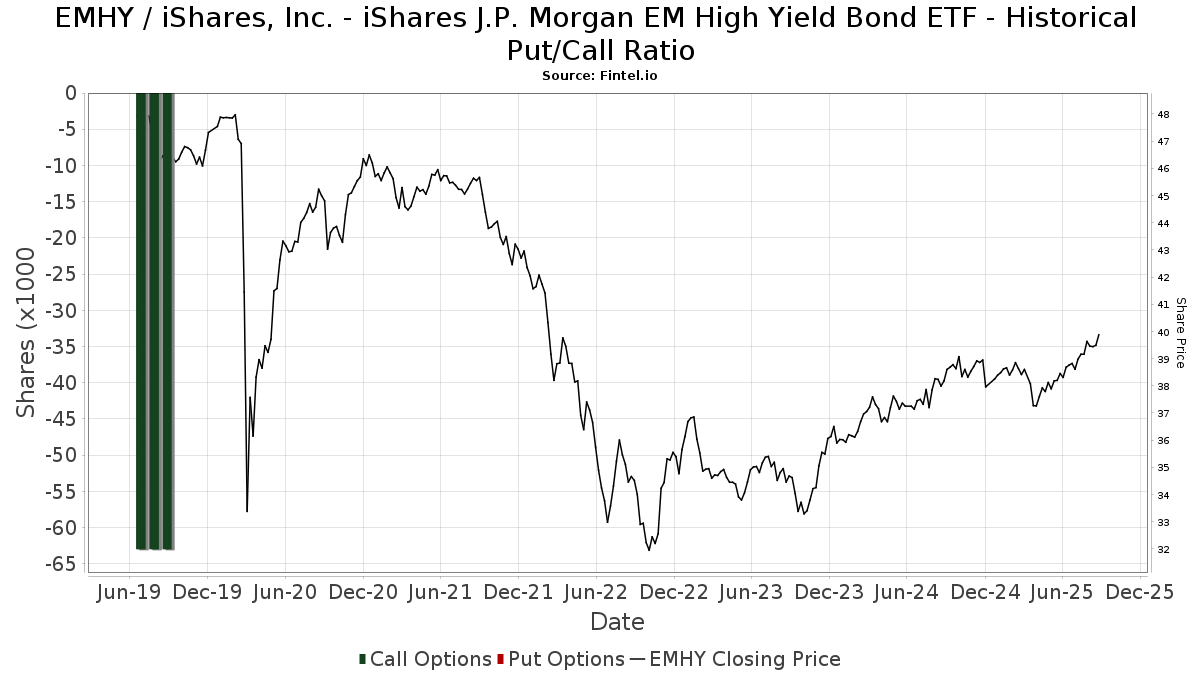
Institutionel Put/Call-forhold
Ud over at indberette standardaktie- og gældsudstedelser skal institutter med mere end 100 mill. aktiver under forvaltning også oplyse deres put- og call-optionsbeholdninger. Da salgsoptioner generelt indikerer negativ stemning, og købsoptioner indikerer positiv stemning, kan vi få en fornemmelse af den overordnede institutionelle stemning ved at plotte forholdet mellem put og kald. Diagrammet til højre viser det historiske put/call-forhold for dette instrument.
Brug af Put/Call Ratio som en indikator for investorernes stemning overvinder en af de vigtigste mangler ved at bruge totalt institutionelt ejerskab, som er, at en betydelig mængde af aktiver under forvaltning investeres passivt for at spore indekser. Passivt forvaltede fonde køber typisk ikke optioner, så indikatoren for put/call-forholdet følger mere nøje følelsen af aktivt forvaltede fonde.
13F og NPORT arkivering
Detaljer om 13F-arkivering er gratis. Detaljer om NP-ansøgninger kræver et premium-medlemskab. Grønne rækker angiver nye positioner. Røde rækker angiver lukkede positioner. Klik på linket ikon for at se den fulde transaktionshistorik.
Opgrader
for at låse premium-data op og eksportere til Excel ![]() .
.
| Fil dato | Kilde | Investor | Type | Gennemsnitlig pris (Øst) |
Aktier | Δ Aktier (%) |
Rapporteret Værdi ($1000) |
Δ Værdi (%) |
Port Alloc (%) |
|
|---|---|---|---|---|---|---|---|---|---|---|
| 2026-02-09 | 13F | Harbour Investments, Inc. | 55 | -26,67 | 2 | 0,00 | ||||
| 2026-02-12 | 13F | Summit Financial, LLC | 320.891 | 0,83 | 12.954 | 2,57 | ||||
| 2026-04-15 | 13F | Redhawk Wealth Advisors, Inc. | 98.459 | -20,46 | 3.877 | -22,41 | ||||
| 2026-04-22 | 13F | Onyx Bridge Wealth Group LLC | 6.985 | 275 | ||||||
| 2026-02-17 | 13F | Royal Bank Of Canada | 18.263 | -68,83 | 738 | -68,24 | ||||
| 2026-02-17 | 13F | Raymond James Financial Inc | 22.868 | 39,72 | 923 | 42,22 | ||||
| 2026-04-16 | 13F | SG Americas Securities, LLC | 0 | -100,00 | 0 | |||||
| 2026-02-10 | 13F | Envestnet Asset Management Inc | 247.340 | 10,95 | 9.985 | 12,86 | ||||
| 2026-02-12 | 13F | CIBC Private Wealth Group, LLC | 6.197 | -0,42 | 250 | 1,63 | ||||
| 2026-02-17 | 13F | D. E. Shaw & Co., Inc. | 0 | -100,00 | 0 | |||||
| 2026-01-14 | 13F | Jfs Wealth Advisors, Llc | 0 | -100,00 | 0 | |||||
| 2026-01-28 | 13F | Geneos Wealth Management Inc. | 150 | 0,00 | 6 | 20,00 | ||||
| 2026-02-17 | 13F | Ameriprise Financial Inc | 22.354 | -73,41 | 902 | -72,96 | ||||
| 2026-04-27 | 13F | Sound Income Strategies, LLC | 983.904 | -2,32 | 38.667 | -5,17 | ||||
| 2026-01-26 | 13F | AE Wealth Management LLC | 96.584 | 4,38 | 3.899 | 6,18 | ||||
| 2025-10-30 | 13F | Envestnet Portfolio Solutions, Inc. | 0 | -100,00 | 0 | -100,00 | ||||
| 2026-02-05 | 13F | Tucker Asset Management Llc | 214 | 9 | ||||||
| 2026-02-12 | 13F | Ruggiero Investments, Inc. | 15.550 | 628 | ||||||
| 2026-02-17 | 13F | Susquehanna International Group, Llp | 0 | -100,00 | 0 | |||||
| 2026-02-13 | 13F | Vontobel Holding Ltd. | 198.084 | 0,74 | 7.997 | 2,46 | ||||
| 2026-02-17 | 13F | Snowden Capital Advisors LLC | 6.087 | -1,90 | 246 | -0,41 | ||||
| 2026-01-29 | 13F | D.a. Davidson & Co. | 14.567 | -0,27 | 588 | 1,55 | ||||
| 2026-02-13 | 13F | Kestra Advisory Services, LLC | 5.700 | 230 | ||||||
| 2026-04-03 | 13F | Investors Research Corp | 1.589 | 0,00 | 63 | -3,12 | ||||
| 2026-02-17 | 13F | Guggenheim Capital Llc | 7.104 | -3,41 | 287 | -1,72 | ||||
| 2025-10-29 | 13F | New Insight Wealth Advisors | 0 | -100,00 | 0 | |||||
| 2026-02-10 | 13F | Bank of New York Mellon Corp | 9.921 | -1,20 | 401 | 0,50 | ||||
| 2026-02-17 | 13F | Ameriflex Group, Inc. | 785 | -50,00 | 32 | -50,00 | ||||
| 2026-02-09 | 13F | Kestra Investment Management, LLC | 95.908 | 82,82 | 3.872 | 85,93 | ||||
| 2025-11-12 | 13F | CIBC Bancorp USA Inc. | 6.223 | 247 | ||||||
| 2026-02-12 | 13F | Rossby Financial, LCC | 288 | -20,88 | 12 | -21,43 | ||||
| 2026-01-27 | 13F | Belpointe Asset Management LLC | 29.456 | 0,72 | 1.189 | 2,50 | ||||
| 2025-11-06 | 13F | Abich Financial Wealth Management LLC | 302 | 12 | ||||||
| 2026-04-27 | 13F | Mosley Wealth Management | 2.109 | 84 | ||||||
| 2026-04-21 | 13F | Pflug Koory, LLC | 107 | 0,00 | 4 | 0,00 | ||||
| 2026-02-12 | 13F | Jane Street Group, Llc | 0 | -100,00 | 0 | |||||
| 2026-01-27 | 13F | TriaGen Wealth Management LLC | 6.502 | 2,36 | 262 | 3,97 | ||||
| 2026-02-12 | 13F | Betterment LLC | 0 | -100,00 | 0 | |||||
| 2026-02-13 | 13F | Ariadne Wealth Management, LP | 14.910 | 0,00 | 608 | 1,67 | ||||
| 2026-02-12 | 13F | BlackRock, Inc. | 774.427 | 8,44 | 31.264 | 10,29 | ||||
| 2026-02-11 | 13F | LPL Financial LLC | 330.159 | 33,24 | 13.329 | 35,53 | ||||
| 2026-02-17 | 13F | Advisor Group Holdings, Inc. | 28.890 | -69,24 | 1.166 | -68,71 | ||||
| 2026-04-07 | 13F | CoreCap Advisors, LLC | 120 | 0,00 | 5 | 0,00 | ||||
| 2026-01-14 | 13F | Global View Capital Management LLC | 0 | -100,00 | 0 | |||||
| 2026-02-13 | 13F | Wells Fargo & Company/mn | 491.995 | -1,25 | 19.862 | 0,45 | ||||
| 2026-02-18 | 13F | GWM Advisors LLC | 61 | -82,16 | 2 | -84,62 | ||||
| 2026-01-26 | 13F | Key Capital Management, INC | 4.034 | 163 | ||||||
| 2026-02-13 | 13F | Colony Group, LLC | 83.303 | 3.363 | ||||||
| 2026-04-16 | 13F | PMV Capital Advisers, LLC | 5 | 0 | ||||||
| 2026-02-02 | 13F | Benjamin Edwards Inc | 18.050 | 15,39 | 729 | 17,42 | ||||
| 2026-01-15 | 13F | Nilsine Partners, LLC | 35.957 | 3,32 | 1.452 | 5,07 | ||||
| 2026-02-05 | 13F | Atria Investments Llc | 115.823 | -16,08 | 4.676 | -14,64 | ||||
| 2026-01-21 | 13F | Capital Investment Advisory Services, LLC | 0 | -100,00 | 0 | -100,00 | ||||
| 2026-02-13 | 13F | Smartleaf Asset Management LLC | 118 | -45,12 | 5 | -50,00 | ||||
| 2026-02-14 | 13F | Rockefeller Capital Management L.P. | 9.901 | -7,91 | 400 | -6,34 | ||||
| 2026-04-27 | 13F | Truist Financial Corp | 18.728 | -7,97 | 738 | -10,23 | ||||
| 2026-02-11 | 13F | Jpmorgan Chase & Co | 184 | 7 | ||||||
| 2026-01-29 | 13F | UBS Group AG | 135.831 | 54,07 | 5.483 | 56,70 | ||||
| 2026-03-06 | 13F | Hsbc Holdings Plc | 6.148 | 1,72 | ||||||
| 2026-02-06 | 13F | Global Retirement Partners, LLC | 33.092 | 2,72 | 1.336 | 4,46 | ||||
| 2026-04-24 | 13F | Merited Wealth, LLC | 0 | -100,00 | 0 | |||||
| 2026-02-13 | 13F | Transamerica Financial Advisors, Inc. | 4 | 0,00 | 0 | |||||
| 2026-02-03 | 13F | Legacy Wealth Managment, LLC/ID | 99 | 4 | ||||||
| 2026-02-12 | 13F | Commonwealth Equity Services, Llc | 11.291 | -8,29 | 456 | |||||
| 2026-04-27 | 13F | Tsfg, Llc | 52 | 1,96 | 0 | |||||
| 2026-02-24 | 13F | Alternative Investment Advisors, LLC. | 5.548 | 1,35 | 224 | 3,23 | ||||
| 2026-04-24 | 13F | Private Advisor Group, LLC | 12.678 | 2,03 | 499 | -0,40 | ||||
| 2026-02-17 | 13F | Advisory Services Network, LLC | 0 | -100,00 | 0 | |||||
| 2026-01-29 | 13F | Sanctuary Advisors, LLC | 10.218 | -3,72 | 413 | -2,14 | ||||
| 2026-04-23 | 13F | Impact Partnership Wealth, LLC | 39.894 | 27,44 | 1.571 | 24,39 | ||||
| 2025-11-10 | 13F | Resources Investment Advisors, LLC. | 0 | -100,00 | 0 | |||||
| 2026-02-17 | 13F | Hyundai Investments Co., Ltd. | 13.954 | 564 | ||||||
| 2026-04-15 | 13F | Iams Wealth Management, Llc | 7.331 | -10,75 | 289 | -12,99 | ||||
| 2026-02-04 | 13F | Ameritas Advisory Services, LLC | 11.684 | 472 | ||||||
| 2026-02-11 | 13F | O'shaughnessy Asset Management, Llc | 2.179 | 83,26 | 88 | 85,11 | ||||
| 2026-01-23 | 13F | Diversify Advisory Services, LLC | 65.273 | 55,54 | 2.642 | 57,45 | ||||
| 2026-02-11 | 13F | Clarity Retirement & Wealth, LLC | 7.130 | 288 | ||||||
| 2026-02-10 | 13F | Foundations Investment Advisors, LLC | 5.168 | -8,48 | 209 | -7,14 | ||||
| 2026-02-13 | 13F | Greenline Wealth Management LLC | 4.563 | 184 | ||||||
| 2026-04-15 | 13F | Optivise Advisory Services LLC | 18.563 | 6,33 | 731 | 3,84 | ||||
| 2026-02-05 | 13F | Mount Lucas Management LP | 70.601 | 2,53 | 2.850 | 4,32 | ||||
| 2026-02-05 | 13F | Cambridge Investment Research Advisors, Inc. | 46.717 | 9,26 | 2 | 0,00 | ||||
| 2026-02-13 | 13F | Mml Investors Services, Llc | 42.018 | 0,77 | 1.696 | 2,54 | ||||
| 2026-02-10 | 13F | Koss-Olinger Consulting, LLC | 0 | -100,00 | 0 | |||||
| 2026-02-12 | 13F | Steward Partners Investment Advisory, Llc | 1.121 | -61,16 | 45 | -60,53 | ||||
| 2026-02-17 | 13F | Bank Of America Corp /de/ | 483.213 | 45,43 | 19.507 | 47,93 | ||||
| 2026-02-17 | 13F | Strategic Investment Advisors / MI | 0 | -100,00 | 0 | |||||
| 2026-04-13 | 13F | Mather Group, Llc. | 12.544 | 494 | ||||||
| 2026-01-27 | 13F | Portfolio Strategies, Inc. | 0 | -100,00 | 0 | |||||
| 2026-02-17 | 13F | Cetera Investment Advisers | 112.413 | -0,76 | 4.538 | 0,96 | ||||
| 2026-04-22 | 13F | Apollon Wealth Management, LLC | 6.215 | -7,76 | 245 | -10,29 | ||||
| 2026-04-02 | 13F | Aspect Partners, LLC | 4.414 | 0,00 | 174 | -2,81 | ||||
| 2026-04-15 | 13F | Compagnie Lombard Odier SCmA | 4.380 | 25,86 | 172 | 22,86 | ||||
| 2026-02-13 | 13F | Mariner, LLC | 167.254 | 3,05 | 6.752 | 4,81 | ||||
| 2026-04-07 | 13F | Farther Finance Advisors, LLC | 6.240 | 129,24 | 245 | 124,77 | ||||
| 2026-04-14 | 13F | Patriot Investment Management Inc. | 6.922 | 0,00 | 273 | -2,51 | ||||
| 2026-01-29 | 13F | Concurrent Investment Advisors, LLC | 8.409 | -12,12 | 339 | -10,55 | ||||
| 2026-02-17 | 13F | Qube Research & Technologies Ltd | 108 | 0,00 | 4 | 0,00 | ||||
| 2026-04-08 | 13F | FOCUS Wealth Advisors, LLC | 50.864 | -4,26 | 2.003 | -6,58 | ||||
| 2026-04-07 | 13F | Blueline Advisors Llc | 87.948 | 51,22 | 3.463 | 47,55 | ||||
| 2026-04-13 | 13F | IFP Advisors, Inc | 4.624 | 0,00 | 182 | -2,15 | ||||
| 2026-02-13 | 13F | National Bank Of Canada /fi/ | 1.039 | 42 | ||||||
| 2026-02-13 | 13F | MAI Capital Management | 8 | 0,00 | 0 | |||||
| 2026-02-20 | 13F | Kovitz Investment Group Partners, LLC | 0 | -100,00 | 0 | |||||
| 2026-01-26 | 13F | Private Trust Co Na | 3.188 | 0,00 | 129 | 1,59 | ||||
| 2026-02-13 | 13F | McAdam, LLC | 17.799 | 30,44 | 719 | 32,72 | ||||
| 2026-01-26 | 13F | Cwm, Llc | 407 | -11,52 | 0 | |||||
| 2026-02-05 | 13F | Bank Julius Baer & Co. Ltd, Zurich | 249.896 | 0,00 | 10.088 | 1,71 | ||||
| 2026-02-17 | 13F | Citadel Advisors Llc | 0 | -100,00 | 0 | |||||
| 2026-04-15 | 13F | Horizon Financial Services, Llc | 5.830 | -1,55 | 230 | -4,18 | ||||
| 2026-04-17 | 13F | High Net Worth Advisory Group LLC | 10.000 | 0,00 | 394 | -2,48 | ||||
| 2026-04-08 | 13F | Wealth Enhancement Advisory Services, Llc | 11.434 | -64,38 | 450 | -65,30 | ||||
| 2026-04-15 | 13F | Wright Fund Managment, LLC | 0 | -100,00 | 0 | |||||
| 2026-04-27 | 13F | Rareview Capital LLC | 19.699 | -70,21 | 768 | -70,23 | ||||
| 2026-02-05 | 13F | Park Square Financial Group, LLC | 0 | -100,00 | 0 | |||||
| 2026-02-12 | 13F | AlphaCentric Advisors LLC | 10.497 | 5,43 | 424 | 11,90 | ||||
| 2026-02-11 | 13F | Janney Montgomery Scott LLC | 0 | -100,00 | 0 | |||||
| 2026-04-24 | 13F | Horizon Wealth Management, LLC | 330.388 | 28,00 | 13.011 | 24,86 | ||||
| 2026-02-17 | 13F | Fmr Llc | 1.034 | 64,91 | 42 | 70,83 | ||||
| 2026-02-13 | 13F | Arkadios Wealth Advisors | 5.789 | 10,86 | 234 | 12,56 | ||||
| 2026-04-14 | 13F | Wealthcare Advisory Partners LLC | 24.751 | 20,99 | 975 | 18,06 | ||||
| 2026-02-05 | 13F | Thrivent Financial For Lutherans | 73.413 | 3 | -99,92 | |||||
| 2026-02-06 | 13F | Advisory Alpha, LLC | 38.024 | 18,30 | 1.535 | 20,77 | ||||
| 2026-02-13 | 13F | Allie Family Office LLC | 6.288 | 254 | ||||||
| 2025-11-12 | 13F | Napa Wealth Management | 12.833 | 2,17 | 509 | 4,09 | ||||
| 2026-04-21 | 13F | Yoffe Investment Management, LLC | 10.512 | -0,01 | 414 | -2,59 | ||||
| 2026-01-29 | 13F | Comerica Bank | 4.035 | 3,17 | 163 | 4,52 | ||||
| 2026-02-17 | 13F | Mercer Global Advisors Inc /adv | 30.431 | -15,77 | 1.229 | -14,31 | ||||
| 2026-02-17 | 13F | NorthRock Partners, LLC | 10.144 | -54,64 | 410 | -53,89 | ||||
| 2025-11-19 | 13F | Sunbelt Securities, Inc. | 0 | -100,00 | 0 | |||||
| 2026-04-09 | 13F | Nelson, Van Denburg & Campbell Wealth Management Group, LLC | 5.299 | -82,48 | 209 | -82,96 | ||||
| 2026-02-09 | 13F | Delta Asset Management Llc/tn | 421 | 0,00 | 17 | 0,00 | ||||
| 2026-02-06 | 13F | Pnc Financial Services Group, Inc. | 700 | 0,00 | 28 | 3,70 | ||||
| 2026-01-23 | 13F | Assetmark, Inc | 1.251.035 | 9,31 | 50.504 | 11,18 | ||||
| 2026-02-13 | 13F | Kensington Asset Management, LLC | 53.432 | 67,38 | 2.160 | 70,40 | ||||
| 2026-02-13 | 13F | Toroso Investments, LLC | 47.821 | -8,55 | 1.931 | -6,49 | ||||
| 2026-02-13 | 13F | Morgan Stanley | 188.025 | -22,84 | 7.591 | -21,53 | ||||
| 2026-04-20 | 13F | Hilton Head Capital Partners, LLC | 67 | 3 |