Grundlæggende statistik
| Institutionelle ejere | 139 total, 139 long only, 0 short only, 0 long/short - change of 0,72% MRQ |
| Gennemsnitlig porteføljeallokering | 0.1294 % - change of -32,36% MRQ |
| Institutionelle aktier (lange) | 26.352.745 (ex 13D/G) - change of 12,83MM shares 94,94% MRQ |
| Institutionel værdi (lang) | $ 267.782 USD ($1000) |
Institutionelt ejerskab og aktionærer
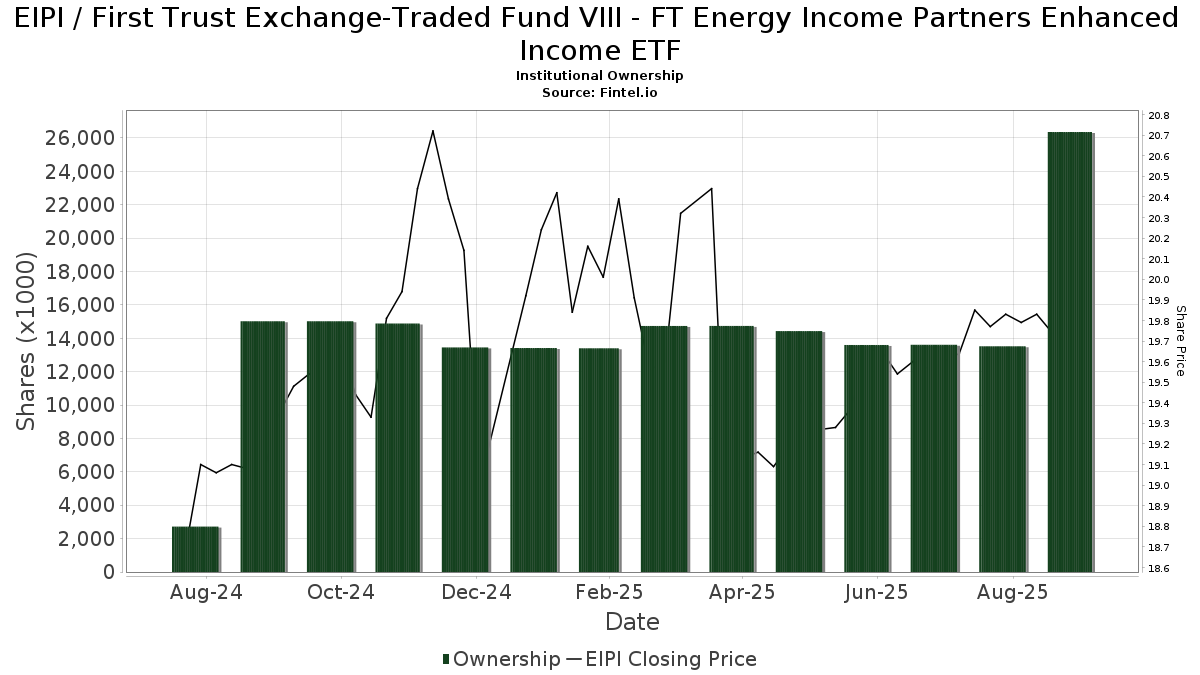
First Trust Exchange-Traded Fund VIII - FT Energy Income Partners Enhanced Income ETF (US:EIPI) har 139 institutionelle ejere og aktionærer, der har indsendt 13D/G- eller 13F-formularer til Securities Exchange Commission (SEC). Disse institutioner har i alt 26,352,745 aktier. Største aktionærer omfatter Proficio Capital Partners LLC, Morgan Stanley, LPL Financial LLC, Coastal Bridge Advisors, LLC, UBS Group AG, Wealthspire Advisors, LLC, Modern Wealth Management, LLC, Royal Bank Of Canada, Raymond James Financial Inc, and Advisors Asset Management, Inc. .
First Trust Exchange-Traded Fund VIII - FT Energy Income Partners Enhanced Income ETF (ARCA:EIPI) institutionel ejerskabsstruktur viser aktuelle positioner i virksomheden efter institutioner og fonde, samt seneste ændringer i positionsstørrelse. Større aktionærer kan omfatte individuelle investorer, investeringsforeninger, hedgefonde eller institutioner. Skema 13D angiver, at investoren besidder (eller besidder) mere end 5 % af virksomheden og har til hensigt (eller har til hensigt at) aktivt at forfølge en ændring i forretningsstrategi. Skema 13G indikerer en passiv investering på over 5%.
The share price as of September 8, 2025 is 19,50 / share. Previously, on September 9, 2024, the share price was 18,99 / share. This represents an increase of 2,69% over that period.
Fondens stemningsscore
Fund Sentiment Score (fka Ownership Accumulation Score) finder de aktier, der bliver mest købt af fonde. Det er resultatet af en sofistikeret, multi-faktor kvantitativ model, der identificerer virksomheder med de højeste niveauer af institutionel akkumulering. Scoringsmodellen bruger en kombination af den samlede stigning i oplyste ejere, ændringerne i porteføljeallokeringer i disse ejere og andre målinger. Tallet går fra 0 til 100, hvor højere tal indikerer et højere niveau af akkumulering for sine jævnaldrende, og 50 er gennemsnittet.
Opdateringsfrekvens: Dagligt
Se Ownership Explorer, som giver en liste over højest rangerende virksomheder.
Institutionel Put/Call-forhold
Ud over at indberette standardaktie- og gældsudstedelser skal institutter med mere end 100 mill. aktiver under forvaltning også oplyse deres put- og call-optionsbeholdninger. Da salgsoptioner generelt indikerer negativ stemning, og købsoptioner indikerer positiv stemning, kan vi få en fornemmelse af den overordnede institutionelle stemning ved at plotte forholdet mellem put og kald. Diagrammet til højre viser det historiske put/call-forhold for dette instrument.
Brug af Put/Call Ratio som en indikator for investorernes stemning overvinder en af de vigtigste mangler ved at bruge totalt institutionelt ejerskab, som er, at en betydelig mængde af aktiver under forvaltning investeres passivt for at spore indekser. Passivt forvaltede fonde køber typisk ikke optioner, så indikatoren for put/call-forholdet følger mere nøje følelsen af aktivt forvaltede fonde.
13F og NPORT arkivering
Detaljer om 13F-arkivering er gratis. Detaljer om NP-ansøgninger kræver et premium-medlemskab. Grønne rækker angiver nye positioner. Røde rækker angiver lukkede positioner. Klik på linket ikon for at se den fulde transaktionshistorik.
Opgrader
for at låse premium-data op og eksportere til Excel ![]() .
.
| Fil dato | Kilde | Investor | Type | Gennemsnitlig pris (Øst) |
Aktier | Δ Aktier (%) |
Rapporteret Værdi ($1000) |
Δ Værdi (%) |
Port Alloc (%) |
|
|---|---|---|---|---|---|---|---|---|---|---|
| 2025-07-09 | 13F | Fiduciary Alliance LLC | 15.449 | -2,00 | 305 | -4,70 | ||||
| 2025-08-08 | 13F | Compass Wealth Management LLC | 0 | -100,00 | 0 | |||||
| 2025-08-14 | 13F | Royal Bank Of Canada | 759.049 | -18,33 | 14.968 | -20,63 | ||||
| 2025-08-14 | 13F | Old Mission Capital Llc | 61.342 | 163,93 | 1.210 | 156,69 | ||||
| 2025-07-11 | 13F | Farther Finance Advisors, LLC | 580 | -84,88 | 11 | -85,90 | ||||
| 2025-07-21 | 13F | Ameriflex Group, Inc. | 0 | -100,00 | 0 | |||||
| 2025-07-30 | 13F | Nottingham Advisors, Inc. | 126.732 | 0,69 | 2.499 | -2,12 | ||||
| 2025-08-04 | 13F | Kovack Advisors, Inc. | 12.786 | -4,12 | 252 | -6,67 | ||||
| 2025-08-08 | 13F | Kingsview Wealth Management, LLC | 126.039 | 0,13 | 2.485 | -2,70 | ||||
| 2025-08-05 | 13F | EPG Wealth Management LLC | 0 | -100,00 | 0 | |||||
| 2025-07-30 | 13F | D.a. Davidson & Co. | 84.613 | 19,00 | 1.669 | 15,67 | ||||
| 2025-07-31 | 13F | Cambridge Investment Research Advisors, Inc. | 289.673 | -10,53 | 6 | -16,67 | ||||
| 2025-05-12 | 13F | Richard W. Paul & Associates, LLC | 0 | -100,00 | 0 | |||||
| 2025-08-12 | 13F | Bokf, Na | 2.137 | -78,07 | 42 | -78,68 | ||||
| 2025-05-15 | 13F | Tower Research Capital LLC (TRC) | 0 | -100,00 | 0 | |||||
| 2025-08-19 | 13F | National Asset Management, Inc. | 11.017 | -16,71 | 217 | -15,56 | ||||
| 2025-09-04 | 13F/A | Advisor Group Holdings, Inc. | 264.480 | 20,06 | 5.213 | 16,65 | ||||
| 2025-07-30 | 13F | Princeton Global Asset Management LLC | 1.790 | 0,00 | 35 | -2,78 | ||||
| 2025-08-14 | 13F | UBS Group AG | 870.211 | -6,92 | 17.161 | -9,54 | ||||
| 2025-08-14 | 13F | Mariner, LLC | 16.237 | 320 | ||||||
| 2025-08-13 | 13F | Latash Investments, LLC | 32.168 | 0,00 | 634 | -2,76 | ||||
| 2025-07-23 | 13F | Kingswood Wealth Advisors, Llc | 79.520 | -4,45 | 1.568 | -7,11 | ||||
| 2025-07-18 | 13F | SOA Wealth Advisors, LLC. | 196 | 0,00 | 4 | 0,00 | ||||
| 2025-07-21 | 13F | Crews Bank & Trust | 599 | 12 | ||||||
| 2025-08-14 | 13F | Comerica Bank | 24.958 | 23,55 | 492 | 20,29 | ||||
| 2025-07-17 | 13F/A | Capital Investment Advisors, LLC | 10.282 | 0,00 | 203 | -2,88 | ||||
| 2025-08-14 | 13F | Riggs Asset Managment Co. Inc. | 328 | -35,69 | 6 | -40,00 | ||||
| 2025-08-12 | 13F | CIBC Private Wealth Group, LLC | 14.141 | 0,00 | 279 | 9,88 | ||||
| 2025-08-14 | 13F | Susquehanna International Group, Llp | 166.475 | 547,38 | 3.283 | 529,94 | ||||
| 2025-05-13 | 13F | Aptus Capital Advisors, LLC | 0 | -100,00 | 0 | |||||
| 2025-08-05 | 13F | Scarborough Advisors, LLC | 1.207 | 24 | ||||||
| 2025-08-11 | 13F | Wealthspire Advisors, LLC | 835.348 | -7,76 | 16.473 | -10,35 | ||||
| 2025-08-11 | 13F | Brown Brothers Harriman & Co | 79.619 | 1.570 | ||||||
| 2025-08-18 | 13F | N.E.W. Advisory Services LLC | 1.789 | -49,03 | 35 | -50,70 | ||||
| 2025-08-14 | 13F | Ancora Advisors, LLC | 1.552 | 1,90 | 31 | 0,00 | ||||
| 2025-05-13 | 13F | Terril Brothers, Inc. | 0 | -100,00 | 0 | |||||
| 2025-08-14 | 13F | Wells Fargo & Company/mn | 47.640 | 0,88 | 939 | -1,98 | ||||
| 2025-08-14 | 13F/A | Rockefeller Capital Management L.P. | 19.395 | 0,00 | 382 | -2,80 | ||||
| 2025-08-14 | 13F | Raymond James Financial Inc | 467.318 | -3,58 | 9.215 | -6,29 | ||||
| 2025-07-22 | 13F | Cedar Mountain Advisors, LLC | 723 | 0,00 | 14 | 0,00 | ||||
| 2025-07-21 | 13F | Catalina Capital Group, LLC | 0 | -100,00 | 0 | |||||
| 2025-07-25 | 13F | Cwm, Llc | 1.716 | 0,00 | 0 | |||||
| 2025-08-04 | 13F | L.m. Kohn & Company | 21.022 | 55,94 | 415 | 51,65 | ||||
| 2025-08-08 | 13F | Pnc Financial Services Group, Inc. | 572 | 0,00 | 11 | 0,00 | ||||
| 2025-08-13 | 13F | EverSource Wealth Advisors, LLC | 0 | -100,00 | 0 | |||||
| 2025-07-16 | 13F | West Branch Capital LLC | 5.911 | 0,00 | 117 | -2,52 | ||||
| 2025-07-24 | 13F | Thompson Investment Management, Inc. | 4.575 | 90 | ||||||
| 2025-08-12 | 13F | Founders Financial Alliance, LLC | 1.740 | 2,35 | 34 | 0,00 | ||||
| 2025-04-30 | 13F | Axxcess Wealth Management, Llc | 0 | -100,00 | 0 | |||||
| 2025-07-31 | 13F | Moloney Securities Asset Management, LLC | 61.003 | 1,99 | 1.203 | -0,91 | ||||
| 2025-08-06 | 13F | Commonwealth Equity Services, Llc | 105.867 | 15,99 | 2 | 100,00 | ||||
| 2025-08-12 | 13F | Wayfinding Financial, LLC | 0 | -100,00 | 0 | |||||
| 2025-08-14 | 13F | Financial Network Wealth Advisors LLC | 797 | 16 | ||||||
| 2025-07-29 | 13F | Koshinski Asset Management, Inc. | 25.207 | 0,06 | 497 | -2,74 | ||||
| 2025-08-12 | 13F | Advisors Asset Management, Inc. | 369.270 | -30,93 | 7.282 | -32,88 | ||||
| 2025-07-14 | 13F | Sowell Financial Services LLC | 155.262 | -0,54 | 3.062 | -3,35 | ||||
| 2025-04-14 | 13F | Umb Bank N A/mo | 0 | -100,00 | 0 | -100,00 | ||||
| 2025-05-16 | 13F/A | Kestra Investment Management, LLC | 0 | -100,00 | 0 | |||||
| 2025-08-07 | 13F | McClarren Financial Advisors, Inc. | 0 | -100,00 | 0 | |||||
| 2025-08-08 | 13F | Avantax Advisory Services, Inc. | 114.504 | 7,17 | 2.258 | 4,15 | ||||
| 2025-09-09 | 13F | NWF Advisory Services Inc. | 104.635 | 5,23 | 2.063 | 2,28 | ||||
| 2025-07-14 | 13F | Whitener Capital Management, Inc. | 17.312 | -7,52 | 341 | -10,03 | ||||
| 2025-08-05 | 13F | Simplex Trading, Llc | 642 | 3.110,00 | 0 | |||||
| 2025-08-12 | 13F | Mystic Asset Management, Inc. | 96.967 | 0,75 | 1.912 | -2,05 | ||||
| 2025-08-04 | 13F | IFG Advisory, LLC | 21.306 | 13,12 | 420 | 9,95 | ||||
| 2025-07-25 | 13F | We Are One Seven, LLC | 69.935 | -2,40 | 1.379 | -5,09 | ||||
| 2025-07-23 | 13F | WESPAC Advisors, LLC | 35.048 | 2,26 | 691 | -0,58 | ||||
| 2025-07-21 | 13F | Future Financial Wealth Managment LLC | 2.541 | 0,00 | 50 | -1,96 | ||||
| 2025-08-15 | 13F | Puff Wealth Management, Llc | 21.249 | 1,57 | 419 | -1,18 | ||||
| 2025-08-07 | 13F | Kestra Private Wealth Services, Llc | 16.296 | 0,46 | 321 | -2,43 | ||||
| 2025-08-19 | 13F | Advisory Services Network, LLC | 11.318 | 0,74 | 225 | -0,88 | ||||
| 2025-07-16 | 13F | Formidable Asset Management, LLC | 55.523 | 0,00 | 1.127 | 0,00 | ||||
| 2025-07-08 | 13F | Nbc Securities, Inc. | 52.637 | 13,45 | 1 | |||||
| 2025-07-11 | 13F | LongView Wealth Management | 215.874 | 0,16 | 4.257 | -2,65 | ||||
| 2025-07-07 | 13F | Thurston, Springer, Miller, Herd & Titak, Inc. | 2.391 | 0,00 | 47 | -2,08 | ||||
| 2025-07-18 | 13F | Dogwood Wealth Management LLC | 1.264 | 25 | ||||||
| 2025-07-17 | 13F | Vermillion Wealth Management, Inc. | 123 | 2,50 | 2 | 0,00 | ||||
| 2025-08-12 | 13F | Park Square Financial Group, LLC | 415 | -25,89 | 8 | -27,27 | ||||
| 2025-08-12 | 13F | Retirement Planning Co of New England, Inc. | 141.504 | 1,39 | 2.790 | -1,45 | ||||
| 2025-08-14 | 13F | Modern Wealth Management, LLC | 814.854 | -1,62 | 16.069 | -4,39 | ||||
| 2025-08-11 | 13F | Principal Securities, Inc. | 1.035 | 2,88 | 20 | 5,26 | ||||
| 2025-07-28 | 13F | Bridges Investment Management Inc | 121.300 | -30,75 | 2.392 | -32,68 | ||||
| 2025-08-04 | 13F | Spire Wealth Management | 4.146 | 0,00 | 82 | -3,57 | ||||
| 2025-08-08 | 13F | Cetera Investment Advisers | 39.344 | 2,98 | 776 | 0,00 | ||||
| 2025-08-12 | 13F | Global Retirement Partners, LLC | 202 | 0,00 | 4 | 0,00 | ||||
| 2025-08-13 | 13F | Northwestern Mutual Wealth Management Co | 21.287 | -4,16 | 420 | -6,89 | ||||
| 2025-07-28 | 13F | Harbour Investments, Inc. | 2.088 | 1,95 | 41 | 0,00 | ||||
| 2025-08-12 | 13F | Pathstone Holdings, LLC | 17.415 | 1,90 | 343 | -0,87 | ||||
| 2025-08-05 | 13F | Prosperity Wealth Management, Inc. | 15.383 | 11,90 | 303 | 8,99 | ||||
| 2025-07-17 | 13F | Janney Montgomery Scott LLC | 21.418 | -4,45 | 0 | |||||
| 2025-05-14 | 13F | Jane Street Group, Llc | 0 | -100,00 | 0 | |||||
| 2025-07-18 | 13F | Truist Financial Corp | 10.829 | -4,68 | 214 | -7,39 | ||||
| 2025-07-24 | 13F | IFP Advisors, Inc | 9.866 | -5,18 | 195 | -8,06 | ||||
| 2025-07-31 | 13F | Stegent Equity Advisors, Inc. | 10.906 | 0,00 | 215 | -2,71 | ||||
| 2025-07-11 | 13F | Pinnacle Bancorp, Inc. | 1.462 | 18,48 | 29 | 12,00 | ||||
| 2025-07-16 | 13F | Cambridge Advisors Inc. | 141.873 | 2,34 | 2.798 | -0,53 | ||||
| 2025-08-04 | 13F | Assetmark, Inc | 1.719 | 34 | ||||||
| 2025-08-28 | NP | Cohen & Steers Closed-end Opportunity Fund, Inc. | 38.937 | -56,22 | 768 | -57,48 | ||||
| 2025-08-05 | 13F | Carolinas Wealth Consulting Llc | 0 | -100,00 | 0 | -100,00 | ||||
| 2025-05-14 | 13F | Ameriprise Financial Inc | 0 | -100,00 | 0 | -100,00 | ||||
| 2025-07-31 | 13F | Whipplewood Advisors, LLC | 8.350 | 64.130,77 | 165 | -2,96 | ||||
| 2025-08-06 | 13F | Prospera Financial Services Inc | 84.895 | 4,78 | 1.674 | 1,82 | ||||
| 2025-08-12 | 13F | Armor Investment Advisors, LLC | 27.113 | -6,54 | 535 | -9,18 | ||||
| 2025-08-14 | 13F | Sunbelt Securities, Inc. | 581 | 0,00 | 11 | 0,00 | ||||
| 2025-05-15 | 13F | Citadel Advisors Llc | 0 | -100,00 | 0 | |||||
| 2025-07-25 | 13F | Atria Wealth Solutions, Inc. | 30.285 | 0,60 | 597 | -2,30 | ||||
| 2025-08-15 | 13F | Kestra Advisory Services, LLC | 37.664 | -3,41 | 743 | -6,19 | ||||
| 2025-07-16 | 13F | Magnus Financial Group LLC | 64.071 | -12,08 | 1.263 | -14,55 | ||||
| 2025-07-22 | 13F | Belpointe Asset Management LLC | 15.377 | 0,00 | 303 | -2,57 | ||||
| 2025-07-28 | 13F | Fairman Group, LLC | 15.709 | 0,00 | 310 | 0,98 | ||||
| 2025-05-14 | 13F | Flow Traders U.s. Llc | 0 | -100,00 | 0 | |||||
| 2025-08-14 | 13F | Stifel Financial Corp | 79.454 | 2,88 | 1.567 | 0,00 | ||||
| 2025-07-21 | 13F | DHJJ Financial Advisors, Ltd. | 1.005 | 0,00 | 20 | -5,00 | ||||
| 2025-08-11 | 13F | Nations Financial Group Inc, /ia/ /adv | 0 | -100,00 | 0 | |||||
| 2025-08-08 | 13F | Altfest L J & Co Inc | 68.064 | 0,83 | 1.342 | -1,97 | ||||
| 2025-08-13 | 13F | Smith, Moore & Co. | 26.052 | 99,07 | 514 | 93,58 | ||||
| 2025-04-28 | 13F | Mutual Advisors, LLC | 0 | -100,00 | 0 | |||||
| 2025-08-14 | 13F | CoreCap Advisors, LLC | 61.867 | 0,41 | 1.220 | -2,40 | ||||
| 2025-08-06 | 13F | Moors & Cabot, Inc. | 27.435 | 3,71 | 541 | 0,93 | ||||
| 2025-08-12 | 13F | LPL Financial LLC | 1.005.342 | 0,78 | 19.825 | -2,06 | ||||
| 2025-08-12 | 13F | Change Path, LLC | 26.941 | -15,20 | 531 | -17,55 | ||||
| 2025-08-15 | 13F | Morgan Stanley | 2.322.813 | -2,08 | 45.805 | -4,83 | ||||
| 2025-08-06 | 13F | Legacy Wealth Managment, LLC/ID | 1.905 | 0,00 | 38 | -2,63 | ||||
| 2025-08-14 | 13F | IHT Wealth Management, LLC | 19.763 | 390 | ||||||
| 2025-08-06 | 13F | AE Wealth Management LLC | 4.139 | 0,10 | 82 | -2,41 | ||||
| 2025-08-06 | 13F | Legacy Investment Solutions, LLC | 1.905 | 0,00 | 38 | -2,63 | ||||
| 2025-08-05 | 13F | Kesler, Norman & Wride, LLC | 14.049 | -2,58 | 277 | -5,14 | ||||
| 2025-08-13 | 13F | Capital Advisors Wealth Management, LLC | 14.055 | 1,95 | 277 | -0,72 | ||||
| 2025-07-29 | 13F | Stratos Wealth Partners, LTD. | 20.809 | 9,10 | 410 | 5,94 | ||||
| 2025-07-07 | 13F | Investors Research Corp | 0 | -100,00 | 0 | |||||
| 2025-08-18 | 13F | Geneos Wealth Management Inc. | 541 | 0,00 | 11 | 0,00 | ||||
| 2025-05-01 | 13F | Schechter Investment Advisors, LLC | 0 | -100,00 | 0 | |||||
| 2025-07-24 | 13F | Us Bancorp \de\ | 1.003 | 2,98 | 20 | 0,00 | ||||
| 2025-08-14 | 13F | Icon Wealth Advisors, LLC | 19.815 | 1,92 | 391 | -1,02 | ||||
| 2025-08-11 | 13F | HighTower Advisors, LLC | 24.934 | -11,12 | 492 | -13,71 | ||||
| 2025-08-29 | NP | OneAscent Capital Opportunities Fund | 40.000 | 95,12 | 789 | 89,88 | ||||
| 2025-07-31 | 13F | Strait & Sound Wealth Management LLC | 67.313 | 9,51 | 1.327 | 6,42 | ||||
| 2025-08-01 | 13F | Winebrenner Capital Management Llc | 85.952 | -0,28 | 1.695 | -3,09 | ||||
| 2025-08-05 | 13F | Sigma Planning Corp | 11.670 | 4,26 | 230 | 1,32 | ||||
| 2025-08-07 | 13F | Allworth Financial LP | 2.532 | 78,31 | 50 | 81,48 | ||||
| 2025-07-31 | 13F | AlTi Global, Inc. | 48.539 | -0,27 | 957 | -3,04 | ||||
| 2025-08-07 | 13F | Resources Investment Advisors, LLC. | 44.554 | -7,92 | 879 | -10,50 | ||||
| 2025-08-14 | 13F | Coastal Bridge Advisors, LLC | 892.783 | 2,28 | 17.605 | -0,60 | ||||
| 2025-07-25 | 13F | Concurrent Investment Advisors, LLC | 18.183 | 359 | ||||||
| 2025-08-13 | 13F | Baird Financial Group, Inc. | 0 | -100,00 | 0 | |||||
| 2025-08-13 | 13F | Cresset Asset Management, LLC | 54.428 | 0,00 | 1.073 | -2,81 | ||||
| 2025-08-14 | 13F | GWM Advisors LLC | 40.751 | -10,29 | 804 | -12,81 | ||||
| 2025-08-07 | 13F | Proficio Capital Partners LLC | 12.937.487 | 13.399 | ||||||
| 2025-08-12 | 13F | MAI Capital Management | 41.382 | -0,49 | 816 | -3,20 | ||||
| 2025-08-08 | 13F | SBI Securities Co., Ltd. | 7 | 0 | ||||||
| 2025-07-29 | 13F | Stephens Inc /ar/ | 42.413 | 0,03 | 836 | -2,79 | ||||
| 2025-08-12 | 13F | Proequities, Inc. | 0 | 0 | ||||||
| 2025-07-31 | 13F | Oppenheimer & Co Inc | 189.379 | 0,55 | 3.735 | -2,28 | ||||
| 2025-08-14 | 13F | Cohen & Steers, Inc. | 38.937 | -56,22 | 1 | -100,00 | ||||
| 2025-08-01 | 13F | Bessemer Group Inc | 1.688 | 0 | ||||||
| 2025-07-22 | 13F | Iron Horse Wealth Management, LLC | 0 | -100,00 | 0 | |||||
| 2025-08-11 | 13F | Private Advisor Group, LLC | 46.093 | -0,94 | 909 | -3,81 | ||||
| 2025-07-29 | 13F | Salomon & Ludwin, LLC | 704 | 0,00 | 14 | -7,14 | ||||
| 2025-07-25 | 13F | Community Bank, N.A. | 100.000 | 0,00 | 1.971 | -2,81 | ||||
| 2025-07-30 | 13F | Whittier Trust Co Of Nevada Inc | 16.060 | 0,00 | 317 | -2,77 | ||||
| 2025-08-12 | 13F | Steward Partners Investment Advisory, Llc | 45.605 | 1,82 | 899 | -0,99 | ||||
| 2025-08-14 | 13F | Bank Of America Corp /de/ | 11.721 | 231 | ||||||
| 2025-07-10 | 13F | Wealth Enhancement Advisory Services, Llc | 98.833 | -1,99 | 1.947 | -4,79 | ||||
| 2025-07-23 | 13F | Morey & Quinn Wealth Partners, LLC | 0 | -100,00 | 0 | |||||
| 2025-07-25 | 13F | Hazlett, Burt & Watson, Inc. | 1.479 | 0,00 | 0 | |||||
| 2025-08-14 | 13F | Aqr Capital Management Llc | 14.433 | 285 |