Grundlæggende statistik
| Institutionelle ejere | 105 total, 105 long only, 0 short only, 0 long/short - change of 101,92% MRQ |
| Gennemsnitlig porteføljeallokering | 0.0118 % - change of -25,60% MRQ |
| Institutionelle aktier (lange) | 1.218.740 (ex 13D/G) - change of 0,62MM shares 102,80% MRQ |
| Institutionel værdi (lang) | $ 34.269 USD ($1000) |
Institutionelt ejerskab og aktionærer
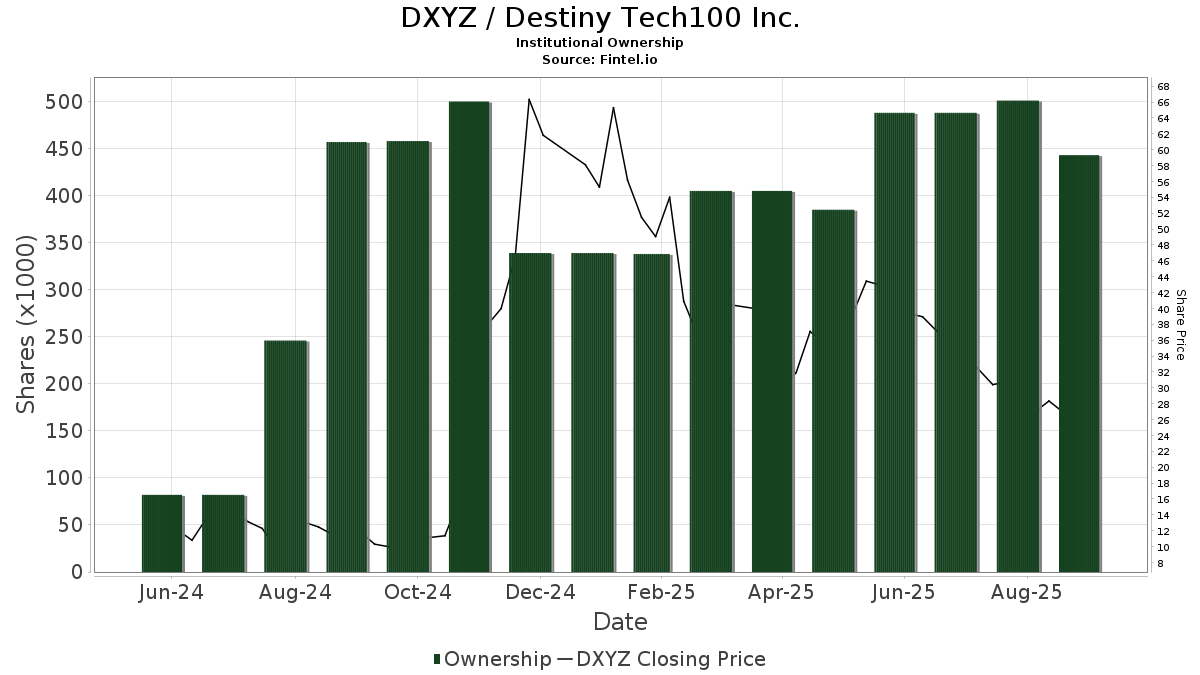
Destiny Tech100 Inc. (US:DXYZ) har 105 institutionelle ejere og aktionærer, der har indsendt 13D/G- eller 13F-formularer til Securities Exchange Commission (SEC). Disse institutioner har i alt 1,218,740 aktier. Største aktionærer omfatter Jane Street Group, Llc, Morgan Stanley, LPL Financial LLC, AA Financial Advisors, LLC, Advisor Group Holdings, Inc., Stifel Financial Corp, Cetera Investment Advisers, Invesco Ltd., Wedbush Securities Inc, and Virtu Financial LLC .
Destiny Tech100 Inc. (NYSE:DXYZ) institutionel ejerskabsstruktur viser aktuelle positioner i virksomheden efter institutioner og fonde, samt seneste ændringer i positionsstørrelse. Større aktionærer kan omfatte individuelle investorer, investeringsforeninger, hedgefonde eller institutioner. Skema 13D angiver, at investoren besidder (eller besidder) mere end 5 % af virksomheden og har til hensigt (eller har til hensigt at) aktivt at forfølge en ændring i forretningsstrategi. Skema 13G indikerer en passiv investering på over 5%.
The share price as of April 24, 2026 is 29,44 / share. Previously, on April 28, 2025, the share price was 38,19 / share. This represents a decline of 22,91% over that period.
Fondens stemningsscore
Fund Sentiment Score (fka Ownership Accumulation Score) finder de aktier, der bliver mest købt af fonde. Det er resultatet af en sofistikeret, multi-faktor kvantitativ model, der identificerer virksomheder med de højeste niveauer af institutionel akkumulering. Scoringsmodellen bruger en kombination af den samlede stigning i oplyste ejere, ændringerne i porteføljeallokeringer i disse ejere og andre målinger. Tallet går fra 0 til 100, hvor højere tal indikerer et højere niveau af akkumulering for sine jævnaldrende, og 50 er gennemsnittet.
Opdateringsfrekvens: Dagligt
Se Ownership Explorer, som giver en liste over højest rangerende virksomheder.
AI+ Ask Fintel’s AI assistant about Destiny Tech100 Inc..
Select a question to share a public post with an AI-crafted answer.
Thinking of good questions…
Institutionel Put/Call-forhold
Ud over at indberette standardaktie- og gældsudstedelser skal institutter med mere end 100 mill. aktiver under forvaltning også oplyse deres put- og call-optionsbeholdninger. Da salgsoptioner generelt indikerer negativ stemning, og købsoptioner indikerer positiv stemning, kan vi få en fornemmelse af den overordnede institutionelle stemning ved at plotte forholdet mellem put og kald. Diagrammet til højre viser det historiske put/call-forhold for dette instrument.
Brug af Put/Call Ratio som en indikator for investorernes stemning overvinder en af de vigtigste mangler ved at bruge totalt institutionelt ejerskab, som er, at en betydelig mængde af aktiver under forvaltning investeres passivt for at spore indekser. Passivt forvaltede fonde køber typisk ikke optioner, så indikatoren for put/call-forholdet følger mere nøje følelsen af aktivt forvaltede fonde.
13F og NPORT arkivering
Detaljer om 13F-arkivering er gratis. Detaljer om NP-ansøgninger kræver et premium-medlemskab. Grønne rækker angiver nye positioner. Røde rækker angiver lukkede positioner. Klik på linket ikon for at se den fulde transaktionshistorik.
Opgrader
for at låse premium-data op og eksportere til Excel ![]() .
.
| Fil dato | Kilde | Investor | Type | Gennemsnitlig pris (Øst) |
Aktier | Δ Aktier (%) |
Rapporteret Værdi ($1000) |
Δ Værdi (%) |
Port Alloc (%) |
|
|---|---|---|---|---|---|---|---|---|---|---|
| 2026-02-04 | 13F | Atlantic Union Bankshares Corp | 700 | 21 | ||||||
| 2026-04-17 | 13F | Total Clarity Wealth Management, Inc. | 20.252 | 180,11 | 542 | 145,25 | ||||
| 2026-04-15 | 13F | Nations Financial Group Inc, /ia/ /adv | 14.026 | 376 | ||||||
| 2026-02-12 | 13F | Steward Partners Investment Advisory, Llc | 311 | 211,00 | 10 | 350,00 | ||||
| 2026-02-06 | 13F | HighTower Advisors, LLC | 7.104 | 218 | ||||||
| 2026-02-13 | 13F | Greenline Wealth Management LLC | 15 | 0 | ||||||
| 2025-11-14 | 13F | Strategic Wealth Partners, Ltd. | 20 | 0,00 | 0 | |||||
| 2025-11-14 | 13F | One Capital Management, LLC | 0 | -100,00 | 0 | |||||
| 2026-04-22 | 13F | Coston, McIsaac & Partners | 3.262 | 0 | ||||||
| 2026-02-17 | 13F | Cetera Investment Advisers | 33.335 | 1.021 | ||||||
| 2026-02-09 | 13F | Hartland & Co., LLC | 0 | -100,00 | 0 | |||||
| 2026-04-21 | 13F | GHP Investment Advisors, Inc. | 365 | 0,00 | 10 | -18,18 | ||||
| 2026-01-16 | 13F | Genesis Financial Group, LLC | 10.000 | 306 | ||||||
| 2026-02-17 | 13F | Bank Of America Corp /de/ | 1.380 | 2,22 | 42 | 50,00 | ||||
| 2026-04-17 | 13F | HHM Wealth Advisors, LLC | 100 | 3 | ||||||
| 2026-02-09 | 13F | Atlantic Trust, LLC | 1.384 | 42 | ||||||
| 2026-01-28 | 13F | N.E.W. Advisory Services LLC | 300 | 9 | ||||||
| 2026-02-13 | 13F | Stifel Financial Corp | 42.079 | 81,69 | 1.289 | 161,26 | ||||
| 2026-02-12 | 13F | Triumph Capital Management | 50 | 0,00 | 2 | 0,00 | ||||
| 2026-04-22 | 13F | Spire Wealth Management | 30 | 1 | ||||||
| 2026-04-13 | 13F | Mather Group, Llc. | 9.031 | 242 | ||||||
| 2026-04-21 | 13F | Wedbush Securities Inc | 26.265 | 173,59 | 1 | |||||
| 2026-04-07 | 13F | Farther Finance Advisors, LLC | 6.907 | 79,87 | 202 | 71,79 | ||||
| 2025-11-05 | 13F | HighPoint Advisor Group LLC | 0 | -100,00 | 0 | |||||
| 2026-01-29 | 13F | Dunhill Financial, LLC | 1 | 0 | ||||||
| 2026-02-03 | 13F | Legacy Wealth Managment, LLC/ID | 80 | 0,00 | 2 | 100,00 | ||||
| 2026-02-10 | 13F | Ritter Daniher Financial Advisory LLC / DE | 250 | 8 | ||||||
| 2025-11-06 | 13F | Financial Advocates Investment Management | 0 | -100,00 | 0 | -100,00 | ||||
| 2026-04-14 | 13F | Beacon Investment Advisory Services, Inc. | 165 | 4 | ||||||
| 2026-02-19 | 13F | Mcguire Capital Advisors Inc | 101 | 3 | ||||||
| 2026-02-13 | 13F | Pinnacle Wealth Planning Services, Inc. | 295 | 9 | ||||||
| 2026-04-17 | 13F | Gibson Capital, LLC | 10.000 | 268 | ||||||
| 2026-02-12 | 13F | Federation des caisses Desjardins du Quebec | 95 | 0,00 | 3 | 0,00 | ||||
| 2026-02-17 | 13F | Quantinno Capital Management LP | 12.377 | 379 | ||||||
| 2026-02-26 | 13F | Anchor Investment Management, LLC | 640 | 0,00 | 20 | 46,15 | ||||
| 2026-01-27 | 13F | TD Waterhouse Canada Inc. | 250 | 0,00 | 8 | 0,00 | ||||
| 2025-10-29 | 13F | Walkner Condon Financial Advisors LLC | 0 | -100,00 | 0 | |||||
| 2026-04-17 | 13F | AdvisorNet Financial, Inc | 3 | 0 | ||||||
| 2026-01-23 | 13F | Avion Wealth | 80 | 0 | ||||||
| 2026-02-12 | 13F | Jane Street Group, Llc | 377.545 | 278,76 | 11.564 | 444,70 | ||||
| 2026-02-12 | 13F | Ankerstar Wealth, LLC | 278 | 9 | ||||||
| 2026-04-15 | 13F | Valley National Advisers Inc | 75 | 0 | ||||||
| 2026-02-17 | 13F | Cresset Asset Management, LLC | 7.787 | 239 | ||||||
| 2026-02-05 | 13F | Allworth Financial LP | 2.196 | 67 | ||||||
| 2026-04-03 | 13F | Investors Research Corp | 30 | 1 | ||||||
| 2026-02-17 | 13F | Private Advisor Group, LLC | 15.093 | -0,73 | 462 | 43,03 | ||||
| 2026-02-10 | 13F | Hazlett, Burt & Watson, Inc. | 11.040 | 29,27 | 0 | |||||
| 2026-04-08 | 13F | Evanson Asset Management, LLC | 7.500 | -50,00 | 201 | -56,43 | ||||
| 2026-04-13 | 13F | Trust Co | 104 | 60,00 | 3 | 100,00 | ||||
| 2026-02-02 | 13F | Cornerstone Planning Group LLC | 278 | 10 | ||||||
| 2025-11-14 | 13F | Ancora Advisors, LLC | 0 | -100,00 | 0 | -100,00 | ||||
| 2026-02-10 | 13F | Envestnet Asset Management Inc | 13.608 | 417 | ||||||
| 2026-04-10 | 13F | Armstrong Advisory Group, Inc | 186 | 5 | ||||||
| 2026-04-22 | 13F | Stone House Investment Management, LLC | 100 | 3 | ||||||
| 2026-02-17 | 13F | Tower Research Capital LLC (TRC) | 0 | -100,00 | 0 | |||||
| 2026-02-13 | 13F | Wells Fargo & Company/mn | 205 | 24,24 | 6 | 100,00 | ||||
| 2026-04-20 | 13F | Ronald Blue Trust, Inc. | 170 | 277,78 | 5 | 300,00 | ||||
| 2026-02-12 | 13F | CIBC Private Wealth Group, LLC | 15.291 | 468 | ||||||
| 2026-01-21 | 13F | Newbridge Financial Services Group, Inc. | 322 | 10 | ||||||
| 2025-10-27 | 13F | WealthPlan Investment Management, LLC | 0 | -100,00 | 0 | |||||
| 2026-02-17 | 13F | Royal Bank Of Canada | 622 | -19,43 | 19 | 18,75 | ||||
| 2026-01-30 | 13F | Catalytic Wealth RIA, LLC | 18.000 | -35,71 | 551 | -7,55 | ||||
| 2025-11-13 | 13F | Parallel Advisors, LLC | 0 | -100,00 | 0 | |||||
| 2026-01-28 | 13F | Geneos Wealth Management Inc. | 648 | 20 | ||||||
| 2025-11-14 | 13F | Susquehanna International Group, Llp | 0 | -100,00 | 0 | -100,00 | ||||
| 2026-02-13 | 13F | Barclays Plc | 0 | -100,00 | 0 | |||||
| 2026-02-17 | 13F | Scientech Research LLC | 9.931 | 304 | ||||||
| 2026-02-13 | 13F | Mariner, LLC | 14.953 | 16,58 | 458 | 67,77 | ||||
| 2025-11-14 | 13F | Credit Agricole S A | 0 | -100,00 | 0 | |||||
| 2026-02-06 | 13F | Lloyd Advisory Services, LLC. | 100 | 3 | ||||||
| 2026-02-13 | 13F | Visionary Wealth Advisors | 7.847 | 240 | ||||||
| 2026-02-17 | 13F | Advisor Group Holdings, Inc. | 42.176 | 37,97 | 1.292 | 82,09 | ||||
| 2026-02-18 | 13F | GWM Advisors LLC | 719 | -32,30 | 22 | 0,00 | ||||
| 2026-04-07 | 13F | Signaturefd, Llc | 510 | 0,00 | 14 | -13,33 | ||||
| 2026-01-23 | 13F | Steigerwald, Gordon & Koch Inc. | 100 | 3 | ||||||
| 2026-02-12 | 13F | Commonwealth Equity Services, Llc | 19.879 | -1,31 | 609 | |||||
| 2026-02-13 | 13F | Kestra Advisory Services, LLC | 0 | -100,00 | 0 | |||||
| 2026-02-06 | 13F | Griffin Asset Management, Inc. | 6.780 | 208 | ||||||
| 2026-02-12 | 13F | Groupe la Francaise | 0 | -100,00 | 0 | -100,00 | ||||
| 2026-02-26 | 13F | TD Capital Management LLC | 346 | 11 | ||||||
| 2026-04-24 | 13F | UMA Financial Services, Inc. | 470 | 0,00 | 13 | -14,29 | ||||
| 2026-02-10 | 13F | KERR FINANCIAL PLANNING Corp | 210 | 5,00 | 6 | 50,00 | ||||
| 2026-04-02 | 13F | Noble Wealth Management PBC | 300 | 8 | ||||||
| 2026-02-11 | 13F | LPL Financial LLC | 71.993 | 5,32 | 2.205 | 51,44 | ||||
| 2026-04-13 | 13F | Creative Financial Designs Inc /adv | 8.987 | 31,64 | 241 | 14,83 | ||||
| 2026-02-17 | 13F | Raymond James Financial Inc | 12.163 | 373 | ||||||
| 2025-11-07 | 13F | Jpmorgan Chase & Co | 0 | -100,00 | 0 | -100,00 | ||||
| 2026-01-20 | 13F | Stratos Wealth Partners, LTD. | 12.752 | 391 | ||||||
| 2026-02-13 | 13F | Morgan Stanley | 86.645 | 78,46 | 2.654 | 156,58 | ||||
| 2026-04-17 | 13F | Murphy & Mullick Capital Management Corp | 350 | 250,00 | 9 | 200,00 | ||||
| 2026-04-22 | 13F | Atlantic Edge Private Wealth Management, LLC | 50 | 0,00 | 1 | 0,00 | ||||
| 2026-02-06 | 13F | Pnc Financial Services Group, Inc. | 5.092 | 5.434,78 | 156 | 15.400,00 | ||||
| 2026-02-09 | 13F | Harbour Investments, Inc. | 1.272 | -83,05 | 39 | -76,10 | ||||
| 2026-04-20 | 13F | Jfs Wealth Advisors, Llc | 180 | 20,00 | 5 | 0,00 | ||||
| 2026-02-13 | 13F | National Bank Of Canada /fi/ | 7 | 0,00 | 0 | |||||
| 2026-02-06 | 13F | Global Retirement Partners, LLC | 4.280 | 3,13 | 131 | 48,86 | ||||
| 2026-02-17 | 13F | Wiley Bros.-aintree Capital, Llc | 11.969 | 17,72 | 367 | 69,44 | ||||
| 2026-01-26 | 13F | Cwm, Llc | 1.200 | 0 | ||||||
| 2026-04-21 | 13F | AA Financial Advisors, LLC | 61.000 | -12,86 | 1.634 | -23,83 | ||||
| 2026-01-22 | 13F | Bartlett & Co. Wealth Management Llc | 2.400 | 0,00 | 74 | 43,14 | ||||
| 2025-11-14 | 13F | Mount Yale Investment Advisors, LLC | 0 | -100,00 | 0 | -100,00 | ||||
| 2026-02-20 | 13F | Sunbelt Securities, Inc. | 900 | 28 | ||||||
| 2026-04-23 | 13F | Glass Jacobson Investment Advisors llc | 100 | 3 | ||||||
| 2026-04-14 | 13F | Tradewinds Capital Management, LLC | 25 | 0,00 | 1 | |||||
| 2026-04-20 | 13F | Kestra Private Wealth Services, Llc | 24.095 | 645 | ||||||
| 2026-02-23 | 13F | Virtu Financial LLC | 24.256 | 1 | ||||||
| 2026-02-05 | 13F | Cambridge Investment Research Advisors, Inc. | 7.896 | 0 | ||||||
| 2026-04-13 | 13F | IFP Advisors, Inc | 11.600 | 311 | ||||||
| 2026-04-03 | 13F | Hickory Point Bank & Trust | 400 | 11 | ||||||
| 2026-02-17 | 13F | Creative Planning | 11.712 | 359 | ||||||
| 2026-02-19 | 13F | Invesco Ltd. | 28.752 | -12,12 | 881 | 26,44 | ||||
| 2026-04-20 | 13F | Hilton Head Capital Partners, LLC | 25 | 0,00 | 1 | |||||
| 2026-02-11 | 13F | MCF Advisors LLC | 500 | 15 | ||||||
| 2026-04-07 | 13F | CoreCap Advisors, LLC | 38 | -92,94 | 1 | -93,75 | ||||
| 2026-02-04 | 13F | Ameritas Advisory Services, LLC | 0 | -100,00 | 0 | |||||
| 2026-01-29 | 13F | UBS Group AG | 19.053 | -35,72 | 584 | -7,61 | ||||
| 2025-11-04 | 13F | Strategy Asset Managers Llc | 0 | -100,00 | 0 | |||||
| 2026-04-15 | 13F | Merit Financial Group, LLC | 12.133 | 325 | ||||||
| 2026-02-13 | 13F | Colony Group, LLC | 11.233 | 344 | ||||||
| 2026-04-23 | 13F | Private Wealth Management Group, LLC | 42 | 1 | ||||||
| 2026-04-17 | 13F | Ignite Planners, LLC | 8.748 | 234 | ||||||
| 2026-02-09 | 13F | Blue Bell Private Wealth Management, Llc | 10 | 0 | ||||||
| 2026-02-12 | 13F | Wealthspire Advisors, LLC | 0 | -100,00 | 0 | -100,00 | ||||
| 2026-02-17 | 13F | Mpwm Advisory Solutions, Llc | 230 | 7 |