Grundlæggende statistik
| Institutionelle ejere | 102 total, 102 long only, 0 short only, 0 long/short - change of 24,10% MRQ |
| Gennemsnitlig porteføljeallokering | 0.1670 % - change of 151,30% MRQ |
| Institutionelle aktier (lange) | 6.247.880 (ex 13D/G) - change of 0,89MM shares 16,52% MRQ |
| Institutionel værdi (lang) | $ 271.432 USD ($1000) |
Institutionelt ejerskab og aktionærer
WisdomTree Trust - WisdomTree International High Dividend Fund (US:DTH) har 102 institutionelle ejere og aktionærer, der har indsendt 13D/G- eller 13F-formularer til Securities Exchange Commission (SEC). Disse institutioner har i alt 6,247,880 aktier. Største aktionærer omfatter Bank Of America Corp /de/, LPL Financial LLC, Morgan Stanley, Mariner, LLC, Beacon Pointe Advisors, LLC, Envestnet Asset Management Inc, Stonebridge Wealth Management, LLC, Thrivent Financial For Lutherans, Wealthspire Advisors, LLC, and Flow Traders U.s. Llc .
WisdomTree Trust - WisdomTree International High Dividend Fund (ARCA:DTH) institutionel ejerskabsstruktur viser aktuelle positioner i virksomheden efter institutioner og fonde, samt seneste ændringer i positionsstørrelse. Større aktionærer kan omfatte individuelle investorer, investeringsforeninger, hedgefonde eller institutioner. Skema 13D angiver, at investoren besidder (eller besidder) mere end 5 % af virksomheden og har til hensigt (eller har til hensigt at) aktivt at forfølge en ændring i forretningsstrategi. Skema 13G indikerer en passiv investering på over 5%.
The share price as of September 16, 2025 is 49,76 / share. Previously, on September 17, 2024, the share price was 41,16 / share. This represents an increase of 20,88% over that period.

Fondens stemningsscore
Fund Sentiment Score (fka Ownership Accumulation Score) finder de aktier, der bliver mest købt af fonde. Det er resultatet af en sofistikeret, multi-faktor kvantitativ model, der identificerer virksomheder med de højeste niveauer af institutionel akkumulering. Scoringsmodellen bruger en kombination af den samlede stigning i oplyste ejere, ændringerne i porteføljeallokeringer i disse ejere og andre målinger. Tallet går fra 0 til 100, hvor højere tal indikerer et højere niveau af akkumulering for sine jævnaldrende, og 50 er gennemsnittet.
Opdateringsfrekvens: Dagligt
Se Ownership Explorer, som giver en liste over højest rangerende virksomheder.
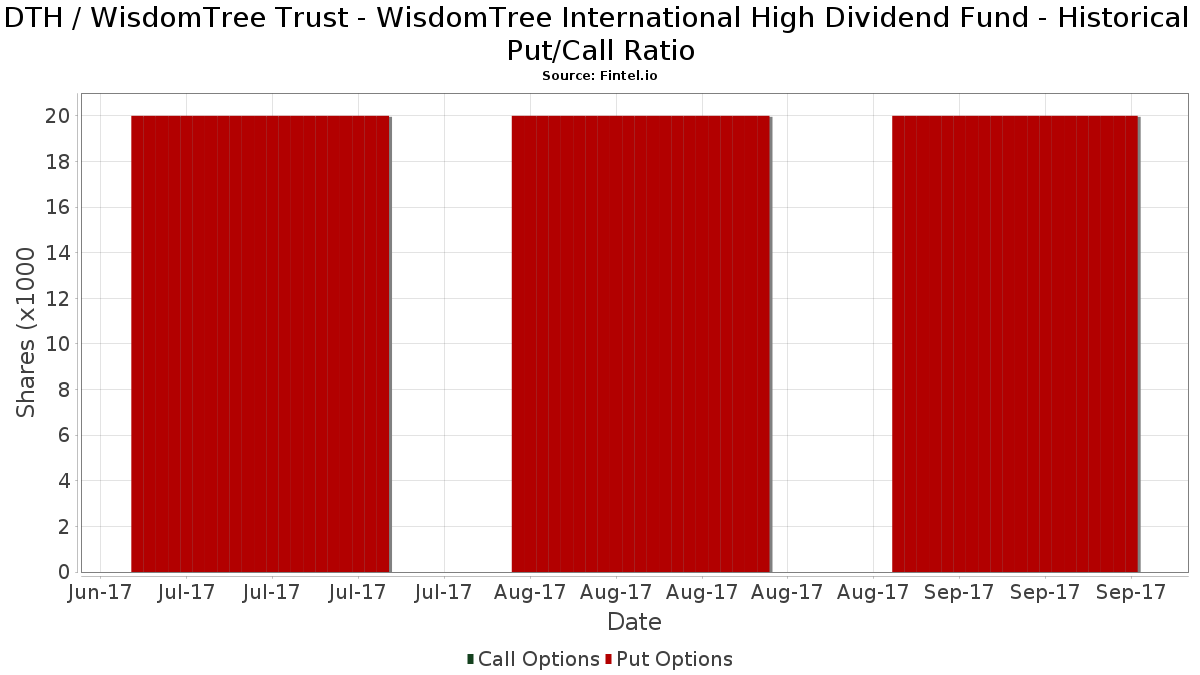
Institutionel Put/Call-forhold
Ud over at indberette standardaktie- og gældsudstedelser skal institutter med mere end 100 mill. aktiver under forvaltning også oplyse deres put- og call-optionsbeholdninger. Da salgsoptioner generelt indikerer negativ stemning, og købsoptioner indikerer positiv stemning, kan vi få en fornemmelse af den overordnede institutionelle stemning ved at plotte forholdet mellem put og kald. Diagrammet til højre viser det historiske put/call-forhold for dette instrument.
Brug af Put/Call Ratio som en indikator for investorernes stemning overvinder en af de vigtigste mangler ved at bruge totalt institutionelt ejerskab, som er, at en betydelig mængde af aktiver under forvaltning investeres passivt for at spore indekser. Passivt forvaltede fonde køber typisk ikke optioner, så indikatoren for put/call-forholdet følger mere nøje følelsen af aktivt forvaltede fonde.
13F og NPORT arkivering
Detaljer om 13F-arkivering er gratis. Detaljer om NP-ansøgninger kræver et premium-medlemskab. Grønne rækker angiver nye positioner. Røde rækker angiver lukkede positioner. Klik på linket ikon for at se den fulde transaktionshistorik.
Opgrader
for at låse premium-data op og eksportere til Excel ![]() .
.
| Fil dato | Kilde | Investor | Type | Gennemsnitlig pris (Øst) |
Aktier | Δ Aktier (%) |
Rapporteret Værdi ($1000) |
Δ Værdi (%) |
Port Alloc (%) |
|
|---|---|---|---|---|---|---|---|---|---|---|
| 2025-07-16 | 13F | Formidable Asset Management, LLC | 53.332 | 0,00 | 2.265 | 0,00 | ||||
| 2025-08-29 | NP | DEW - WisdomTree Global High Dividend Fund N/A | 4.369 | -22,29 | 202 | -15,13 | ||||
| 2025-08-14 | 13F | UBS Group AG | 76.542 | 5,13 | 3.546 | 14,72 | ||||
| 2025-07-14 | 13F | Painted Porch Advisors LLC | 190 | 2,15 | 9 | 14,29 | ||||
| 2025-08-12 | 13F | Steward Partners Investment Advisory, Llc | 88.032 | -2,19 | 4.079 | 6,73 | ||||
| 2025-08-14 | 13F/A | Rockefeller Capital Management L.P. | 45.378 | -3,58 | 2.103 | 5,21 | ||||
| 2025-07-10 | 13F | Wealth Enhancement Advisory Services, Llc | 4.557 | 212 | ||||||
| 2025-08-13 | 13F | Flow Traders U.s. Llc | 103.028 | 1,96 | 5 | 0,00 | ||||
| 2025-07-29 | 13F | ShoreHaven Wealth Partners, LLC | 28.594 | 1.325 | ||||||
| 2025-07-21 | 13F | Ameritas Advisory Services, LLC | 1.087 | 50 | ||||||
| 2025-07-15 | 13F | Axis Wealth Partners, LLC | 6.890 | -7,95 | 319 | 0,63 | ||||
| 2025-05-07 | 13F | WMS Partners, LLC | 0 | -100,00 | 0 | |||||
| 2025-09-04 | 13F/A | Advisor Group Holdings, Inc. | 39.831 | 69,60 | 1.845 | 85,06 | ||||
| 2025-08-13 | 13F | Valued Retirements, Inc. | 4.350 | 202 | ||||||
| 2025-07-30 | 13F | Patten Group, Inc. | 27.321 | 40,64 | 1.266 | 53,52 | ||||
| 2025-07-17 | 13F | Sound Income Strategies, LLC | 1.575 | 73 | ||||||
| 2025-04-29 | 13F | Element Wealth, LLC | 0 | -100,00 | 0 | |||||
| 2025-08-08 | 13F | Cetera Investment Advisers | 76.863 | 4,08 | 3.561 | 13,59 | ||||
| 2025-08-12 | 13F | MAI Capital Management | 345 | 0,00 | 16 | 7,14 | ||||
| 2025-08-12 | 13F | O'shaughnessy Asset Management, Llc | 124 | -81,01 | 6 | -81,48 | ||||
| 2025-07-31 | 13F | Brinker Capital Investments, LLC | 0 | -100,00 | 0 | -100,00 | ||||
| 2025-07-24 | 13F | Blair William & Co/il | 468 | 0,00 | 22 | 10,53 | ||||
| 2025-08-14 | 13F | Stifel Financial Corp | 6.254 | -6,22 | 290 | 2,12 | ||||
| 2025-08-12 | 13F | Clearwater Capital Advisors, LLC | 10.933 | -7,76 | 507 | 0,60 | ||||
| 2025-08-14 | 13F | GWM Advisors LLC | 5.004 | 0,66 | 232 | 9,48 | ||||
| 2025-07-17 | 13F | Janney Montgomery Scott LLC | 6.355 | 8,30 | 0 | |||||
| 2025-08-13 | 13F | Vertex Planning Partners, LLC | 10.469 | -25,50 | 485 | -18,62 | ||||
| 2025-07-28 | 13F | WealthPlan Investment Management, LLC | 42.562 | -3,76 | 1.972 | 5,06 | ||||
| 2025-08-04 | 13F | Assetmark, Inc | 156 | 0,00 | 7 | 16,67 | ||||
| 2025-08-25 | 13F | Hilltop Partners LLC | 15.068 | 0,00 | 698 | 9,23 | ||||
| 2025-08-11 | 13F | Wealthspire Advisors, LLC | 123.135 | -13,20 | 5.705 | -5,28 | ||||
| 2025-08-08 | 13F | Larson Financial Group LLC | 0 | -100,00 | 0 | |||||
| 2025-08-15 | 13F | Captrust Financial Advisors | 10.909 | 59,16 | 505 | 73,54 | ||||
| 2025-05-15 | 13F | FSA Wealth Management LLC | 0 | -100,00 | 0 | |||||
| 2025-08-14 | 13F | Susquehanna International Group, Llp | 16.855 | 781 | ||||||
| 2025-08-07 | 13F | American Alpha Advisors, LLC | 89.021 | 627,59 | 4.125 | 694,61 | ||||
| 2025-08-14 | 13F | Mml Investors Services, Llc | 15.612 | -9,49 | 1 | |||||
| 2025-08-12 | 13F | Passive Capital Management, LLC. | 7.270 | 0,00 | 337 | 9,09 | ||||
| 2025-08-08 | 13F | Hartland & Co., LLC | 2.250 | 104 | ||||||
| 2025-07-11 | 13F | Farther Finance Advisors, LLC | 320 | -2,74 | 15 | 0,00 | ||||
| 2025-08-11 | 13F | Principal Securities, Inc. | 1.084 | -7,67 | 50 | 13,64 | ||||
| 2025-08-05 | 13F | Prosperity Wealth Management, Inc. | 5.791 | 268 | ||||||
| 2025-08-13 | 13F | Great Diamond Partners, LLC | 21.510 | 997 | ||||||
| 2025-08-14 | 13F | Royal Bank Of Canada | 37.692 | 33,82 | 1.746 | 45,99 | ||||
| 2025-07-24 | 13F | Jfs Wealth Advisors, Llc | 620 | -35,68 | 29 | -30,00 | ||||
| 2025-08-01 | 13F | Envestnet Asset Management Inc | 160.243 | 2,07 | 7.425 | 11,37 | ||||
| 2025-04-09 | 13F | Sanders Morris Harris Llc | 0 | -100,00 | 0 | -100,00 | ||||
| 2025-08-12 | 13F | Proequities, Inc. | 0 | 0 | ||||||
| 2025-08-11 | 13F | Rothschild Investment Llc | 382 | 0,26 | 18 | 6,25 | ||||
| 2025-08-04 | 13F | Amplius Wealth Advisors, LLC | 5.968 | 0,00 | 277 | 9,09 | ||||
| 2025-05-15 | 13F | Citadel Advisors Llc | 0 | -100,00 | 0 | |||||
| 2025-08-12 | 13F | Farmers National Bank | 32.334 | 37,08 | 1.498 | 49,65 | ||||
| 2025-07-22 | 13F | Wealthcare Advisory Partners LLC | 84.861 | 5,17 | 3.932 | 14,74 | ||||
| 2025-08-06 | 13F | Moors & Cabot, Inc. | 43.741 | 1,36 | 2.027 | 10,59 | ||||
| 2025-08-14 | 13F | Snowden Capital Advisors LLC | 72.304 | -0,13 | 3.350 | 8,98 | ||||
| 2025-08-12 | 13F | Jpmorgan Chase & Co | 28.297 | 5.341,73 | 1.311 | 5.859,09 | ||||
| 2025-07-22 | 13F | Wealthcare Capital Partners, LLC | 19.743 | 12,93 | 915 | 23,18 | ||||
| 2025-07-24 | 13F | KFA Private Wealth Group, LLC | 6.300 | 292 | ||||||
| 2025-08-12 | 13F | Putnam Fl Investment Management Co | 38.519 | -8,42 | 1.785 | -0,06 | ||||
| 2025-07-08 | 13F | Goldstone Financial Group, LLC | 60.530 | 2.822 | ||||||
| 2025-07-28 | 13F | BRYN MAWR TRUST Co | 7.920 | 0,00 | 367 | 8,93 | ||||
| 2025-08-14 | 13F | Fmr Llc | 2.565 | 88,19 | 119 | 107,02 | ||||
| 2025-07-23 | 13F | Lansing Street Advisors | 24.769 | 24,88 | 1.148 | 36,22 | ||||
| 2025-08-13 | 13F | Baird Financial Group, Inc. | 65.981 | 3,14 | 3.057 | 12,56 | ||||
| 2025-08-14 | 13F | Bank Of America Corp /de/ | 1.351.194 | -6,58 | 62.606 | 1,94 | ||||
| 2025-08-12 | 13F | Global Retirement Partners, LLC | 1.255 | 25,50 | 58 | 56,76 | ||||
| 2025-07-23 | 13F | Valmark Advisers, Inc. | 6.233 | 0,00 | 289 | 9,09 | ||||
| 2025-08-07 | 13F | Cahill Financial Advisors Inc | 96.375 | 1,74 | 4.465 | 11,01 | ||||
| 2025-08-15 | 13F | Morgan Stanley | 742.510 | 0,20 | 34.403 | 9,34 | ||||
| 2025-08-11 | 13F | HighTower Advisors, LLC | 6.587 | -12,47 | 305 | -4,39 | ||||
| 2025-07-31 | 13F | Cambridge Investment Research Advisors, Inc. | 44.633 | -1,06 | 2 | 100,00 | ||||
| 2025-08-14 | 13F | IHT Wealth Management, LLC | 6.570 | -3,10 | 304 | 5,92 | ||||
| 2025-04-15 | 13F | Fifth Third Bancorp | 0 | -100,00 | 0 | -100,00 | ||||
| 2025-07-24 | 13F | IFP Advisors, Inc | 20.940 | 3.522,84 | 970 | 3.941,67 | ||||
| 2025-08-01 | 13F | Solstein Capital, LLC | 40 | 0,00 | 2 | 0,00 | ||||
| 2025-07-22 | 13F | D.B. Root & Company, LLC | 12.925 | -1,01 | 599 | 7,94 | ||||
| 2025-08-14 | 13F | Mariner, LLC | 341.038 | 47,36 | 15.802 | 60,81 | ||||
| 2025-08-04 | 13F | Creekmur Asset Management LLC | 436 | 1,40 | 20 | 11,11 | ||||
| 2025-08-06 | 13F | Commonwealth Equity Services, Llc | 23.339 | 42,19 | 1 | |||||
| 2025-08-13 | 13F | Jones Financial Companies Lllp | 30.444 | 29,44 | 1.406 | 40,08 | ||||
| 2025-08-14 | 13F | BCS Private Wealth Management, Inc. | 8.813 | 0 | ||||||
| 2025-07-25 | 13F | Cwm, Llc | 4.205 | 0 | ||||||
| 2025-08-11 | 13F | Tidemark, LLC | 7.765 | -6,58 | 360 | 1,99 | ||||
| 2025-07-15 | 13F | Evanson Asset Management, LLC | 90.075 | -6,62 | 4.174 | 1,90 | ||||
| 2025-05-12 | 13F | Independent Advisor Alliance | 0 | -100,00 | 0 | |||||
| 2025-08-12 | 13F | LPL Financial LLC | 799.762 | 33,27 | 37.056 | 45,43 | ||||
| 2025-08-14 | 13F | Wells Fargo & Company/mn | 84.325 | -5,62 | 3.907 | 3,01 | ||||
| 2025-08-05 | 13F | Huntington National Bank | 0 | |||||||
| 2025-08-08 | 13F | Pnc Financial Services Group, Inc. | 2.093 | 0,00 | 97 | 9,09 | ||||
| 2025-08-13 | 13F | Northwestern Mutual Wealth Management Co | 2.127 | 8,47 | 99 | 18,07 | ||||
| 2025-08-14 | 13F | Raymond James Financial Inc | 93.944 | 12,87 | 4.353 | 23,15 | ||||
| 2025-08-14 | 13F | Wiley Bros.-aintree Capital, Llc | 6.990 | 324 | ||||||
| 2025-07-09 | 13F | Breakwater Capital Group | 32.548 | -3,32 | 1.508 | 5,53 | ||||
| 2025-08-14 | 13F | Jane Street Group, Llc | 69.682 | 3.229 | ||||||
| 2025-08-13 | 13F | Crescent Grove Advisors, LLC | 36.426 | 7,76 | 1.688 | 17,56 | ||||
| 2025-07-25 | 13F | PrairieView Partners, LLC | 30.773 | -0,09 | 1 | 0,00 | ||||
| 2025-07-14 | 13F | UMA Financial Services, Inc. | 170 | 8 | ||||||
| 2025-05-21 | 13F/A | Geneos Wealth Management Inc. | 657 | 28 | ||||||
| 2025-08-13 | 13F | EverSource Wealth Advisors, LLC | 200 | 0,00 | 9 | 12,50 | ||||
| 2025-08-14 | 13F | Comerica Bank | 26.408 | 22,22 | 1.224 | 33,37 | ||||
| 2025-07-25 | 13F | Priebe Wealth Holdings LLC | 9.700 | 449 | ||||||
| 2025-07-25 | 13F | Atria Wealth Solutions, Inc. | 0 | -100,00 | 0 | |||||
| 2025-08-13 | 13F | Beacon Pointe Advisors, LLC | 161.235 | 0,01 | 7.471 | 9,13 | ||||
| 2025-08-05 | 13F | Bank of New York Mellon Corp | 4.371 | -22,27 | 203 | -15,13 | ||||
| 2025-08-14 | 13F | Mercer Global Advisors Inc /adv | 49.051 | -7,68 | 2.273 | 0,71 | ||||
| 2025-07-16 | 13F | ORG Partners LLC | 2.000 | 93 | ||||||
| 2025-08-12 | 13F | AlphaCore Capital LLC | 325 | 15 | ||||||
| 2025-07-02 | 13F | Lvm Capital Management Ltd/mi | 5.205 | -2,35 | 0 | |||||
| 2025-08-27 | 13F | Stonebridge Wealth Management, LLC | 148.134 | 6.864 | ||||||
| 2025-08-04 | 13F | Savvy Advisors, Inc. | 5.843 | 0,00 | 271 | 8,87 | ||||
| 2025-07-17 | 13F | Greenleaf Trust | 80.201 | -0,53 | 3.716 | 8,56 | ||||
| 2025-07-17 | 13F | HB Wealth Management, LLC | 7.000 | 0,00 | 324 | 9,09 | ||||
| 2025-08-11 | 13F | Anb Bank | 4.419 | 205 | ||||||
| 2025-08-26 | 13F/A | Thrivent Financial For Lutherans | 142.711 | 7 |