Grundlæggende statistik
| Institutionelle ejere | 125 total, 125 long only, 0 short only, 0 long/short - change of 1,63% MRQ |
| Gennemsnitlig porteføljeallokering | 0.0072 % - change of -50,62% MRQ |
| Institutionelle aktier (lange) | 2.578.654 (ex 13D/G) - change of 0,01MM shares 0,24% MRQ |
| Institutionel værdi (lang) | $ 55.324 USD ($1000) |
Institutionelt ejerskab og aktionærer
Global X Funds - Global X Autonomous & Electric Vehicles ETF (US:DRIV) har 125 institutionelle ejere og aktionærer, der har indsendt 13D/G- eller 13F-formularer til Securities Exchange Commission (SEC). Disse institutioner har i alt 2,578,654 aktier. Største aktionærer omfatter Bank Of America Corp /de/, LPL Financial LLC, Jane Street Group, Llc, Hancock Prospecting Pty Ltd, Envestnet Asset Management Inc, Northwestern Mutual Wealth Management Co, Flow Traders U.s. Llc, Advisor Group Holdings, Inc., Cetera Investment Advisers, and Raymond James Financial Inc .
Global X Funds - Global X Autonomous & Electric Vehicles ETF (NasdaqGM:DRIV) institutionel ejerskabsstruktur viser aktuelle positioner i virksomheden efter institutioner og fonde, samt seneste ændringer i positionsstørrelse. Større aktionærer kan omfatte individuelle investorer, investeringsforeninger, hedgefonde eller institutioner. Skema 13D angiver, at investoren besidder (eller besidder) mere end 5 % af virksomheden og har til hensigt (eller har til hensigt at) aktivt at forfølge en ændring i forretningsstrategi. Skema 13G indikerer en passiv investering på over 5%.
The share price as of September 11, 2025 is 26,43 / share. Previously, on September 12, 2024, the share price was 21,70 / share. This represents an increase of 21,80% over that period.

Fondens stemningsscore
Fund Sentiment Score (fka Ownership Accumulation Score) finder de aktier, der bliver mest købt af fonde. Det er resultatet af en sofistikeret, multi-faktor kvantitativ model, der identificerer virksomheder med de højeste niveauer af institutionel akkumulering. Scoringsmodellen bruger en kombination af den samlede stigning i oplyste ejere, ændringerne i porteføljeallokeringer i disse ejere og andre målinger. Tallet går fra 0 til 100, hvor højere tal indikerer et højere niveau af akkumulering for sine jævnaldrende, og 50 er gennemsnittet.
Opdateringsfrekvens: Dagligt
Se Ownership Explorer, som giver en liste over højest rangerende virksomheder.
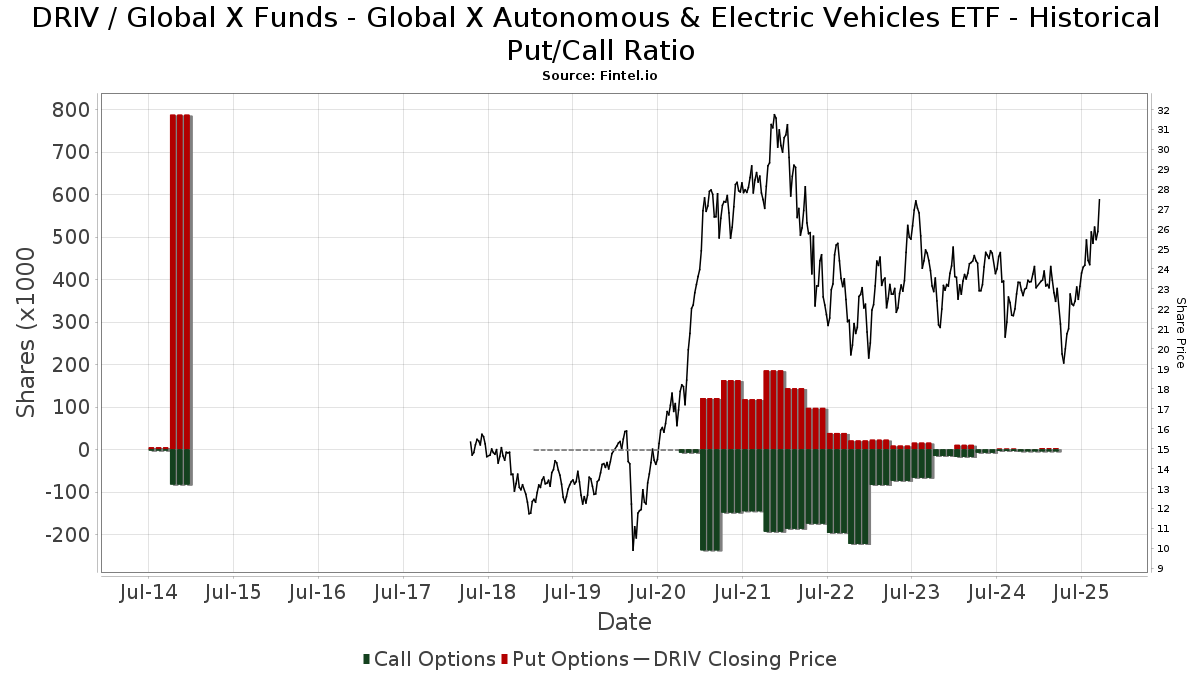
Institutionel Put/Call-forhold
Ud over at indberette standardaktie- og gældsudstedelser skal institutter med mere end 100 mill. aktiver under forvaltning også oplyse deres put- og call-optionsbeholdninger. Da salgsoptioner generelt indikerer negativ stemning, og købsoptioner indikerer positiv stemning, kan vi få en fornemmelse af den overordnede institutionelle stemning ved at plotte forholdet mellem put og kald. Diagrammet til højre viser det historiske put/call-forhold for dette instrument.
Brug af Put/Call Ratio som en indikator for investorernes stemning overvinder en af de vigtigste mangler ved at bruge totalt institutionelt ejerskab, som er, at en betydelig mængde af aktiver under forvaltning investeres passivt for at spore indekser. Passivt forvaltede fonde køber typisk ikke optioner, så indikatoren for put/call-forholdet følger mere nøje følelsen af aktivt forvaltede fonde.
13F og NPORT arkivering
Detaljer om 13F-arkivering er gratis. Detaljer om NP-ansøgninger kræver et premium-medlemskab. Grønne rækker angiver nye positioner. Røde rækker angiver lukkede positioner. Klik på linket ikon for at se den fulde transaktionshistorik.
Opgrader
for at låse premium-data op og eksportere til Excel ![]() .
.
| Fil dato | Kilde | Investor | Type | Gennemsnitlig pris (Øst) |
Aktier | Δ Aktier (%) |
Rapporteret Værdi ($1000) |
Δ Værdi (%) |
Port Alloc (%) |
|
|---|---|---|---|---|---|---|---|---|---|---|
| 2025-08-05 | 13F | GPS Wealth Strategies Group, LLC | 2.619 | -21,47 | 61 | -12,86 | ||||
| 2025-07-21 | 13F | Crews Bank & Trust | 1.750 | 0,00 | 41 | 11,11 | ||||
| 2025-08-12 | 13F | Jpmorgan Chase & Co | 362 | 0,00 | 8 | 14,29 | ||||
| 2025-08-14 | 13F | Citadel Advisors Llc | Put | 0 | -100,00 | 0 | ||||
| 2025-08-14 | 13F | Citadel Advisors Llc | 28.898 | -12,97 | 673 | -3,99 | ||||
| 2025-07-25 | 13F | Cwm, Llc | 9.334 | -2,47 | 0 | |||||
| 2025-07-15 | 13F | SJS Investment Consulting Inc. | 80 | 0,00 | 2 | 0,00 | ||||
| 2025-08-12 | 13F | Global Retirement Partners, LLC | 607 | -85,40 | 14 | -85,26 | ||||
| 2025-08-14 | 13F | D. E. Shaw & Co., Inc. | 21.037 | 0,00 | 490 | 10,36 | ||||
| 2025-08-08 | 13F | New England Capital Financial Advisors LLC | 19 | 0,00 | 0 | |||||
| 2025-07-31 | 13F | Brinker Capital Investments, LLC | 0 | -100,00 | 0 | -100,00 | ||||
| 2025-08-06 | 13F | Legacy Investment Solutions, LLC | 5 | 0,00 | 0 | |||||
| 2025-08-12 | 13F | Solano Wealth Investment Advisors LLC | 13.500 | -2,70 | 315 | 7,17 | ||||
| 2025-05-14 | 13F | Ameriprise Financial Inc | 0 | -100,00 | 0 | |||||
| 2025-07-23 | 13F | Hager Investment Management Services, Llc | 475 | -15,93 | 11 | 0,00 | ||||
| 2025-08-14 | 13F/A | Barclays Plc | 3.000 | 0,00 | 0 | |||||
| 2025-08-07 | 13F | Kestra Private Wealth Services, Llc | 9.985 | -3,34 | 233 | 6,42 | ||||
| 2025-08-14 | 13F | Qube Research & Technologies Ltd | 217 | 0,00 | 5 | 25,00 | ||||
| 2025-08-05 | 13F | Key FInancial Inc | 1.021 | 0,00 | 24 | 9,52 | ||||
| 2025-07-11 | 13F | First PREMIER Bank | 740 | 0,00 | 0 | |||||
| 2025-07-29 | 13F | Stratos Wealth Partners, LTD. | 10.602 | -16,85 | 247 | -8,18 | ||||
| 2025-07-10 | 13F | Atticus Wealth Management, Llc | 2.210 | 0,00 | 52 | 10,87 | ||||
| 2025-07-14 | 13F | Armstrong Advisory Group, Inc | 1.140 | -56,44 | 27 | -56,67 | ||||
| 2025-08-22 | 13F | Carter Financial Group, INC. | 0 | -100,00 | 0 | |||||
| 2025-08-13 | 13F | Summit Financial, LLC | 10.677 | -87,02 | 251 | -85,62 | ||||
| 2025-08-14 | 13F | Citadel Advisors Llc | Call | 0 | -100,00 | 0 | ||||
| 2025-08-06 | 13F | Legacy Wealth Managment, LLC/ID | 5 | 0,00 | 0 | |||||
| 2025-08-11 | 13F | Strategic Wealth Partners, Ltd. | 625 | 15 | ||||||
| 2025-08-14 | 13F | McIlrath & Eck, LLC | 41 | 0,00 | 1 | |||||
| 2025-07-22 | 13F | Powell Investment Advisors, LLC | 1.100 | 26 | ||||||
| 2025-07-16 | 13F/A | CX Institutional | 25.226 | -72,35 | 1 | -100,00 | ||||
| 2025-08-12 | 13F | Pathstone Holdings, LLC | 0 | -100,00 | 0 | |||||
| 2025-08-12 | 13F | SRS Capital Advisors, Inc. | 610 | 0,00 | 14 | 16,67 | ||||
| 2025-08-07 | 13F | Flagship Wealth Advisors, Llc | 174 | 0,00 | 4 | 33,33 | ||||
| 2025-07-21 | 13F | Ameriflex Group, Inc. | 500 | 0,00 | 12 | 10,00 | ||||
| 2025-07-21 | 13F | DHJJ Financial Advisors, Ltd. | 947 | 22 | ||||||
| 2025-07-31 | 13F | Oppenheimer & Co Inc | 9.075 | 211 | ||||||
| 2025-07-31 | 13F | Cambridge Investment Research Advisors, Inc. | 24.433 | -28,02 | 1 | |||||
| 2025-08-11 | 13F | Principal Securities, Inc. | 165 | 43,48 | 4 | 50,00 | ||||
| 2025-07-22 | 13F | Cedar Mountain Advisors, LLC | 79 | 0,00 | 2 | 0,00 | ||||
| 2025-07-29 | 13F | Stephens Inc /ar/ | 12.545 | 0,00 | 292 | 10,19 | ||||
| 2025-08-14 | 13F | Mml Investors Services, Llc | 23.398 | -5,65 | 1 | |||||
| 2025-04-28 | 13F | D.a. Davidson & Co. | 0 | -100,00 | 0 | |||||
| 2025-05-16 | 13F | Coppell Advisory Solutions LLC | 0 | -100,00 | 0 | |||||
| 2025-08-04 | 13F | Creekmur Asset Management LLC | 379 | 0,00 | 9 | 0,00 | ||||
| 2025-07-08 | 13F | Parallel Advisors, LLC | 1.250 | 2,46 | 29 | 16,00 | ||||
| 2025-08-11 | 13F | TD Waterhouse Canada Inc. | 7.600 | -0,05 | 177 | 10,63 | ||||
| 2025-08-12 | 13F | MAI Capital Management | 163 | -18,91 | 4 | -25,00 | ||||
| 2025-07-11 | 13F | Global X Japan Co., Ltd. | 3.934 | -2,72 | 92 | 7,06 | ||||
| 2025-04-22 | 13F | PFG Investments, LLC | 0 | -100,00 | 0 | |||||
| 2025-08-01 | 13F | First Command Advisory Services, Inc. | 1.000 | 0,00 | 23 | 9,52 | ||||
| 2025-08-08 | 13F | SBI Securities Co., Ltd. | 1.241 | -18,89 | 29 | -12,50 | ||||
| 2025-08-05 | 13F | Bank Of Montreal /can/ | 1.442 | -29,38 | 34 | -23,26 | ||||
| 2025-08-06 | 13F | Golden State Wealth Management, LLC | 591 | 0,00 | 14 | 8,33 | ||||
| 2025-07-10 | 13F | Wealth Enhancement Advisory Services, Llc | 14.373 | -17,29 | 346 | -5,99 | ||||
| 2025-08-14 | 13F | Ancora Advisors, LLC | 539 | 65,85 | 13 | 100,00 | ||||
| 2025-08-13 | 13F | Flow Traders U.s. Llc | 71.444 | 2 | ||||||
| 2025-08-12 | 13F | Proequities, Inc. | 0 | 0 | ||||||
| 2025-08-14 | 13F | Jane Street Group, Llc | 253.976 | 5.918 | ||||||
| 2025-07-21 | 13F | Ameritas Advisory Services, LLC | 72 | 2 | ||||||
| 2025-08-06 | 13F | Commonwealth Equity Services, Llc | 40.199 | -12,35 | 1 | |||||
| 2025-08-18 | 13F | Hollencrest Capital Management | 505 | 0,00 | 12 | 10,00 | ||||
| 2025-05-15 | 13F | Mariner, LLC | 0 | -100,00 | 0 | |||||
| 2025-05-15 | 13F | Prospera Financial Services Inc | 0 | -100,00 | 0 | |||||
| 2025-08-18 | 13F | Geneos Wealth Management Inc. | 143 | -86,87 | 3 | -86,96 | ||||
| 2025-04-01 | 13F | Modus Advisors, LLC | 0 | -100,00 | 0 | |||||
| 2025-07-02 | 13F | HBW Advisory Services LLC | 0 | -100,00 | 0 | -100,00 | ||||
| 2025-08-14 | 13F | Stifel Financial Corp | 28.269 | -13,07 | 659 | -4,22 | ||||
| 2025-07-16 | 13F | Signaturefd, Llc | 0 | -100,00 | 0 | |||||
| 2025-07-28 | 13F | CGC Financial Services, LLC | 173 | -12,63 | 4 | 0,00 | ||||
| 2025-08-08 | 13F | Creative Planning | 12.355 | 0,14 | 288 | 10,38 | ||||
| 2025-07-24 | 13F | Us Bancorp \de\ | 177 | 4 | ||||||
| 2025-08-14 | 13F | UBS Group AG | 34.739 | 105,98 | 809 | 127,25 | ||||
| 2025-07-11 | 13F | Adirondack Trust Co | 1.260 | 0,00 | 29 | 11,54 | ||||
| 2025-07-16 | 13F | Signature Resources Capital Management, LLC | 225 | 0,00 | 5 | 25,00 | ||||
| 2025-08-06 | 13F | AE Wealth Management LLC | 862 | 116,58 | 20 | 150,00 | ||||
| 2025-07-14 | 13F | Painted Porch Advisors LLC | 0 | -100,00 | 0 | -100,00 | ||||
| 2025-08-14 | 13F | Glenmede Investment Management, LP | 610 | 14 | ||||||
| 2025-07-18 | 13F | Trust Co Of Vermont | 5 | 0,00 | 0 | |||||
| 2025-08-14 | 13F | CoreCap Advisors, LLC | 0 | -100,00 | 0 | |||||
| 2025-05-15 | 13F | Hrt Financial Lp | 0 | -100,00 | 0 | |||||
| 2025-08-14 | 13F | Bank Of America Corp /de/ | 732.440 | -7,92 | 17.066 | 1,49 | ||||
| 2025-07-24 | 13F | IFP Advisors, Inc | 217 | 4,83 | 5 | 25,00 | ||||
| 2025-08-08 | 13F | Pnc Financial Services Group, Inc. | 11.647 | -21,06 | 271 | -12,86 | ||||
| 2025-08-08 | 13F | Cetera Investment Advisers | 56.043 | 0,54 | 1.306 | 10,78 | ||||
| 2025-08-12 | 13F | Stelac Advisory Services LLC | 7.782 | 0,00 | 183 | 10,98 | ||||
| 2025-07-30 | 13F | Advantage Trust Co | 1.880 | 44 | ||||||
| 2025-04-28 | 13F | Strategic Financial Concepts, LLC | 0 | -100,00 | 0 | -100,00 | ||||
| 2025-07-07 | 13F | General Partner, Inc. | 2.000 | 0,00 | 47 | 9,52 | ||||
| 2025-08-05 | 13F | Simplex Trading, Llc | 0 | -100,00 | 0 | |||||
| 2025-08-07 | 13F | Allworth Financial LP | 11.441 | 4,28 | 267 | 17,18 | ||||
| 2025-07-18 | 13F | SOA Wealth Advisors, LLC. | 2.148 | 0,00 | 50 | 11,11 | ||||
| 2025-05-13 | 13F | HighTower Advisors, LLC | 0 | -100,00 | 0 | |||||
| 2025-05-13 | 13F | Measured Risk Portfolios, Inc. | 0 | -100,00 | 0 | |||||
| 2025-08-12 | 13F | Change Path, LLC | 21.747 | 9,83 | 507 | 21,05 | ||||
| 2025-08-13 | 13F | Northwestern Mutual Wealth Management Co | 81.977 | -6,51 | 1.910 | 3,08 | ||||
| 2025-08-13 | 13F | Congress Wealth Management LLC / DE / | 33.686 | 785 | ||||||
| 2025-08-14 | 13F | Murphy & Mullick Capital Management Corp | 375 | 0,00 | 9 | 14,29 | ||||
| 2025-09-04 | 13F/A | Advisor Group Holdings, Inc. | 61.425 | 1,42 | 1.432 | 11,80 | ||||
| 2025-08-01 | 13F | Envestnet Asset Management Inc | 85.573 | 8,72 | 1.994 | 19,84 | ||||
| 2025-08-12 | 13F | LPL Financial LLC | 315.471 | 11,92 | 7.350 | 23,36 | ||||
| 2025-07-11 | 13F | Farther Finance Advisors, LLC | 228 | 111,11 | 5 | 150,00 | ||||
| 2025-07-17 | 13F | Wolff Wiese Magana Llc | 127 | 0,00 | 3 | 0,00 | ||||
| 2025-08-08 | 13F | Larson Financial Group LLC | 4.348 | -12,13 | 101 | -2,88 | ||||
| 2025-08-14 | 13F | Sei Investments Co | 9.230 | 215 | ||||||
| 2025-04-18 | 13F | Wolf Group Capital Advisors | 19.506 | -17,08 | 412 | -32,68 | ||||
| 2025-05-14 | 13F | Caitlin John, LLC | 0 | -100,00 | 0 | |||||
| 2025-08-14 | 13F | Raymond James Financial Inc | 54.028 | -17,28 | 1.259 | -8,84 | ||||
| 2025-07-21 | 13F | Future Financial Wealth Managment LLC | 20 | 0,00 | 0 | |||||
| 2025-08-11 | 13F | Aptus Capital Advisors, LLC | 216 | 0,00 | 5 | 25,00 | ||||
| 2025-08-08 | 13F | Capital Investment Advisory Services, LLC | 354 | 0,00 | 8 | 14,29 | ||||
| 2025-08-14 | 13F | Hancock Prospecting Pty Ltd | 161.901 | 0,00 | 3.772 | 10,23 | ||||
| 2025-08-14 | 13F | Comerica Bank | 2.388 | 0,00 | 56 | 10,00 | ||||
| 2025-08-04 | 13F | Creative Financial Designs Inc /adv | 5.845 | -23,83 | 136 | -16,05 | ||||
| 2025-07-28 | 13F | Harbour Investments, Inc. | 1.746 | -36,74 | 41 | -31,03 | ||||
| 2025-08-12 | 13F | CIBC Private Wealth Group, LLC | 229 | 0,00 | 5 | 25,00 | ||||
| 2025-08-12 | 13F | Steward Partners Investment Advisory, Llc | 412 | 4,30 | 10 | 12,50 | ||||
| 2025-07-17 | 13F | Archford Capital Strategies, LLC | 0 | -100,00 | 0 | |||||
| 2025-04-21 | 13F | Friedenthal Financial | 0 | -100,00 | 0 | |||||
| 2025-08-13 | 13F | Financial Freedom, LLC | 20.019 | -25,60 | 466 | -17,96 | ||||
| 2025-05-28 | 13F | Intrua Financial, LLC | 0 | -100,00 | 0 | -100,00 | ||||
| 2025-05-09 | 13F | Pathway Financial Advisers, LLC | 0 | -100,00 | 0 | |||||
| 2025-05-15 | 13F | Glenmede Trust Co Na | 610 | 0,00 | 13 | -14,29 | ||||
| 2025-07-01 | 13F | Harbor Investment Advisory, Llc | 0 | -100,00 | 0 | |||||
| 2025-07-31 | 13F | Moment Partners, LLC | 13.775 | -3,64 | 321 | 5,96 | ||||
| 2025-08-29 | 13F | Total Investment Management Inc | 686 | 16 | ||||||
| 2025-08-14 | 13F | Destination Wealth Management | 23.909 | -3,30 | 557 | 6,70 | ||||
| 2025-08-14 | 13F | Fmr Llc | 1.209 | -30,84 | 28 | -22,22 | ||||
| 2025-05-02 | 13F | Whittier Trust Co | 0 | -100,00 | 0 | |||||
| 2025-07-24 | 13F | JNBA Financial Advisors | 0 | -100,00 | 0 | |||||
| 2025-07-28 | 13F | Duncker Streett & Co Inc | 101 | 2 | ||||||
| 2025-08-05 | 13F | Cherry Tree Wealth Management, LLC | 1.685 | 0,00 | 39 | 11,43 | ||||
| 2025-08-04 | 13F | Spire Wealth Management | 300 | 50,00 | 7 | 50,00 | ||||
| 2025-07-29 | 13F | Tradewinds Capital Management, LLC | 21 | 0,00 | 0 | |||||
| 2025-05-13 | 13F | EverSource Wealth Advisors, LLC | 0 | -100,00 | 0 | |||||
| 2025-07-17 | 13F | Jackson, Grant Investment Advisers, Inc. | 295 | 0,00 | 7 | 0,00 | ||||
| 2025-08-01 | 13F | Bessemer Group Inc | 1.350 | 1.250,00 | 0 | |||||
| 2025-05-15 | 13F | Tower Research Capital LLC (TRC) | 0 | -100,00 | 0 | |||||
| 2025-05-09 | 13F | GeoWealth Management, LLC | 0 | -100,00 | 0 | |||||
| 2025-08-05 | 13F | NewSquare Capital LLC | 37 | 1 | ||||||
| 2025-08-15 | 13F | Morgan Stanley | 19.195 | -37,47 | 447 | -31,02 | ||||
| 2025-08-18 | 13F | N.E.W. Advisory Services LLC | 271 | 0,00 | 6 | 20,00 | ||||
| 2025-04-25 | 13F | Red Tortoise LLC | 0 | -100,00 | 0 | |||||
| 2025-07-21 | 13F | Mirae Asset Global Investments Co., Ltd. | 7.000 | 0,00 | 163 | 9,40 | ||||
| 2025-08-14 | 13F | Dagco, Inc. | 848 | 0,00 | 20 | 11,76 | ||||
| 2025-07-25 | 13F | NorthRock Partners, LLC | 88 | 0,00 | 2 | 100,00 | ||||
| 2025-07-16 | 13F | PFS Partners, LLC | 97 | 0,00 | 2 | 0,00 | ||||
| 2025-07-17 | 13F | Beacon Capital Management, LLC | 0 | -100,00 | 0 | |||||
| 2025-08-14 | 13F | Susquehanna International Group, Llp | 35.560 | -13,67 | 829 | -4,83 | ||||
| 2025-04-10 | 13F | Grassi Investment Management | 0 | -100,00 | 0 | |||||
| 2025-08-13 | 13F | Capital Analysts, Inc. | 1.570 | 0,00 | 0 | |||||
| 2025-08-08 | 13F | Emerald Investment Partners, Llc | 686 | 16 | ||||||
| 2025-05-14 | 13F | WCG Wealth Advisors LLC | 0 | -100,00 | 0 | |||||
| 2025-08-12 | 13F | Cook Wealth Management Group Llc | 0 | -100,00 | 0 | |||||
| 2025-08-14 | 13F | GWM Advisors LLC | 2.420 | 4,54 | 56 | 16,67 | ||||
| 2025-08-14 | 13F | Federation des caisses Desjardins du Quebec | 4.422 | -2,96 | 103 | 7,29 | ||||
| 2025-07-28 | 13F | BRYN MAWR TRUST Co | 360 | 0,00 | 8 | 14,29 | ||||
| 2025-08-05 | 13F | Westside Investment Management, Inc. | 200 | 0,00 | 5 | 0,00 | ||||
| 2025-08-14 | 13F | Wells Fargo & Company/mn | 19.427 | -10,13 | 453 | -0,88 | ||||
| 2025-06-10 | 13F | Birchbrook, Inc. | 0 | -100,00 | 0 | -100,00 | ||||
| 2025-08-05 | 13F | Fourth Dimension Wealth, LLC | 100 | 0,00 | 2 | 0,00 | ||||
| 2025-08-13 | 13F | Jones Financial Companies Lllp | 5.439 | 24,92 | 127 | 35,48 | ||||
| 2025-08-14 | 13F | Group One Trading, L.p. | 100 | 0,00 | 2 | 0,00 | ||||
| 2025-05-02 | 13F | Capital A Wealth Management, LLC | 0 | -100,00 | 0 | |||||
| 2025-08-11 | 13F | Elite Financial, Inc. | 0 | -100,00 | 0 | |||||
| 2025-08-14 | 13F | Royal Bank Of Canada | 35.717 | -11,48 | 832 | -2,58 |
Other Listings
| MX:DRIV |