Grundlæggende statistik
| Institutionelle ejere | 108 total, 108 long only, 0 short only, 0 long/short - change of 0,00% MRQ |
| Gennemsnitlig porteføljeallokering | 0.1265 % - change of 5,54% MRQ |
| Institutionelle aktier (lange) | 7.513.944 (ex 13D/G) - change of -0,14MM shares -1,81% MRQ |
| Institutionel værdi (lang) | $ 492.952 USD ($1000) |
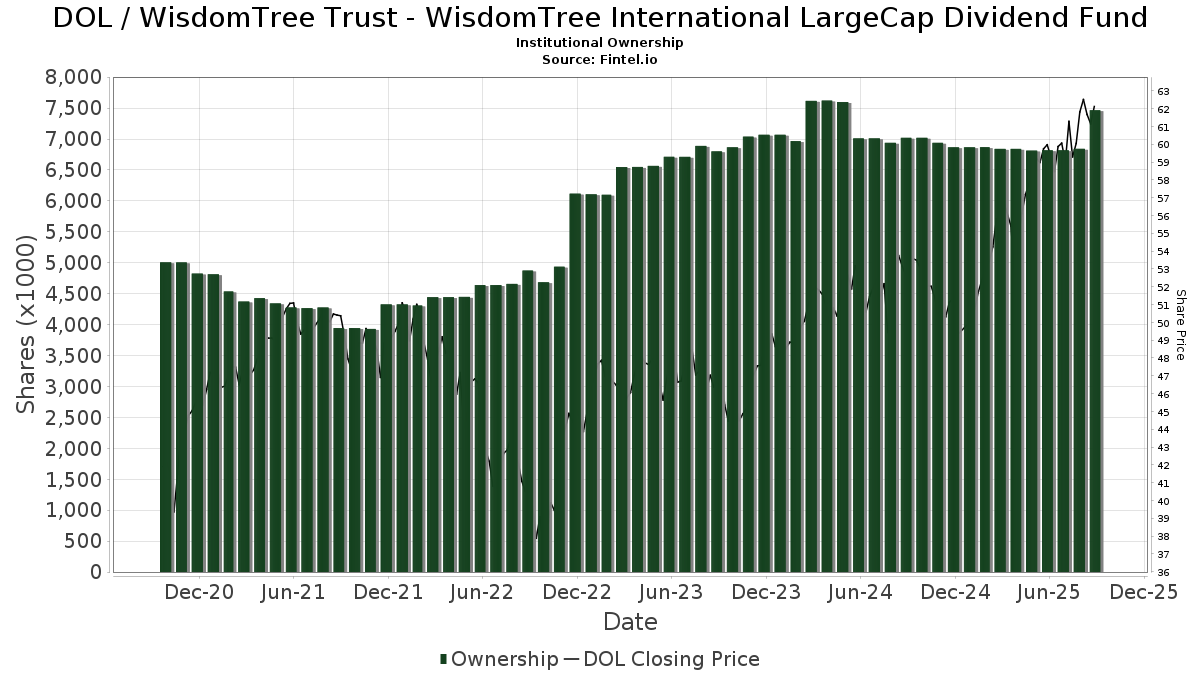
Institutionelt ejerskab og aktionærer
WisdomTree Trust - WisdomTree True Developed International Fund (US:DOL) har 108 institutionelle ejere og aktionærer, der har indsendt 13D/G- eller 13F-formularer til Securities Exchange Commission (SEC). Disse institutioner har i alt 7,513,944 aktier. Største aktionærer omfatter Creative Planning, Morgan Stanley, Jpmorgan Chase & Co, Royal Bank Of Canada, Key FInancial Inc, BIP Wealth, LLC, Cascade Financial Partners, LLC, LPL Financial LLC, Bank Of America Corp /de/, and M&t Bank Corp .
WisdomTree Trust - WisdomTree True Developed International Fund (ARCA:DOL) institutionel ejerskabsstruktur viser aktuelle positioner i virksomheden efter institutioner og fonde, samt seneste ændringer i positionsstørrelse. Større aktionærer kan omfatte individuelle investorer, investeringsforeninger, hedgefonde eller institutioner. Skema 13D angiver, at investoren besidder (eller besidder) mere end 5 % af virksomheden og har til hensigt (eller har til hensigt at) aktivt at forfølge en ændring i forretningsstrategi. Skema 13G indikerer en passiv investering på over 5%.
The share price as of April 17, 2026 is 72,75 / share. Previously, on April 21, 2025, the share price was 54,88 / share. This represents an increase of 32,56% over that period.
Fondens stemningsscore
Fund Sentiment Score (fka Ownership Accumulation Score) finder de aktier, der bliver mest købt af fonde. Det er resultatet af en sofistikeret, multi-faktor kvantitativ model, der identificerer virksomheder med de højeste niveauer af institutionel akkumulering. Scoringsmodellen bruger en kombination af den samlede stigning i oplyste ejere, ændringerne i porteføljeallokeringer i disse ejere og andre målinger. Tallet går fra 0 til 100, hvor højere tal indikerer et højere niveau af akkumulering for sine jævnaldrende, og 50 er gennemsnittet.
Opdateringsfrekvens: Dagligt
Se Ownership Explorer, som giver en liste over højest rangerende virksomheder.
AI+ Ask Fintel’s AI assistant about WisdomTree Trust - WisdomTree True Developed International Fund.
Select a question to share a public post with an AI-crafted answer.
Thinking of good questions…
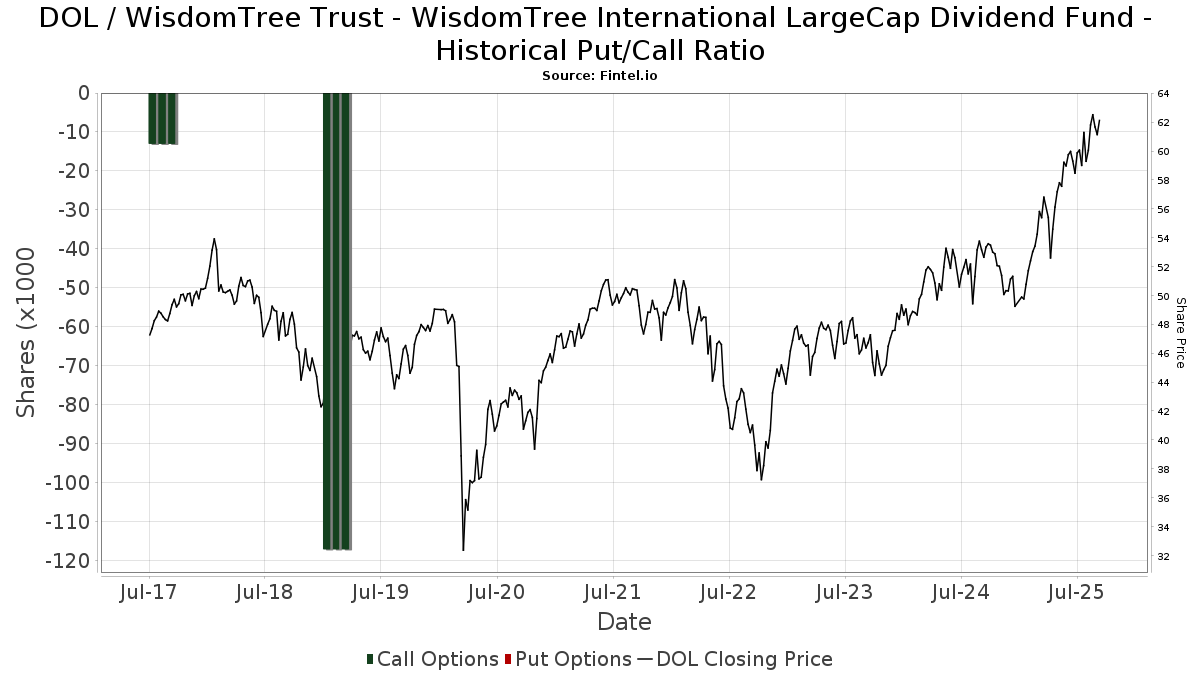
Institutionel Put/Call-forhold
Ud over at indberette standardaktie- og gældsudstedelser skal institutter med mere end 100 mill. aktiver under forvaltning også oplyse deres put- og call-optionsbeholdninger. Da salgsoptioner generelt indikerer negativ stemning, og købsoptioner indikerer positiv stemning, kan vi få en fornemmelse af den overordnede institutionelle stemning ved at plotte forholdet mellem put og kald. Diagrammet til højre viser det historiske put/call-forhold for dette instrument.
Brug af Put/Call Ratio som en indikator for investorernes stemning overvinder en af de vigtigste mangler ved at bruge totalt institutionelt ejerskab, som er, at en betydelig mængde af aktiver under forvaltning investeres passivt for at spore indekser. Passivt forvaltede fonde køber typisk ikke optioner, så indikatoren for put/call-forholdet følger mere nøje følelsen af aktivt forvaltede fonde.
13F og NPORT arkivering
Detaljer om 13F-arkivering er gratis. Detaljer om NP-ansøgninger kræver et premium-medlemskab. Grønne rækker angiver nye positioner. Røde rækker angiver lukkede positioner. Klik på linket ikon for at se den fulde transaktionshistorik.
Opgrader
for at låse premium-data op og eksportere til Excel ![]() .
.
| Fil dato | Kilde | Investor | Type | Gennemsnitlig pris (Øst) |
Aktier | Δ Aktier (%) |
Rapporteret Værdi ($1000) |
Δ Værdi (%) |
Port Alloc (%) |
|
|---|---|---|---|---|---|---|---|---|---|---|
| 2026-04-07 | 13F | Farther Finance Advisors, LLC | 3.981 | 96,11 | 275 | 106,02 | ||||
| 2026-04-07 | 13F | CoreCap Advisors, LLC | 10.471 | -0,07 | 712 | 3,19 | ||||
| 2026-01-27 | 13F | Institute for Wealth Management, LLC. | 11.107 | -2,37 | 731 | 3,25 | ||||
| 2026-04-08 | 13F | First Heartland Consultants, Inc. | 45.544 | -38,15 | 3.096 | -36,14 | ||||
| 2026-02-13 | 13F | Mariner, LLC | 34.701 | -3,83 | 2.285 | 1,74 | ||||
| 2026-02-13 | 13F | Kestra Advisory Services, LLC | 0 | -100,00 | 0 | |||||
| 2026-02-09 | 13F | Hartland & Co., LLC | 4.243 | 0,00 | 279 | 5,68 | ||||
| 2026-02-17 | 13F | Wealth Watch Advisors, INC | 408 | -1,45 | 27 | 4,00 | ||||
| 2026-02-17 | 13F | Fmr Llc | 2.205 | 0,55 | 145 | 6,62 | ||||
| 2026-02-17 | 13F | Creative Planning | 2.663.726 | -0,72 | 175.406 | 5,01 | ||||
| 2026-02-17 | 13F | Ancora Advisors, LLC | 720 | 0,00 | 47 | 6,82 | ||||
| 2026-01-06 | 13F | Sanctuary Advisors, LLC | 3.378 | 0,00 | 201 | 0,00 | ||||
| 2026-02-13 | 13F | Evernest Financial Advisors, LLC | 92.925 | -0,37 | 6.721 | 15,76 | ||||
| 2026-02-17 | 13F | Northern Trust Corp | 0 | -100,00 | 0 | |||||
| 2026-01-26 | 13F | Cwm, Llc | 30.045 | 0,93 | 2 | 0,00 | ||||
| 2026-02-17 | 13F | Private Advisor Group, LLC | 14.451 | -11,33 | 952 | -6,21 | ||||
| 2026-02-06 | 13F | HighTower Advisors, LLC | 8.093 | -3,16 | 533 | 2,31 | ||||
| 2025-10-27 | 13F | PBMares Wealth Management LLC | 6.301 | 0,29 | 392 | 4,81 | ||||
| 2026-02-11 | 13F | Jpmorgan Chase & Co | 371.573 | 0,81 | 24.468 | 6,63 | ||||
| 2026-04-13 | 13F | Creative Financial Designs Inc /adv | 310 | 0,00 | 21 | 5,00 | ||||
| 2026-01-20 | 13F | SOA Wealth Advisors, LLC. | 1.872 | 0,59 | 123 | 6,96 | ||||
| 2026-01-26 | 13F | JNBA Financial Advisors | 4.806 | 0,00 | 316 | 5,69 | ||||
| 2026-02-11 | 13F | O'shaughnessy Asset Management, Llc | 767 | 51 | ||||||
| 2026-02-12 | 13F | Quadrant Capital Group Llc | 950 | 0,00 | 63 | 5,08 | ||||
| 2026-02-02 | 13F | Altrius Capital Management Inc | 6.279 | -0,29 | 413 | 5,36 | ||||
| 2026-02-17 | 13F | Herold Advisors, Inc. | 8.842 | 111,48 | 582 | 123,85 | ||||
| 2026-02-09 | 13F | Huntington National Bank | 55.633 | 7,45 | ||||||
| 2026-02-12 | 13F | Principal Securities, Inc. | 0 | -100,00 | 0 | -100,00 | ||||
| 2026-02-02 | 13F | Avidian Wealth Solutions, LLC | 121.793 | 0,61 | 8.020 | 6,42 | ||||
| 2026-02-06 | 13F | Pnc Financial Services Group, Inc. | 632 | -8,41 | 42 | -2,38 | ||||
| 2026-02-13 | 13F | National Bank Of Canada /fi/ | 3.039 | 200 | ||||||
| 2026-02-17 | 13F | Gladstone Institutional Advisory LLC | 44.050 | 3,77 | 2.901 | 9,77 | ||||
| 2026-02-13 | 13F | Advyzon Investment Management, LLC | 4.675 | 3,54 | 308 | 9,25 | ||||
| 2026-04-20 | 13F | Courier Capital Llc | 0 | -100,00 | 0 | |||||
| 2026-02-17 | 13F | Raymond James Financial Inc | 42.888 | 52,46 | 2.824 | 61,28 | ||||
| 2026-04-17 | 13F | Discipline Wealth Solutions, LLC | 5.246 | 0,00 | 357 | 3,19 | ||||
| 2026-02-17 | 13F | Royal Bank Of Canada | 330.364 | -0,27 | 21.755 | 5,50 | ||||
| 2026-04-08 | 13F | Evanson Asset Management, LLC | 11.637 | 0,09 | 791 | 3,40 | ||||
| 2026-01-20 | 13F | Stratos Wealth Partners, LTD. | 5.664 | 5,53 | 373 | 11,68 | ||||
| 2026-02-05 | 13F | Atria Investments Llc | 43.694 | -28,69 | 2.877 | -24,57 | ||||
| 2026-02-11 | 13F | MCF Advisors LLC | 5.885 | 0,00 | 388 | 5,74 | ||||
| 2026-02-05 | 13F | Western Wealth Management, LLC | 20.710 | 46,92 | 1.364 | 55,42 | ||||
| 2026-01-29 | 13F | Comerica Bank | 7.839 | -6,91 | 516 | -1,53 | ||||
| 2026-02-09 | 13F | Harbour Investments, Inc. | 166 | 0,00 | 11 | 0,00 | ||||
| 2026-02-17 | 13F | Jones Financial Companies Lllp | 8.537 | 10,43 | 562 | 17,82 | ||||
| 2026-02-18 | 13F | GWM Advisors LLC | 5.732 | 1.274,58 | 377 | 1.408,00 | ||||
| 2026-04-07 | 13F | Signaturefd, Llc | 425 | 0,00 | 29 | 3,70 | ||||
| 2026-02-06 | 13F | Cascade Financial Partners, LLC | 242.761 | 8,51 | 15.986 | 14,78 | ||||
| 2026-01-29 | 13F | UBS Group AG | 69.600 | 14,42 | 4.583 | 21,05 | ||||
| 2026-02-17 | 13F | Bank Of America Corp /de/ | 199.214 | -2,24 | 13.118 | 3,41 | ||||
| 2026-01-16 | 13F | Ronald Blue Trust, Inc. | 1.377 | 0,00 | 91 | 5,88 | ||||
| 2026-04-02 | 13F | Noble Wealth Management PBC | 225 | 0,00 | 15 | 7,14 | ||||
| 2026-04-15 | 13F | Fifth Third Securities, Inc. | 3.391 | 8,83 | 231 | 12,20 | ||||
| 2026-02-06 | 13F | Global Retirement Partners, LLC | 305 | 0,33 | 20 | 11,11 | ||||
| 2026-01-20 | 13F | Hubbell Strickland Wealth Management, LLC | 4.041 | 0,60 | 266 | 6,40 | ||||
| 2026-01-22 | 13F | Powers Advisory Group, LLC | 84.288 | 0,36 | 5.550 | 6,16 | ||||
| 2026-01-30 | 13F/A | M&t Bank Corp | 129.015 | -18,85 | 8.496 | -14,17 | ||||
| 2026-04-13 | 13F | IFP Advisors, Inc | 1.585 | -30,24 | 108 | -28,19 | ||||
| 2026-02-10 | 13F | Bank of New York Mellon Corp | 0 | -100,00 | 0 | |||||
| 2026-02-17 | 13F | Advisor Group Holdings, Inc. | 82.941 | -5,26 | 5.462 | 0,61 | ||||
| 2026-01-28 | 13F | Chicago Partners Investment Group LLC | 3.758 | 0,03 | 259 | 8,40 | ||||
| 2026-02-13 | 13F | Citigroup Inc | 0 | -100,00 | 0 | |||||
| 2026-02-12 | 13F | Steward Partners Investment Advisory, Llc | 2 | 0,00 | 0 | |||||
| 2026-02-05 | 13F | Cambridge Investment Research Advisors, Inc. | 6.746 | 6,29 | 0 | |||||
| 2026-02-14 | 13F | Howe & Rusling Inc | 15.229 | 0,84 | 1.003 | 6,60 | ||||
| 2026-02-17 | 13F | Ameriprise Financial Inc | 21.182 | 179,15 | 1.395 | 195,34 | ||||
| 2026-02-12 | 13F | Commonwealth Equity Services, Llc | 119.884 | -0,11 | 7.894 | 112.671,43 | ||||
| 2026-02-19 | 13F | CI Private Wealth, LLC | 11.627 | 766 | ||||||
| 2026-02-09 | 13F | Key FInancial Inc | 320.216 | -0,48 | 21.086 | 4,37 | ||||
| 2025-11-14 | 13F/A | NorthRock Partners, LLC | 0 | -100,00 | 0 | |||||
| 2026-02-13 | 13F | Wells Fargo & Company/mn | 57.483 | 5,08 | 3.785 | 11,16 | ||||
| 2026-02-11 | 13F | Cerity Partners LLC | 4.646 | 0,39 | 306 | 5,90 | ||||
| 2026-02-12 | 13F | Founders Financial Alliance, LLC | 265 | 0,00 | 17 | 6,25 | ||||
| 2026-04-08 | 13F | Stonebridge Financial Group, LLC | 9.325 | 0,00 | 634 | 3,09 | ||||
| 2026-02-13 | 13F | Morgan Stanley | 1.024.259 | 3,46 | 67.447 | 9,43 | ||||
| 2026-02-04 | 13F | Ameritas Advisory Services, LLC | 0 | -100,00 | 0 | |||||
| 2026-02-10 | 13F | Goldman Sachs Group Inc | 0 | -100,00 | 0 | |||||
| 2026-02-10 | 13F/A | Northwestern Mutual Wealth Management Co | 64.835 | -46,60 | 4.269 | -43,52 | ||||
| 2026-02-10 | 13F | Palatine Hill Wealth Management, LLC | 8.001 | 527 | ||||||
| 2026-02-12 | 13F | Jane Street Group, Llc | 31.948 | -36,65 | 2.104 | -33,00 | ||||
| 2026-01-23 | 13F | Newton One Investments LLC | 1.853 | 0,00 | 122 | 6,09 | ||||
| 2025-11-12 | 13F | Buckingham Strategic Partners | 0 | -100,00 | 0 | |||||
| 2026-02-17 | 13F | Blair William & Co/il | 179 | 0,00 | 12 | 0,00 | ||||
| 2026-01-21 | 13F | BIP Wealth, LLC | 310.989 | 0,80 | 20.479 | 6,62 | ||||
| 2026-02-05 | 13F | Allworth Financial LP | 400 | 26 | ||||||
| 2026-02-09 | 13F | Strategic Financial Concepts, LLC | 12.106 | 797 | ||||||
| 2026-02-10 | 13F | IFG Advisory, LLC | 6.978 | 460 | ||||||
| 2026-04-17 | 13F | United Advisor Group, LLC | 3.232 | 220 | ||||||
| 2026-04-08 | 13F | Wealth Enhancement Advisory Services, Llc | 6.064 | -45,67 | 416 | -44,61 | ||||
| 2026-02-17 | 13F | Warren Averett Asset Management, LLC | 30.121 | -3,39 | 1.983 | 2,22 | ||||
| 2026-02-02 | 13F | Fifth Third Bancorp | 3.407 | 0,00 | 224 | 5,66 | ||||
| 2026-02-04 | 13F | Tsfg, Llc | 88 | 0,00 | 0 | |||||
| 2026-02-13 | 13F | Stifel Financial Corp | 8.476 | -1,12 | 558 | 4,69 | ||||
| 2026-01-23 | 13F | Assetmark, Inc | 1.600 | 0,00 | 105 | 6,06 | ||||
| 2026-01-14 | 13F | Jfs Wealth Advisors, Llc | 25.411 | 12,20 | 1.673 | 18,74 | ||||
| 2026-02-17 | 13F | Cetera Investment Advisers | 86.678 | -12,87 | 5.708 | -7,83 | ||||
| 2026-01-28 | 13F | Geneos Wealth Management Inc. | 7.839 | 4,01 | 516 | 10,02 | ||||
| 2026-02-04 | 13F | LRI Investments, LLC | 2.085 | 0,00 | 137 | 6,20 | ||||
| 2026-02-17 | 13F | Cardiff Park Advisors, Llc | 2.420 | 0,58 | 159 | 6,71 | ||||
| 2025-11-17 | 13F | FSA Wealth Management LLC | 400 | 0,00 | 25 | 4,35 | ||||
| 2026-02-10 | 13F | Cherry Tree Wealth Management, LLC | 714 | 0,00 | 47 | 6,82 | ||||
| 2026-02-11 | 13F | LPL Financial LLC | 237.124 | 8,56 | 15.615 | 14,83 | ||||
| 2026-02-13 | 13F | Golden State Wealth Management, LLC | 0 | -100,00 | 0 | |||||
| 2026-02-12 | 13F | TopTier Wealth Management, LLC | 7.687 | 506 | ||||||
| 2026-02-10 | 13F | Envestnet Asset Management Inc | 29.403 | 1,07 | 1.936 | 6,90 | ||||
| 2025-11-12 | 13F | Creekmur Asset Management LLC | 684 | -25,00 | 43 | -22,22 | ||||
| 2026-02-14 | 13F | Rockefeller Capital Management L.P. | 46.696 | 6,84 | 3.075 | 13,01 | ||||
| 2026-04-15 | 13F | Meridian Financial Partners LLC | 7.745 | 0,00 | 536 | 1,71 | ||||
| 2026-01-20 | 13F | Relyea Zuckerberg Hanson LLC | 3.103 | 204 | ||||||
| 2026-02-13 | 13F | Level Four Advisory Services, Llc | 4.488 | 0,00 | 296 | 5,73 | ||||
| 2026-04-20 | 13F | Apella Capital, LLC | 5.203 | 379 | ||||||
| 2026-02-17 | 13F/A | Vance Wealth, Inc. | 6.150 | 0,00 | 405 | 5,76 | ||||
| 2026-04-17 | 13F | AdvisorNet Financial, Inc | 78 | 0,00 | 5 | 0,00 | ||||
| 2026-02-13 | 13F | Colony Group, LLC | 10.156 | 21,28 | 669 | 28,21 | ||||
| 2026-02-12 | 13F | BlackRock, Inc. | 7.371 | 485 | ||||||
| 2026-02-10 | 13F | Bridges Investment Management Inc | 0 | -100,00 | 0 | |||||
| 2026-02-13 | 13F | Aptus Capital Advisors, LLC | 8.000 | 527 | ||||||
| 2025-11-14 | 13F | Flow Traders U.s. Llc | 0 | -100,00 | 0 | |||||
| 2026-02-11 | 13F | Janney Montgomery Scott LLC | 3.306 | 0,09 | 0 | |||||
| 2026-02-17 | 13F | Citadel Advisors Llc | 37.403 | 2.463 | ||||||
| 2026-02-13 | 13F | Mml Investors Services, Llc | 75.254 | 7,12 | 4.956 | 13,31 | ||||
| 2026-02-09 | 13F | Frazier Financial Advisors, LLC | 4.230 | 0,00 | 279 | 5,70 | ||||
| 2026-02-13 | 13F | Integrated Wealth Concepts LLC | 0 | -100,00 | 0 |