Grundlæggende statistik
| Institutionelle ejere | 141 total, 141 long only, 0 short only, 0 long/short - change of 0,00% MRQ |
| Gennemsnitlig porteføljeallokering | 0.1287 % - change of -41,12% MRQ |
| Institutionelle aktier (lange) | 3.394.289 (ex 13D/G) - change of -0,69MM shares -16,95% MRQ |
| Institutionel værdi (lang) | $ 142.843 USD ($1000) |
Institutionelt ejerskab og aktionærer
First Trust Exchange-Traded Fund VIII - FT Vest U.S. Equity Deep Buffer ETF - February (US:DFEB) har 141 institutionelle ejere og aktionærer, der har indsendt 13D/G- eller 13F-formularer til Securities Exchange Commission (SEC). Disse institutioner har i alt 3,394,289 aktier. Største aktionærer omfatter Commonwealth Equity Services, Llc, Cetera Investment Advisers, Advisor Group Holdings, Inc., Spectrum Asset Management, Inc. (NB/CA), Envestnet Asset Management Inc, Cwm, Llc, Holistic Planning, LLC, Raymond James Financial Inc, Cambridge Investment Research Advisors, Inc., and Precedent Wealth Partners, Llc .
First Trust Exchange-Traded Fund VIII - FT Vest U.S. Equity Deep Buffer ETF - February (BATS:DFEB) institutionel ejerskabsstruktur viser aktuelle positioner i virksomheden efter institutioner og fonde, samt seneste ændringer i positionsstørrelse. Større aktionærer kan omfatte individuelle investorer, investeringsforeninger, hedgefonde eller institutioner. Skema 13D angiver, at investoren besidder (eller besidder) mere end 5 % af virksomheden og har til hensigt (eller har til hensigt at) aktivt at forfølge en ændring i forretningsstrategi. Skema 13G indikerer en passiv investering på over 5%.
The share price as of March 27, 2026 is 46,74 / share. Previously, on March 31, 2025, the share price was 42,15 / share. This represents an increase of 10,88% over that period.

Fondens stemningsscore
Fund Sentiment Score (fka Ownership Accumulation Score) finder de aktier, der bliver mest købt af fonde. Det er resultatet af en sofistikeret, multi-faktor kvantitativ model, der identificerer virksomheder med de højeste niveauer af institutionel akkumulering. Scoringsmodellen bruger en kombination af den samlede stigning i oplyste ejere, ændringerne i porteføljeallokeringer i disse ejere og andre målinger. Tallet går fra 0 til 100, hvor højere tal indikerer et højere niveau af akkumulering for sine jævnaldrende, og 50 er gennemsnittet.
Opdateringsfrekvens: Dagligt
Se Ownership Explorer, som giver en liste over højest rangerende virksomheder.
AI+ Ask Fintel’s AI assistant about First Trust Exchange-Traded Fund VIII - FT Vest U.S. Equity Deep Buffer ETF - February.
Select a question to share a public post with an AI-crafted answer.
Thinking of good questions…
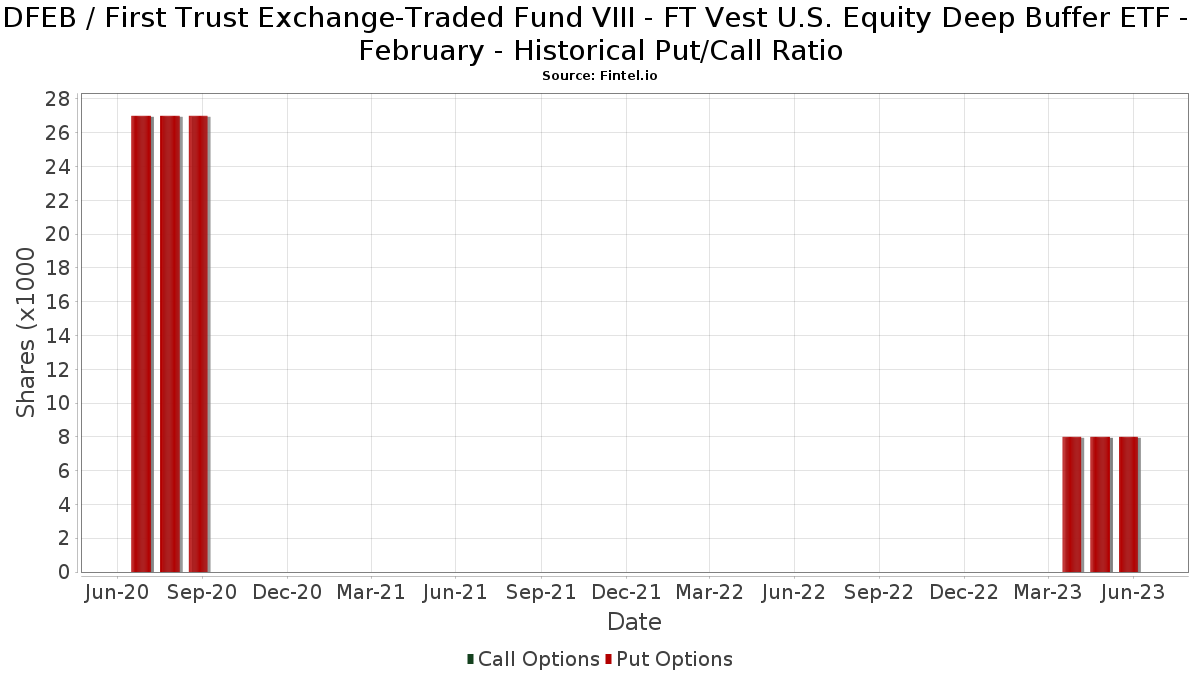
Institutionel Put/Call-forhold
Ud over at indberette standardaktie- og gældsudstedelser skal institutter med mere end 100 mill. aktiver under forvaltning også oplyse deres put- og call-optionsbeholdninger. Da salgsoptioner generelt indikerer negativ stemning, og købsoptioner indikerer positiv stemning, kan vi få en fornemmelse af den overordnede institutionelle stemning ved at plotte forholdet mellem put og kald. Diagrammet til højre viser det historiske put/call-forhold for dette instrument.
Brug af Put/Call Ratio som en indikator for investorernes stemning overvinder en af de vigtigste mangler ved at bruge totalt institutionelt ejerskab, som er, at en betydelig mængde af aktiver under forvaltning investeres passivt for at spore indekser. Passivt forvaltede fonde køber typisk ikke optioner, så indikatoren for put/call-forholdet følger mere nøje følelsen af aktivt forvaltede fonde.
13D/G-arkivering
Vi præsenterer 13D/G ansøgninger separat fra 13F ansøgninger på grund af den forskellige behandling af SEC. 13D/G-ansøgninger kan indgives af grupper af investorer (med én ledende), hvorimod 13F-ansøgninger ikke kan. Dette resulterer i situationer, hvor en investor kan indsende en 13D/G, der rapporterer én værdi for de samlede aktier (der repræsenterer alle de aktier, der ejes af investorgruppen), men derefter indsender en 13F, der rapporterer en anden værdi for de samlede aktier (der udelukkende repræsenterer deres egne) ejendomsret). Det betyder, at aktieejerskab af 13D/G-arkiver og 13F-arkiveringer ofte ikke er direkte sammenlignelige, så vi præsenterer dem separat.
Bemærk: Fra den 16. maj 2021 viser vi ikke længere ejere, der ikke har indsendt en 13D/G inden for det seneste år. Tidligere viste vi den fulde historie af 13D/G-arkiver. Generelt skal enheder, der er forpligtet til at indgive 13D/G-ansøgninger, indgive mindst årligt, før de indsender en afsluttende ansøgning. Dog forlader fonde nogle gange positioner uden at indsende en afsluttende ansøgning (dvs. de afvikler), så visning af den fulde historie resulterede nogle gange i forvirring om det nuværende ejerskab. For at undgå forvirring viser vi nu kun 'aktuelle' ejere - det vil sige - ejere, der har anmeldt inden for det seneste år.
Upgrade to unlock premium data.
| Fil dato | Form | Investor | Forrige Aktier |
Seneste Aktier |
Δ Aktier (Procent) |
Ejendomsret (Procent) |
Δ Ejerskab (Procent) |
|
|---|---|---|---|---|---|---|---|---|
| 2026-01-20 | FIRST TRUST PORTFOLIOS LP | 2,667,699 | 2,860,369 | 7.22 | 35.10 | 13.81 |
13F og NPORT arkivering
Detaljer om 13F-arkivering er gratis. Detaljer om NP-ansøgninger kræver et premium-medlemskab. Grønne rækker angiver nye positioner. Røde rækker angiver lukkede positioner. Klik på linket ikon for at se den fulde transaktionshistorik.
Opgrader
for at låse premium-data op og eksportere til Excel ![]() .
.
| Fil dato | Kilde | Investor | Type | Gennemsnitlig pris (Øst) |
Aktier | Δ Aktier (%) |
Rapporteret Værdi ($1000) |
Δ Værdi (%) |
Port Alloc (%) |
|
|---|---|---|---|---|---|---|---|---|---|---|
| 2026-02-13 | 13F | Journey Strategic Wealth Llc | 11.751 | -0,34 | 561 | 2,19 | ||||
| 2026-02-10 | 13F | Envestnet Asset Management Inc | 139.228 | -11,42 | 6.644 | -9,16 | ||||
| 2026-01-26 | 13F | Cwm, Llc | 127.878 | -26,59 | 6 | -25,00 | ||||
| 2026-02-17 | 13F | Aqr Capital Management Llc | 9.822 | -10,71 | 469 | -8,41 | ||||
| 2026-02-06 | 13F | McKinley Carter Wealth Services, Inc. | 8.047 | 0,00 | 384 | 2,67 | ||||
| 2026-01-20 | 13F | SOA Wealth Advisors, LLC. | 2.552 | -21,93 | 122 | -20,39 | ||||
| 2026-01-29 | 13F | Camelot Portfolios, LLC | 40.820 | -21,33 | 1.948 | -19,35 | ||||
| 2026-02-17 | 13F | Royal Bank Of Canada | 925 | -50,00 | 44 | -49,43 | ||||
| 2026-01-23 | 13F | Clear Creek Financial Management, LLC | 14.477 | 0,00 | 691 | 2,53 | ||||
| 2025-10-10 | 13F | Signal Advisors Wealth, LLC | 0 | -100,00 | 0 | |||||
| 2026-01-12 | 13F | Optivise Advisory Services LLC | 6.849 | -0,03 | 327 | 2,52 | ||||
| 2026-02-13 | 13F | Smartleaf Asset Management LLC | 146 | 7 | ||||||
| 2026-02-13 | 13F | Barclays Plc | 4.195 | -2,71 | 200 | 0,00 | ||||
| 2026-02-05 | 13F | Cambridge Investment Research Advisors, Inc. | 90.135 | -3,98 | 4 | 0,00 | ||||
| 2025-10-17 | 13F | FSC Wealth Advisors, LLC | 0 | -100,00 | 0 | -100,00 | ||||
| 2026-01-26 | 13F | Spectrum Asset Management, Inc. (NB/CA) | 139.441 | -1,87 | 6.654 | 0,64 | ||||
| 2026-02-04 | 13F | Topsail Wealth Management, LLC | 168 | 0,00 | 8 | 14,29 | ||||
| 2026-01-29 | 13F | Kestra Private Wealth Services, Llc | 19.495 | -35,49 | 930 | -33,85 | ||||
| 2026-01-29 | 13F | Nbc Securities, Inc. | 5.490 | -3,60 | 262 | -1,51 | ||||
| 2026-02-02 | 13F | MN Wealth Advisors, LLC | 5.077 | 0,00 | 242 | 2,54 | ||||
| 2026-02-10 | 13F | REAP Financial Group, LLC | 58.972 | -2,46 | 2.814 | 0,04 | ||||
| 2026-01-08 | 13F | Wealth Enhancement Advisory Services, Llc | 24.100 | -5,13 | 1.155 | -2,37 | ||||
| 2026-01-26 | 13F | Keystone Wealth Services, LLC | 0 | -100,00 | 0 | |||||
| 2026-02-03 | 13F | International Assets Investment Management, Llc | 16.036 | 0,00 | 765 | 7,14 | ||||
| 2025-11-14 | 13F | Brown Advisory Inc | 0 | -100,00 | 0 | |||||
| 2026-02-17 | 13F | United Capital Financial Advisers, Llc | 6.500 | 0,00 | 310 | 2,65 | ||||
| 2026-02-13 | 13F | Pinnacle Wealth Planning Services, Inc. | 14.714 | -1,45 | 702 | 1,15 | ||||
| 2026-02-12 | 13F | Kovack Advisors, Inc. | 10.629 | 56,26 | 486 | 53,48 | ||||
| 2026-02-13 | 13F | Maia Wealth LLC | 0 | -100,00 | 0 | |||||
| 2026-01-28 | 13F | Arbor Capital Management Inc /adv | 5.355 | -11,78 | 256 | -9,57 | ||||
| 2026-01-26 | 13F | AE Wealth Management LLC | 155 | -11,43 | 7 | -12,50 | ||||
| 2026-02-13 | 13F | First Trust Advisors Lp | 12.282 | 58,87 | 586 | 63,23 | ||||
| 2026-02-17 | 13F | Per Stirling Capital Management, LLC. | 6.022 | -0,22 | 287 | 2,50 | ||||
| 2026-02-05 | 13F | 1st Source Bank | 0 | -100,00 | 0 | |||||
| 2026-02-11 | 13F | Winnow Wealth Llc | 6.767 | -1,47 | 325 | 0,62 | ||||
| 2026-02-05 | 13F | Allworth Financial LP | 500 | 0,00 | 24 | 0,00 | ||||
| 2026-02-03 | 13F | RFG Advisory, LLC | 11.212 | 1,82 | 535 | 4,49 | ||||
| 2026-02-12 | 13F | Benson Wealth Management INC | 1.196 | 57 | ||||||
| 2026-01-12 | 13F | Focus Financial Network, Inc. | 5.134 | -28,23 | 245 | -26,20 | ||||
| 2026-01-23 | 13F | Farther Finance Advisors, LLC | 16.479 | -28,25 | 786 | -26,40 | ||||
| 2026-01-29 | 13F | Jim Saulnier & Associates, Llc | 10.014 | 0,00 | 478 | 2,36 | ||||
| 2026-02-12 | 13F | Gerber Kawasaki Wealth & Investment Management | 0 | -100,00 | 0 | |||||
| 2026-01-23 | 13F | Lunt Capital Management, Inc. | 0 | -100,00 | 0 | |||||
| 2026-02-13 | 13F | Alerus Financial Na | 4.700 | 0,00 | 224 | 2,75 | ||||
| 2026-01-12 | 13F | Castleview Partners, Llc | 7.370 | 0,00 | 352 | 2,63 | ||||
| 2026-02-02 | 13F | AlphaStar Capital Management, LLC | 4.447 | 0,00 | 212 | 2,91 | ||||
| 2026-02-10 | 13F | Evolution Wealth Management Inc. | 3.470 | -0,09 | 166 | 2,48 | ||||
| 2026-01-29 | 13F | UBS Group AG | 125 | -71,53 | 6 | -75,00 | ||||
| 2025-11-07 | 13F | Synovus Financial Corp | 32.004 | 1,79 | 1.489 | 6,13 | ||||
| 2026-01-05 | 13F | Foguth Wealth Management, LLC. | 9.510 | -20,64 | 454 | -15,14 | ||||
| 2026-02-06 | 13F | Tanglewood Legacy Advisors, LLC | 38.173 | 0,00 | 1.822 | 2,53 | ||||
| 2026-01-22 | 13F | Apollon Wealth Management, LLC | 11.540 | 0,00 | 551 | 2,42 | ||||
| 2026-01-26 | 13F | SMART Wealth LLC | 56.064 | -9,68 | 2.675 | -7,38 | ||||
| 2026-02-03 | 13F | Luken Investment Analytics, LLC | 11.300 | 0,00 | 539 | 2,67 | ||||
| 2026-01-23 | 13F | Ogorek Anthony Joseph /ny/ /adv | 10.721 | -0,19 | 1 | |||||
| 2026-02-17 | 13F | Citadel Advisors Llc | 0 | -100,00 | 0 | |||||
| 2025-11-12 | 13F | Aptus Capital Advisors, LLC | 0 | -100,00 | 0 | |||||
| 2026-02-20 | 13F | Sunbelt Securities, Inc. | 68.108 | -1,02 | 3.250 | 1,50 | ||||
| 2026-01-07 | 13F | Sovereign Financial Group, Inc. | 12.524 | -1,81 | 598 | 0,67 | ||||
| 2026-02-14 | 13F | Rockefeller Capital Management L.P. | 3.406 | -29,56 | 163 | -28,00 | ||||
| 2026-02-12 | 13F | Hrt Financial Lp | 0 | -100,00 | 0 | |||||
| 2026-02-17 | 13F | Old Mission Capital Llc | 40.763 | 152,34 | 1.945 | 158,99 | ||||
| 2026-01-26 | 13F | Cottage Street Advisors LLC | 4.307 | 0,00 | 206 | 2,50 | ||||
| 2026-02-12 | 13F | Triumph Capital Management | 4.522 | -42,77 | 216 | -41,42 | ||||
| 2026-02-04 | 13F | Ameritas Advisory Services, LLC | 13.247 | -41,14 | 632 | -39,64 | ||||
| 2026-02-13 | 13F | Glen Eagle Advisors, LLC | 9.557 | -17,05 | 456 | -14,93 | ||||
| 2025-11-14 | 13F | Wolverine Trading, Llc | 0 | -100,00 | 0 | |||||
| 2026-01-29 | 13F | IMC-Chicago, LLC | 16.715 | 798 | ||||||
| 2026-01-23 | 13F | Diversify Advisory Services, LLC | 11.920 | 0,00 | 573 | 2,33 | ||||
| 2026-01-29 | 13F | Comprehensive Financial Consultants Institutional, Inc. | 22.942 | -0,37 | 1.095 | 2,15 | ||||
| 2026-02-02 | 13F | CX Institutional | 3.380 | 0 | ||||||
| 2026-02-05 | 13F | Center for Financial Planning, Inc. | 500 | 0,00 | 24 | 0,00 | ||||
| 2026-02-13 | 13F | Morgan Stanley | 3.721 | 0,00 | 178 | 2,31 | ||||
| 2026-02-05 | 13F | Integrated Investment Consultants, LLC | 4.319 | 0,00 | 206 | 3,00 | ||||
| 2026-01-15 | 13F | Columbus Macro, LLC | 4.553 | -33,26 | 217 | -31,55 | ||||
| 2026-02-13 | 13F | Mariner, LLC | 44.375 | -6,37 | 2.118 | -3,99 | ||||
| 2026-02-12 | 13F | StoneX Group Inc. | 18.079 | -2,24 | 863 | 0,23 | ||||
| 2026-02-11 | 13F | Buckingham Strategic Partners | 10.399 | -50,00 | 496 | -49,23 | ||||
| 2026-02-17 | 13F | Pinnacle Financial Partners, Inc. | 4.295 | 205 | ||||||
| 2026-02-17 | 13F | Advisor Group Holdings, Inc. | 157.681 | -17,59 | 7.525 | -14,66 | ||||
| 2026-01-21 | 13F | SJS Investment Consulting Inc. | 305 | 0,00 | 15 | 0,00 | ||||
| 2026-02-02 | 13F | Oppenheimer & Co Inc | 4.416 | -1,21 | 211 | 0,96 | ||||
| 2026-02-11 | 13F | Arrowroot Family Office, LLC | 6.054 | 0,00 | 289 | 2,49 | ||||
| 2026-01-21 | 13F | Capital Investment Advisory Services, LLC | 146 | 7 | ||||||
| 2026-01-21 | 13F | Walkner Condon Financial Advisors LLC | 12.014 | 0,00 | 573 | 2,50 | ||||
| 2026-01-23 | 13F | Assetmark, Inc | 10 | 0 | ||||||
| 2026-01-07 | 13F | Precedent Wealth Partners, Llc | 89.516 | -59,35 | 4.272 | -58,32 | ||||
| 2026-02-13 | 13F | National Bank Of Canada /fi/ | 850 | 0,00 | 41 | 2,56 | ||||
| 2026-02-12 | 13F | Commonwealth Equity Services, Llc | 197.344 | -23,00 | 9.418 | 85.509,09 | ||||
| 2026-02-02 | 13F | Mutual Advisors, LLC | 42.471 | -0,53 | 2.027 | 1,55 | ||||
| 2026-01-26 | 13F | Nations Financial Group Inc, /ia/ /adv | 5.365 | 0,00 | 256 | 2,81 | ||||
| 2026-02-02 | 13F | Holistic Planning, LLC | 111.876 | -8,91 | 5.339 | -6,60 | ||||
| 2026-02-04 | 13F | GGM Financials LLC | 2.370 | 0,00 | 113 | 2,73 | ||||
| 2026-02-09 | 13F | MSH Capital Advisors LLC | 8.146 | 389 | ||||||
| 2026-02-13 | 13F | Kestra Advisory Services, LLC | 0 | -100,00 | 0 | |||||
| 2026-01-05 | 13F | Noble Wealth Management PBC | 700 | 0,00 | 33 | 3,13 | ||||
| 2025-11-13 | 13F | Legacy Capital Wealth Partners, LLC | 0 | -100,00 | 0 | -100,00 | ||||
| 2026-02-06 | 13F | Creative Financial Designs Inc /adv | 630 | 0,00 | 30 | 3,45 | ||||
| 2026-01-30 | 13F | CFC Planning Co LLC | 5.914 | -0,14 | 282 | 2,55 | ||||
| 2026-02-05 | 13F | Tucker Asset Management Llc | 1.907 | -0,37 | 91 | 2,25 | ||||
| 2026-01-14 | 13F | Spire Wealth Management | 37.153 | -23,81 | 1.773 | -21,90 | ||||
| 2026-01-12 | 13F | Sax Wealth Advisors, Llc | 0 | -100,00 | 0 | |||||
| 2026-01-15 | 13F | Victory Financial Group, Llc | 0 | -100,00 | 0 | |||||
| 2026-02-05 | 13F | WealthPlan Investment Management, LLC | 10.630 | -1,83 | 507 | 0,80 | ||||
| 2026-02-17 | 13F | Raymond James Financial Inc | 110.757 | -18,11 | 5.286 | -16,02 | ||||
| 2026-02-13 | 13F | Integrity Financial Corp /WA | 25.332 | -32,05 | 1.209 | -30,33 | ||||
| 2025-10-21 | 13F | Mayfair Advisory Group, LLC | 0 | -100,00 | 0 | -100,00 | ||||
| 2026-02-06 | 13F | HighTower Advisors, LLC | 8.470 | -15,89 | 404 | -13,68 | ||||
| 2025-10-21 | 13F | SILVER OAK SECURITIES, Inc | 0 | -100,00 | 0 | -100,00 | ||||
| 2026-02-04 | 13F | Money Concepts Capital Corp | 18.465 | 0,00 | 881 | 2,56 | ||||
| 2026-01-13 | 13F | CoreCap Advisors, LLC | 1.144 | -2,31 | 55 | 0,00 | ||||
| 2025-11-12 | 13F | Armis Advisers, LLC | 0 | -100,00 | 0 | |||||
| 2026-02-17 | 13F | Captrust Financial Advisors | 14.200 | 0,00 | 678 | 2,58 | ||||
| 2026-02-13 | 13F | Centaurus Financial, Inc. | 17.557 | 0,00 | 1 | |||||
| 2025-11-06 | 13F | Atria Investments Llc | 0 | -100,00 | 0 | |||||
| 2026-02-13 | 13F | Icon Wealth Advisors, LLC | 0 | -100,00 | 0 | |||||
| 2025-11-14 | 13F | Brass Tax Wealth Management, Inc | 8.527 | -3,53 | 397 | 0,51 | ||||
| 2026-02-11 | 13F | Lifestyle Asset Management, Inc. | 5.350 | 0,00 | 255 | 2,82 | ||||
| 2026-02-13 | 13F | Arkadios Wealth Advisors | 10.947 | 0,00 | 522 | 2,55 | ||||
| 2025-10-08 | 13F | Beacon Financial Group | 86.574 | -8,17 | 4.029 | -4,30 | ||||
| 2026-01-26 | 13F | LifeWealth Investments, LLC | 68.120 | -2,58 | 3.251 | -0,12 | ||||
| 2026-02-06 | 13F | Larson Financial Group LLC | 64 | 0,00 | 3 | 50,00 | ||||
| 2026-02-11 | 13F | Jpmorgan Chase & Co | 258 | 12 | ||||||
| 2026-02-13 | 13F | Integrated Wealth Concepts LLC | 59.846 | 0,00 | 2.856 | 2,51 | ||||
| 2026-02-06 | 13F | IFP Advisors, Inc | 8.500 | 524,54 | 406 | 542,86 | ||||
| 2026-01-20 | 13F | C2P Capital Advisory Group, LLC d.b.a. Prosperity Capital Advisors | 14.150 | 675 | ||||||
| 2026-02-09 | 13F | Global Assets Advisory, LLC | 14.650 | 0,00 | 699 | 2,64 | ||||
| 2026-02-11 | 13F | Capital Analysts, Inc. | 3.500 | 0,00 | 0 | |||||
| 2026-02-17 | 13F | Susquehanna International Group, Llp | 7.165 | 342 | ||||||
| 2026-02-17 | 13F | Wiley Bros.-aintree Capital, Llc | 22.308 | 1.024 | ||||||
| 2026-02-13 | 13F | Luminist Capital LLC | 3.579 | 0,00 | 171 | 2,41 | ||||
| 2026-02-17 | 13F | Bank Of America Corp /de/ | 0 | -100,00 | 0 | |||||
| 2026-01-14 | 13F | Nova Wealth Management, Inc. | 10.774 | -1,33 | 514 | 1,18 | ||||
| 2026-02-13 | 13F | Mml Investors Services, Llc | 35.945 | 18,42 | 1.715 | 21,46 | ||||
| 2026-02-12 | 13F | Wood Tarver Financial Group, LLC | 36.234 | -1,99 | 2 | 0,00 | ||||
| 2025-11-12 | 13F | Blair William & Co/il | 0 | -100,00 | 0 | -100,00 | ||||
| 2026-01-23 | 13F | DHJJ Financial Advisors, Ltd. | 2.675 | 0,00 | 128 | 2,42 | ||||
| 2026-01-07 | 13F | Lakeridge Wealth Management LLC | 13.926 | 0,00 | 665 | 2,47 | ||||
| 2025-11-14 | 13F | Prosperity Consulting Group, LLC | 0 | -100,00 | 0 | |||||
| 2026-01-30 | 13F | Strategic Blueprint, LLC | 9.031 | 0,00 | 431 | 2,38 | ||||
| 2026-02-11 | 13F | Janney Montgomery Scott LLC | 88.621 | -10,39 | 4 | 0,00 | ||||
| 2026-02-17 | 13F | Warren Averett Asset Management, LLC | 8.527 | 407 | ||||||
| 2025-10-07 | 13F | Sage Capital Advisors,llc | 0 | -100,00 | 0 | -100,00 | ||||
| 2026-02-13 | 13F | Advyzon Investment Management, LLC | 9.278 | -38,89 | 443 | -37,39 | ||||
| 2026-02-03 | 13F | Buck Wealth Strategies, LLC | 17.250 | -1,40 | 823 | 1,11 | ||||
| 2026-02-02 | 13F | Horizon Investments, LLC | 57.372 | 9,14 | 2.738 | 11,90 | ||||
| 2026-02-11 | 13F | LPL Financial LLC | 65.440 | 0,56 | 3.123 | 3,10 | ||||
| 2026-02-18 | 13F | Crusonia Wealth Advisors LLC | 11.730 | 560 | ||||||
| 2026-01-22 | 13F | Madrona Financial Services, LLC | 15.768 | 0,00 | 752 | 2,59 | ||||
| 2026-02-02 | 13F | Truist Financial Corp | 34.358 | 11,21 | 1.640 | 14,06 | ||||
| 2026-02-12 | 13F | Wedbush Securities Inc | 17.925 | 0,00 | 1 | |||||
| 2026-02-02 | 13F | Sun Financial Inc | 14.183 | 677 | ||||||
| 2026-02-03 | 13F | Acorn Financial Advisory Services Inc /adv | 4.755 | 0,00 | 227 | 2,26 | ||||
| 2026-02-06 | 13F | Csenge Advisory Group | 7.854 | 0,00 | 375 | 2,47 | ||||
| 2026-02-17 | 13F | Cetera Investment Advisers | 166.280 | 1,87 | 7.935 | 4,48 | ||||
| 2026-02-12 | 13F | Insigneo Advisory Services, Llc | 10.050 | 0,00 | 480 | 2,57 | ||||
| 2026-02-02 | 13F | Grantvest Financial Group LLC | 4.959 | -11,43 | 237 | -9,23 | ||||
| 2026-02-12 | 13F | Bank Of Montreal /can/ | 100 | 0,00 | 5 | 0,00 | ||||
| 2026-02-17 | 13F | National Asset Management, Inc. | 0 | -100,00 | 0 | -100,00 | ||||
| 2026-02-09 | 13F | Harbour Investments, Inc. | 72.377 | -9,14 | 3.454 | -6,83 | ||||
| 2026-02-10 | 13F | Ritter Daniher Financial Advisory LLC / DE | 14.975 | -67,31 | 715 | -66,49 | ||||
| 2026-02-18 | 13F | Onyx Bridge Wealth Group LLC | 9.152 | -8,74 | 437 | -6,44 | ||||
| 2026-02-17 | 13F | Integrated Advisors Network LLC | 21.387 | 0,68 | 1.021 | 3,24 | ||||
| 2025-11-14 | 13F | Jane Street Group, Llc | 0 | -100,00 | 0 | |||||
| 2026-02-18 | 13F | GWM Advisors LLC | 0 | -100,00 | 0 | |||||
| 2025-11-07 | 13F | Kraematon Investment Advisors, Inc | 0 | -100,00 | 0 | -100,00 | ||||
| 2026-02-06 | 13F | Ignite Planners, LLC | 29.258 | -21,28 | 1.410 | -18,51 | ||||
| 2026-02-12 | 13F | Oder Investment Management, LLC | 16.821 | -4,92 | 803 | -2,55 | ||||
| 2026-02-10 | 13F | Founders Financial Securities Llc | 58.704 | 9,26 | 2.801 | 12,04 | ||||
| 2025-10-08 | 13F | Patriot Financial Group Insurance Agency, LLC | 0 | -100,00 | 0 |