Grundlæggende statistik
| Institutionelle ejere | 64 total, 63 long only, 0 short only, 1 long/short - change of 10,17% MRQ |
| Gennemsnitlig porteføljeallokering | 0.0298 % - change of 22,66% MRQ |
| Institutionelle aktier (lange) | 1.028.841 (ex 13D/G) - change of -0,31MM shares -23,28% MRQ |
| Institutionel værdi (lang) | $ 43.234 USD ($1000) |
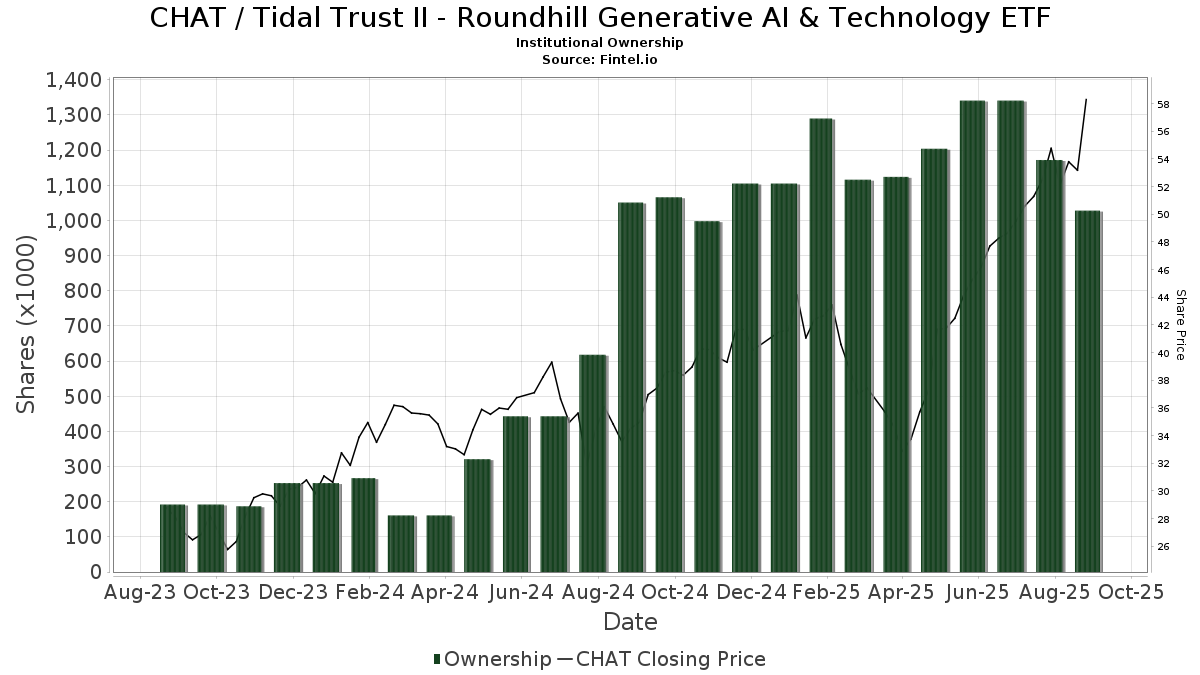
Institutionelt ejerskab og aktionærer
Tidal Trust II - Roundhill Generative AI & Technology ETF (US:CHAT) har 64 institutionelle ejere og aktionærer, der har indsendt 13D/G- eller 13F-formularer til Securities Exchange Commission (SEC). Disse institutioner har i alt 1,028,841 aktier. Største aktionærer omfatter LPL Financial LLC, Gradient Investments LLC, Commonwealth Equity Services, Llc, Gemmer Asset Management LLC, Mattson Financial Services, LLC, Susquehanna International Group, Llp, Advisor Group Holdings, Inc., Janney Montgomery Scott LLC, Cambridge Investment Research Advisors, Inc., and Avantax Advisory Services, Inc. .
Tidal Trust II - Roundhill Generative AI & Technology ETF (ARCA:CHAT) institutionel ejerskabsstruktur viser aktuelle positioner i virksomheden efter institutioner og fonde, samt seneste ændringer i positionsstørrelse. Større aktionærer kan omfatte individuelle investorer, investeringsforeninger, hedgefonde eller institutioner. Skema 13D angiver, at investoren besidder (eller besidder) mere end 5 % af virksomheden og har til hensigt (eller har til hensigt at) aktivt at forfølge en ændring i forretningsstrategi. Skema 13G indikerer en passiv investering på over 5%.
The share price as of September 12, 2025 is 58,69 / share. Previously, on September 12, 2024, the share price was 35,08 / share. This represents an increase of 67,29% over that period.
Fondens stemningsscore
Fund Sentiment Score (fka Ownership Accumulation Score) finder de aktier, der bliver mest købt af fonde. Det er resultatet af en sofistikeret, multi-faktor kvantitativ model, der identificerer virksomheder med de højeste niveauer af institutionel akkumulering. Scoringsmodellen bruger en kombination af den samlede stigning i oplyste ejere, ændringerne i porteføljeallokeringer i disse ejere og andre målinger. Tallet går fra 0 til 100, hvor højere tal indikerer et højere niveau af akkumulering for sine jævnaldrende, og 50 er gennemsnittet.
Opdateringsfrekvens: Dagligt
Se Ownership Explorer, som giver en liste over højest rangerende virksomheder.
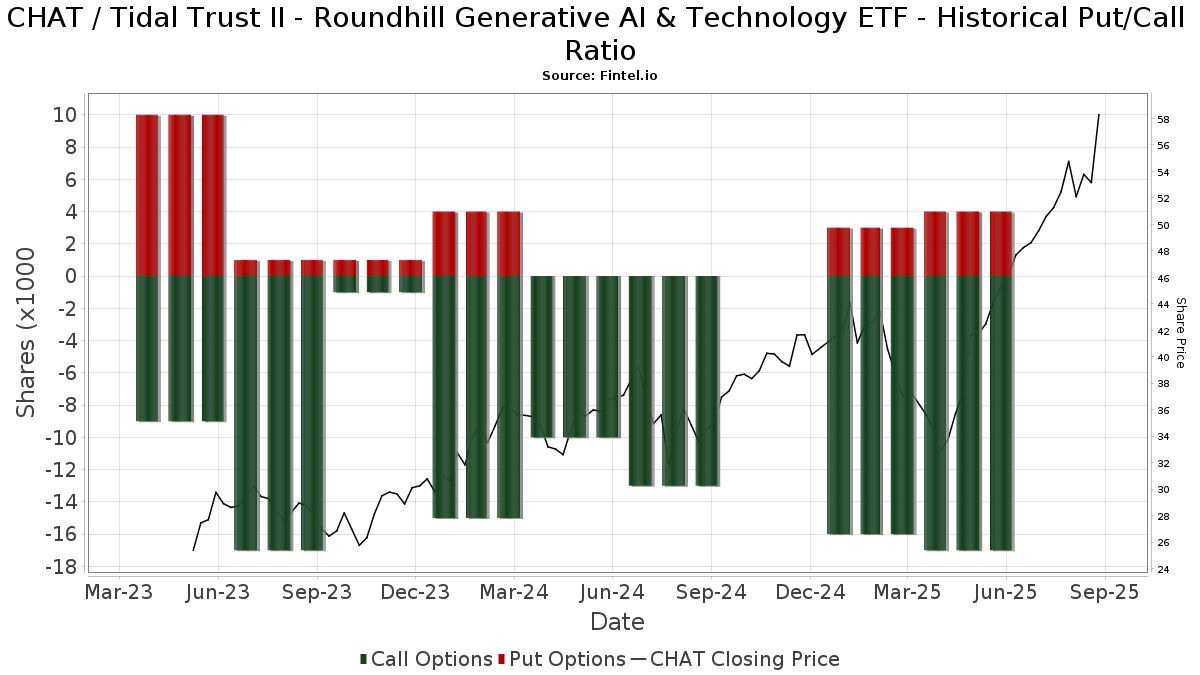
Institutionel Put/Call-forhold
Ud over at indberette standardaktie- og gældsudstedelser skal institutter med mere end 100 mill. aktiver under forvaltning også oplyse deres put- og call-optionsbeholdninger. Da salgsoptioner generelt indikerer negativ stemning, og købsoptioner indikerer positiv stemning, kan vi få en fornemmelse af den overordnede institutionelle stemning ved at plotte forholdet mellem put og kald. Diagrammet til højre viser det historiske put/call-forhold for dette instrument.
Brug af Put/Call Ratio som en indikator for investorernes stemning overvinder en af de vigtigste mangler ved at bruge totalt institutionelt ejerskab, som er, at en betydelig mængde af aktiver under forvaltning investeres passivt for at spore indekser. Passivt forvaltede fonde køber typisk ikke optioner, så indikatoren for put/call-forholdet følger mere nøje følelsen af aktivt forvaltede fonde.
13F og NPORT arkivering
Detaljer om 13F-arkivering er gratis. Detaljer om NP-ansøgninger kræver et premium-medlemskab. Grønne rækker angiver nye positioner. Røde rækker angiver lukkede positioner. Klik på linket ikon for at se den fulde transaktionshistorik.
Opgrader
for at låse premium-data op og eksportere til Excel ![]() .
.
| Fil dato | Kilde | Investor | Type | Gennemsnitlig pris (Øst) |
Aktier | Δ Aktier (%) |
Rapporteret Værdi ($1000) |
Δ Værdi (%) |
Port Alloc (%) |
|
|---|---|---|---|---|---|---|---|---|---|---|
| 2025-08-11 | 13F | WPG Advisers, LLC | 85 | 0,00 | 4 | 100,00 | ||||
| 2025-07-14 | 13F | Armstrong Advisory Group, Inc | 56 | 3 | ||||||
| 2025-08-29 | 13F | Evolution Wealth Management Inc. | 971 | 47 | ||||||
| 2025-08-06 | 13F | Legacy Investment Solutions, LLC | 893 | 44 | ||||||
| 2025-07-30 | 13F | Brookstone Capital Management | 4.142 | 202 | ||||||
| 2025-08-14 | 13F | Toroso Investments, LLC | 5.223 | 255 | ||||||
| 2025-08-14 | 13F | Colony Group, LLC | 6.180 | 0,00 | 301 | 40,00 | ||||
| 2025-09-04 | 13F | ZynergyRetirementPlanningLLC | 0 | -100,00 | 0 | |||||
| 2025-08-01 | 13F | Ashton Thomas Private Wealth, LLC | 6.113 | 298 | ||||||
| 2025-07-25 | 13F | Endowment Wealth Management, Inc. | 7.571 | 23,07 | 369 | 72,43 | ||||
| 2025-07-31 | 13F | Cambridge Investment Research Advisors, Inc. | 23.214 | 248,72 | 1 | |||||
| 2025-07-24 | 13F | Ronald Blue Trust, Inc. | 472 | 0,00 | 23 | 43,75 | ||||
| 2025-08-15 | 13F | Morgan Stanley | 1.620 | 0,00 | 79 | 41,07 | ||||
| 2025-08-12 | 13F | Proequities, Inc. | 0 | 0 | ||||||
| 2025-07-22 | 13F | Gemmer Asset Management LLC | 65.613 | 43,68 | 3.201 | 101,13 | ||||
| 2025-08-05 | 13F | Bank Of Montreal /can/ | 0 | -100,00 | 0 | |||||
| 2025-08-14 | 13F | Citadel Advisors Llc | Call | 11.400 | 225,71 | 556 | 359,50 | |||
| 2025-08-05 | 13F | Simplex Trading, Llc | 0 | -100,00 | 0 | |||||
| 2025-08-14 | 13F | Citadel Advisors Llc | Put | 4.500 | 21,62 | 220 | 71,09 | |||
| 2025-08-14 | 13F | UBS Group AG | 244 | 144,00 | 12 | 266,67 | ||||
| 2025-07-24 | 13F | IFP Advisors, Inc | 640 | 0,00 | 31 | 40,91 | ||||
| 2025-08-14 | 13F | Federation des caisses Desjardins du Quebec | 130 | 0,00 | 6 | 50,00 | ||||
| 2025-07-22 | 13F | Beacon Financial Advisory LLC | 9.782 | 0,00 | 477 | 40,29 | ||||
| 2025-09-04 | 13F/A | Advisor Group Holdings, Inc. | 32.044 | 0,80 | 1.563 | 41,19 | ||||
| 2025-08-06 | 13F | Legacy Wealth Managment, LLC/ID | 893 | -25,27 | 44 | 4,88 | ||||
| 2025-08-05 | 13F | Huntington National Bank | 12 | 50,00 | ||||||
| 2025-07-08 | 13F | Gradient Investments LLC | 259.180 | 16,24 | 12.643 | 62,70 | ||||
| 2025-08-11 | 13F | Synergy Investment Management, LLC | 0 | -100,00 | 0 | |||||
| 2025-08-11 | 13F | FSA Wealth Management LLC | 250 | 12 | ||||||
| 2025-07-11 | 13F | Seacrest Wealth Management, Llc | 9.950 | 35,37 | 485 | 89,45 | ||||
| 2025-07-17 | 13F | Albion Financial Group /ut | 68 | 0,00 | 3 | 50,00 | ||||
| 2025-08-14 | 13F | Jane Street Group, Llc | 0 | -100,00 | 0 | |||||
| 2025-08-14 | 13F | GWM Advisors LLC | 428 | -93,25 | 21 | -90,91 | ||||
| 2025-08-14 | 13F | Raymond James Financial Inc | 1.545 | 75 | ||||||
| 2025-08-14 | 13F | Wells Fargo & Company/mn | 1 | 0,00 | 0 | |||||
| 2025-08-13 | 13F | Flow Traders U.s. Llc | 0 | -100,00 | 0 | |||||
| 2025-07-28 | 13F | Harbour Investments, Inc. | 2.138 | 0,00 | 104 | 40,54 | ||||
| 2025-07-31 | 13F | Glass Jacobson Investment Advisors llc | 442 | 0,00 | 22 | 23,53 | ||||
| 2025-08-06 | 13F | AE Wealth Management LLC | 1.283 | 127,08 | 63 | 226,32 | ||||
| 2025-08-08 | 13F | Larson Financial Group LLC | 333 | 16 | ||||||
| 2025-08-14 | 13F | Royal Bank Of Canada | 1.167 | 0,00 | 57 | 39,02 | ||||
| 2025-08-15 | 13F | Koesten, Hirschmann & Crabtree, INC. | 27 | 0,00 | 1 | |||||
| 2025-08-12 | 13F | Jpmorgan Chase & Co | 1.300 | 63 | ||||||
| 2025-04-28 | 13F | Strategic Financial Concepts, LLC | 0 | -100,00 | 0 | -100,00 | ||||
| 2025-07-22 | 13F | Valley National Advisers Inc | 13.546 | -3,34 | 1 | |||||
| 2025-08-14 | 13F | Fmr Llc | 0 | -100,00 | 0 | |||||
| 2025-08-08 | 13F | Cetera Investment Advisers | 4.720 | 230 | ||||||
| 2025-08-14 | 13F | Horizon Investments, LLC | 8 | 0,00 | 0 | |||||
| 2025-08-13 | 13F | Quadrant Capital Group Llc | 0 | -100,00 | 0 | |||||
| 2025-08-15 | 13F | ROSS\JOHNSON & Associates LLC | 150 | 0,00 | 7 | 40,00 | ||||
| 2025-08-04 | 13F | Spire Wealth Management | 1.000 | 49 | ||||||
| 2025-07-24 | 13F | Us Bancorp \de\ | 100 | 5 | ||||||
| 2025-08-04 | 13F | Roble, Belko & Company, Inc | 216 | 0 | ||||||
| 2025-08-14 | 13F | Citadel Advisors Llc | 0 | -100,00 | 0 | |||||
| 2025-08-14 | 13F | Group One Trading, L.p. | 509 | 25 | ||||||
| 2025-07-29 | 13F | International Assets Investment Management, Llc | 11.017 | 1,57 | 537 | 42,06 | ||||
| 2025-07-17 | 13F | Janney Montgomery Scott LLC | 23.876 | 284,04 | 1 | |||||
| 2025-08-01 | 13F | Envestnet Asset Management Inc | 4.205 | -78,89 | 205 | -70,46 | ||||
| 2025-08-06 | 13F | Kcm Investment Advisors Llc | 4.707 | 230 | ||||||
| 2025-05-09 | 13F | Advyzon Investment Management, LLC | 0 | -100,00 | 0 | |||||
| 2025-07-15 | 13F | MCF Advisors LLC | 1 | 0,00 | 0 | |||||
| 2025-08-12 | 13F | Global Retirement Partners, LLC | 1 | 0 | ||||||
| 2025-08-08 | 13F | Creative Planning | 10.984 | 55,38 | 536 | 117,48 | ||||
| 2025-07-17 | 13F | Jackson, Grant Investment Advisers, Inc. | 2.278 | 0,00 | 111 | 40,51 | ||||
| 2025-08-13 | 13F | Marshall Wace, Llp | 6.400 | 312 | ||||||
| 2025-08-14 | 13F | Old Mission Capital Llc | 0 | -100,00 | 0 | |||||
| 2025-07-17 | 13F | Venture Visionary Partners LLC | 0 | -100,00 | 0 | |||||
| 2025-08-14 | 13F | Bank Of America Corp /de/ | 206 | 10,75 | 10 | 66,67 | ||||
| 2025-08-18 | 13F | Geneos Wealth Management Inc. | 600 | 29 | ||||||
| 2025-08-06 | 13F | Commonwealth Equity Services, Llc | 81.318 | -28,04 | 4 | 0,00 | ||||
| 2025-08-07 | 13F | Allworth Financial LP | 160 | 0,00 | 8 | 40,00 | ||||
| 2025-08-14 | 13F | Stifel Financial Corp | 7.513 | -42,05 | 366 | -18,85 | ||||
| 2025-08-14 | 13F | Visionary Wealth Advisors | 13.393 | 60,63 | 653 | 125,17 | ||||
| 2025-07-17 | 13F | Beacon Capital Management, LLC | 600 | 0,00 | 29 | 45,00 | ||||
| 2025-07-29 | 13F | Mattson Financial Services, LLC | 47.226 | 9,50 | 2.304 | 53,23 | ||||
| 2025-08-12 | 13F | Waddell & Associates, Llc | 0 | -100,00 | 0 | |||||
| 2025-08-14 | 13F | Susquehanna International Group, Llp | 34.211 | -56,26 | 1.669 | -38,79 | ||||
| 2025-08-08 | 13F | Pnc Financial Services Group, Inc. | 0 | -100,00 | 0 | |||||
| 2025-07-10 | 13F | Wealth Enhancement Advisory Services, Llc | 8.908 | 0,67 | 434 | 40,91 | ||||
| 2025-08-14 | 13F | Susquehanna International Group, Llp | Call | 5.600 | -15,15 | 273 | 18,70 | |||
| 2025-08-18 | 13F | Wolverine Trading, Llc | Call | 0 | -100,00 | 0 | ||||
| 2025-08-08 | 13F | Avantax Advisory Services, Inc. | 18.658 | -34,81 | 910 | -8,73 | ||||
| 2025-08-12 | 13F | LPL Financial LLC | 282.650 | 14,69 | 13.788 | 60,54 | ||||
| 2025-08-15 | 13F | Equitable Holdings, Inc. | 5.682 | 277 |