Grundlæggende statistik
| Institutionelle ejere | 84 total, 84 long only, 0 short only, 0 long/short - change of 23,19% MRQ |
| Gennemsnitlig porteføljeallokering | 0.2735 % - change of -13,50% MRQ |
| Institutionelle aktier (lange) | 12.041.962 (ex 13D/G) - change of 2,51MM shares 26,32% MRQ |
| Institutionel værdi (lang) | $ 262.179 USD ($1000) |
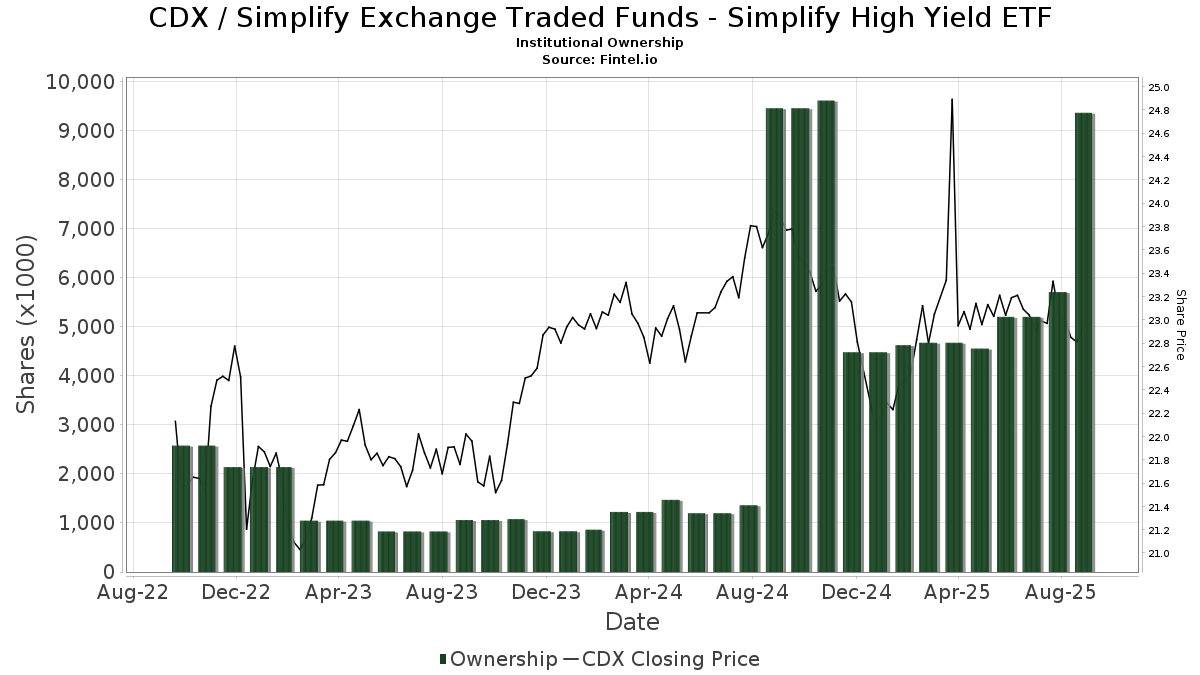
Institutionelt ejerskab og aktionærer
Simplify Exchange Traded Funds - Simplify High Yield ETF (US:CDX) har 84 institutionelle ejere og aktionærer, der har indsendt 13D/G- eller 13F-formularer til Securities Exchange Commission (SEC). Disse institutioner har i alt 12,041,962 aktier. Største aktionærer omfatter Envestnet Asset Management Inc, AE Wealth Management LLC, Park Edge Advisors, LLC, LPL Financial LLC, Insight Wealth Strategies, LLC, Commonwealth Equity Services, Llc, Drive Wealth Management, Llc, NewEdge Wealth, LLC, Meridian Wealth Management, LLC, and Brinker Capital Investments, LLC .
Simplify Exchange Traded Funds - Simplify High Yield ETF (ARCA:CDX) institutionel ejerskabsstruktur viser aktuelle positioner i virksomheden efter institutioner og fonde, samt seneste ændringer i positionsstørrelse. Større aktionærer kan omfatte individuelle investorer, investeringsforeninger, hedgefonde eller institutioner. Skema 13D angiver, at investoren besidder (eller besidder) mere end 5 % af virksomheden og har til hensigt (eller har til hensigt at) aktivt at forfølge en ændring i forretningsstrategi. Skema 13G indikerer en passiv investering på over 5%.
The share price as of March 20, 2026 is 21,52 / share. Previously, on March 24, 2025, the share price was 23,08 / share. This represents a decline of 6,76% over that period.
Fondens stemningsscore
Fund Sentiment Score (fka Ownership Accumulation Score) finder de aktier, der bliver mest købt af fonde. Det er resultatet af en sofistikeret, multi-faktor kvantitativ model, der identificerer virksomheder med de højeste niveauer af institutionel akkumulering. Scoringsmodellen bruger en kombination af den samlede stigning i oplyste ejere, ændringerne i porteføljeallokeringer i disse ejere og andre målinger. Tallet går fra 0 til 100, hvor højere tal indikerer et højere niveau af akkumulering for sine jævnaldrende, og 50 er gennemsnittet.
Opdateringsfrekvens: Dagligt
Se Ownership Explorer, som giver en liste over højest rangerende virksomheder.
AI+ Ask Fintel’s AI assistant about Simplify Exchange Traded Funds - Simplify High Yield ETF.
Select a question to share a public post with an AI-crafted answer.
Thinking of good questions…
Institutionel Put/Call-forhold
Ud over at indberette standardaktie- og gældsudstedelser skal institutter med mere end 100 mill. aktiver under forvaltning også oplyse deres put- og call-optionsbeholdninger. Da salgsoptioner generelt indikerer negativ stemning, og købsoptioner indikerer positiv stemning, kan vi få en fornemmelse af den overordnede institutionelle stemning ved at plotte forholdet mellem put og kald. Diagrammet til højre viser det historiske put/call-forhold for dette instrument.
Brug af Put/Call Ratio som en indikator for investorernes stemning overvinder en af de vigtigste mangler ved at bruge totalt institutionelt ejerskab, som er, at en betydelig mængde af aktiver under forvaltning investeres passivt for at spore indekser. Passivt forvaltede fonde køber typisk ikke optioner, så indikatoren for put/call-forholdet følger mere nøje følelsen af aktivt forvaltede fonde.
13F og NPORT arkivering
Detaljer om 13F-arkivering er gratis. Detaljer om NP-ansøgninger kræver et premium-medlemskab. Grønne rækker angiver nye positioner. Røde rækker angiver lukkede positioner. Klik på linket ikon for at se den fulde transaktionshistorik.
Opgrader
for at låse premium-data op og eksportere til Excel ![]() .
.
| Fil dato | Kilde | Investor | Type | Gennemsnitlig pris (Øst) |
Aktier | Δ Aktier (%) |
Rapporteret Værdi ($1000) |
Δ Værdi (%) |
Port Alloc (%) |
|
|---|---|---|---|---|---|---|---|---|---|---|
| 2026-02-17 | 13F | LaSalle St. Investment Advisors, LLC | 19.292 | 51,85 | 0 | |||||
| 2026-02-12 | 13F | Steward Partners Investment Advisory, Llc | 226.554 | 18,94 | 5.045 | 15,63 | ||||
| 2026-01-28 | 13F | Geneos Wealth Management Inc. | 71 | 1,43 | 2 | 0,00 | ||||
| 2026-01-27 | 13F | Elevated Capital Advisors, LLC | 155 | 3 | ||||||
| 2026-01-02 | 13F | Insight Wealth Strategies, LLC | 647.232 | 25,71 | 14.414 | 22,20 | ||||
| 2026-02-12 | 13F | Triumph Capital Management | 9.757 | 3,12 | 217 | 0,46 | ||||
| 2025-10-15 | 13F | Brookstone Capital Management | 0 | -100,00 | 0 | |||||
| 2026-01-21 | 13F | MBA Advisors LLC | 11.312 | 252 | ||||||
| 2026-02-04 | 13F | Meridian Wealth Management, LLC | 319.206 | 7.109 | ||||||
| 2026-02-05 | 13F | Security National Bank | 199.112 | 11,21 | 4.434 | 8,09 | ||||
| 2026-02-12 | 13F | StoneX Group Inc. | 14.044 | 313 | ||||||
| 2026-02-17 | 13F | Advisor Group Holdings, Inc. | 279.015 | 230,10 | 6.214 | 222,25 | ||||
| 2026-01-21 | 13F | Prime Capital Investment Advisors, LLC | 289.332 | -0,54 | 6.443 | -3,32 | ||||
| 2025-11-13 | 13F | Cove Street Capital, LLC | 16.577 | 380 | ||||||
| 2026-02-13 | 13F | SRS Capital Advisors, Inc. | 1.260 | 28 | ||||||
| 2026-02-12 | 13F | Altiora Financial Group, LLC | 0 | -100,00 | 0 | |||||
| 2026-02-06 | 13F | Pnc Financial Services Group, Inc. | 8.100 | 97,56 | 180 | 93,55 | ||||
| 2026-02-11 | 13F | LPL Financial LLC | 725.182 | -8,93 | 16.150 | -11,47 | ||||
| 2026-02-17 | 13F | Private Advisor Group, LLC | 68.759 | -5,23 | 1.531 | -7,88 | ||||
| 2025-11-14 | 13F | Wolverine Trading, Llc | 0 | -100,00 | 0 | |||||
| 2026-01-27 | 13F | TD Waterhouse Canada Inc. | 30.400 | 32,75 | 676 | 29,50 | ||||
| 2026-02-10 | 13F | CIBC World Markets Inc. | 56.374 | 1.255 | ||||||
| 2026-02-09 | 13F | Hartland & Co., LLC | 1.705 | 38 | ||||||
| 2026-02-12 | 13F | Ankerstar Wealth, LLC | 115.326 | 2.568 | ||||||
| 2026-01-29 | 13F | Kestra Private Wealth Services, Llc | 38.161 | 5,55 | 850 | 2,54 | ||||
| 2026-01-26 | 13F | Private Trust Co Na | 1.353 | 30 | ||||||
| 2026-02-13 | 13F | Morgan Stanley | 2 | 0,00 | 0 | |||||
| 2025-11-12 | 13F | Proficio Capital Partners LLC | 0 | -100,00 | 0 | |||||
| 2026-01-23 | 13F | Fifth Third Securities, Inc. | 115.525 | 0,06 | 2.573 | -2,76 | ||||
| 2026-02-11 | 13F | Janney Montgomery Scott LLC | 10.622 | -80,51 | 0 | -100,00 | ||||
| 2025-11-12 | 13F | Compass Capital Corp /ma/ /adv | 0 | -100,00 | 0 | |||||
| 2026-01-08 | 13F | Wealth Enhancement Advisory Services, Llc | 0 | -100,00 | 0 | |||||
| 2026-02-13 | 13F | Change Path, LLC | 27.510 | -16,45 | 613 | -18,83 | ||||
| 2026-02-11 | 13F | SlateStone Wealth, LLC | 194.553 | 18,22 | 4 | 33,33 | ||||
| 2025-11-06 | 13F | Ameritas Advisory Services, LLC | 0 | -100,00 | 0 | -100,00 | ||||
| 2026-02-12 | 13F | Brinker Capital Investments, LLC | 318.520 | 1.306,21 | 7.093 | 1.269,31 | ||||
| 2026-02-12 | 13F | Jane Street Group, Llc | 204.107 | 420,99 | 4.545 | 406,69 | ||||
| 2026-02-06 | 13F | Trajan Wealth LLC | 15.678 | -12,58 | 349 | -14,88 | ||||
| 2025-10-27 | 13F | Gwn Securities Inc. | 0 | -100,00 | 0 | |||||
| 2026-02-13 | 13F | Wells Fargo & Company/mn | 1.197 | 27 | ||||||
| 2026-02-12 | 13F | Summit Financial, LLC | 138.482 | 9,95 | 3.084 | 6,86 | ||||
| 2026-02-10 | 13F | Goldman Sachs Group Inc | 0 | -100,00 | 0 | |||||
| 2026-02-06 | 13F | Prevail Innovative Wealth Advisors, Llc | 98.609 | 195,90 | 2.196 | 187,81 | ||||
| 2026-01-30 | 13F | Pekin Hardy Strauss, Inc. | 139.237 | -3,14 | 3.101 | -5,86 | ||||
| 2026-02-12 | 13F | Commonwealth Equity Services, Llc | 386.656 | 3,46 | 8.611 | 107.525,00 | ||||
| 2026-03-17 | 13F | Stance Capital Llc | 0 | -100,00 | 0 | |||||
| 2026-01-26 | 13F | AE Wealth Management LLC | 1.216.909 | 16,76 | 27.101 | 13,50 | ||||
| 2026-02-04 | 13F | Drive Wealth Management, Llc | 372.252 | 177,18 | 8.290 | 169,51 | ||||
| 2026-02-03 | 13F | NewEdge Wealth, LLC | 337.443 | -2,10 | 7.515 | -3,91 | ||||
| 2026-01-16 | 13F | BayBridge Capital Group, LLC | 10.217 | 7,07 | 228 | 4,13 | ||||
| 2026-02-03 | 13F | RFG Advisory, LLC | 69.210 | 19,22 | 1.541 | 15,95 | ||||
| 2026-01-16 | 13F | Heck Capital Advisors, LLC | 12.975 | 8,62 | 289 | 5,49 | ||||
| 2026-02-12 | 13F | Hrt Financial Lp | 17.054 | 0 | ||||||
| 2026-02-17 | 13F | Advisory Services Network, LLC | 54.974 | 1.224 | ||||||
| 2025-11-07 | 13F | Beacon Capital Management, LLC | 0 | -100,00 | 0 | |||||
| 2026-02-03 | 13F | SFG Wealth Management, LLC. | 0 | -100,00 | 0 | |||||
| 2026-01-29 | 13F | Quest 10 Wealth Builders, Inc. | 74 | -8,64 | 2 | 0,00 | ||||
| 2026-02-10 | 13F | WCG Wealth Advisors LLC | 154.152 | 274,96 | 3.433 | 264,72 | ||||
| 2026-01-23 | 13F | Farther Finance Advisors, LLC | 21 | 0 | ||||||
| 2026-01-27 | 13F | Belpointe Asset Management LLC | 10.954 | 4,67 | 244 | 1,67 | ||||
| 2026-02-13 | 13F | Kestra Advisory Services, LLC | 0 | -100,00 | 0 | |||||
| 2026-02-17 | 13F | Susquehanna International Group, Llp | 14.983 | 334 | ||||||
| 2026-01-29 | 13F | Almanack Investment Partners, LLC. | 19.174 | 76,12 | 427 | 71,49 | ||||
| 2026-02-10 | 13F | GKV Capital Management Co., Inc. | 27.705 | 617 | ||||||
| 2026-01-23 | 13F | Mid-American Wealth Advisory Group, Inc. | 210.408 | 7,72 | 4.686 | 4,72 | ||||
| 2026-02-10 | 13F/A | Northwestern Mutual Wealth Management Co | 45 | 0,00 | 1 | 0,00 | ||||
| 2026-01-14 | 13F | Worth Asset Management, LLC | 46.324 | 136,23 | 1.032 | 129,62 | ||||
| 2026-01-26 | 13F | Cwm, Llc | 5.410 | 0 | ||||||
| 2026-01-29 | 13F | UBS Group AG | 139 | 113,85 | 3 | 200,00 | ||||
| 2026-02-06 | 13F | Envestnet Portfolio Solutions, Inc. | 221.593 | 4.935 | ||||||
| 2026-02-06 | 13F | Larson Financial Group LLC | 0 | 0 | ||||||
| 2026-02-03 | 13F | Retirement Planning Group | 41.122 | 10,37 | 916 | 7,27 | ||||
| 2026-01-15 | 13F | RiverTree Advisors, LLC | 129.536 | -25,55 | 2.885 | -27,63 | ||||
| 2026-01-15 | 13F | SILVER OAK SECURITIES, Inc | 57.262 | -1,60 | 1.276 | -4,28 | ||||
| 2026-01-20 | 13F | Whalen Wealth Management Inc. | 55.956 | -45,20 | 1.246 | -46,73 | ||||
| 2026-02-09 | 13F | Kingsview Wealth Management, LLC | 107.042 | 76,20 | 2.384 | 71,32 | ||||
| 2026-01-21 | 13F | Flagship Harbor Advisors, Llc | 252.039 | 2,43 | 5.613 | -0,44 | ||||
| 2026-02-17 | 13F | Old Mission Capital Llc | 25.646 | 571 | ||||||
| 2025-11-14 | 13F | Raymond James Financial Inc | 0 | -100,00 | 0 | |||||
| 2026-02-10 | 13F | Envestnet Asset Management Inc | 1.369.552 | 718,16 | 30.500 | 695,28 | ||||
| 2025-11-12 | 13F | Napa Wealth Management | 22.418 | 2,16 | 514 | 0,39 | ||||
| 2026-02-13 | 13F | Colony Group, LLC | 187.408 | 4,97 | 4.174 | 2,03 | ||||
| 2026-02-05 | 13F | Stephens Inc /ar/ | 63.958 | -32,59 | 1.424 | -34,47 | ||||
| 2026-02-17 | 13F | Citadel Advisors Llc | 123.903 | 661,87 | 2.759 | 641,67 | ||||
| 2026-01-16 | 13F | Park Edge Advisors, LLC | 753.087 | 4,74 | 16.771 | 1,82 | ||||
| 2026-02-11 | 13F | GFS Advisors, LLC | 10.875 | 242 | ||||||
| 2026-02-05 | 13F | Soltis Investment Advisors LLC | 154.563 | 60,08 | 3.442 | 55,61 | ||||
| 2026-02-13 | 13F | Kensington Asset Management, LLC | 218.669 | 9,24 | 4.874 | 6,30 | ||||
| 2025-11-14 | 13F | Royal Bank Of Canada | 0 | -100,00 | 0 | |||||
| 2026-02-18 | 13F | GWM Advisors LLC | 228.141 | 8,69 | 5.081 | 5,66 | ||||
| 2026-01-08 | 13F | Cooper Financial Group | 30.024 | 669 | ||||||
| 2026-01-27 | 13F | Wealth Enhancement Trust Services, Inc. | 1.293 | 29 | ||||||
| 2026-02-05 | 13F | Cambridge Investment Research Advisors, Inc. | 21.786 | 76,33 | 0 | |||||
| 2026-02-13 | 13F | Mml Investors Services, Llc | 43.479 | 21,66 | 968 | 18,34 | ||||
| 2026-02-17 | 13F | Equitable Holdings, Inc. | 0 | -100,00 | 0 | |||||
| 2026-01-29 | 13F | Nbc Securities, Inc. | 1.881 | 42 | ||||||
| 2026-02-17 | 13F | Cetera Investment Advisers | 38.583 | -0,10 | 859 | -2,83 | ||||
| 2026-02-10 | 13F | Adapt Wealth Advisors, Llc | 228.349 | 84,37 | 5.085 | 79,24 | ||||
| 2026-01-14 | 13F | Centennial Wealth Advisory LLC | 90.438 | 7,88 | 2.014 | 4,90 | ||||
| 2026-02-10 | 13F | Advisor Resource Council | 27.526 | 609 | ||||||
| 2026-02-12 | 13F | Principal Securities, Inc. | 226.433 | 105,18 | 5.043 | 99,45 |