Grundlæggende statistik
| Institutionelle ejere | 100 total, 100 long only, 0 short only, 0 long/short - change of -4,72% MRQ |
| Gennemsnitlig porteføljeallokering | 0.2928 % - change of -10,40% MRQ |
| Institutionelle aktier (lange) | 7.692.445 (ex 13D/G) - change of -0,20MM shares -2,57% MRQ |
| Institutionel værdi (lang) | $ 447.112 USD ($1000) |
Institutionelt ejerskab og aktionærer
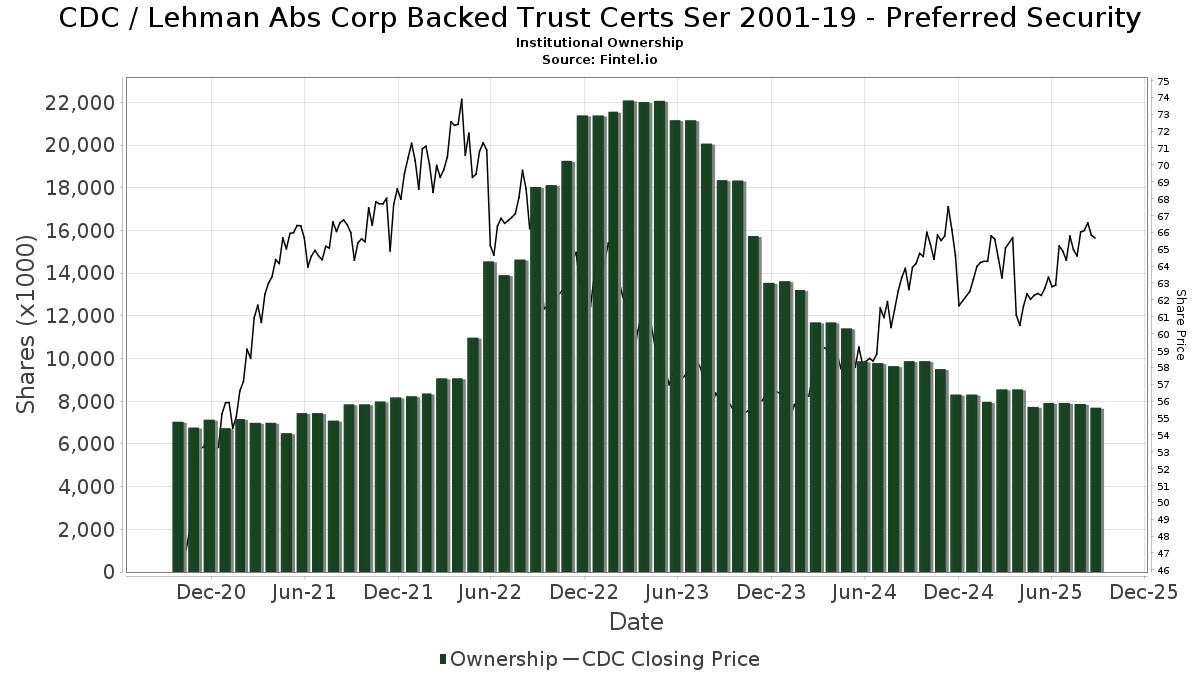
Lehman Abs Corp Backed Trust Certs Ser 2001-19 - Preferred Security (US:CDC) har 100 institutionelle ejere og aktionærer, der har indsendt 13D/G- eller 13F-formularer til Securities Exchange Commission (SEC). Disse institutioner har i alt 7,692,445 aktier. Største aktionærer omfatter Morgan Stanley, Raymond James Financial Inc, LPL Financial LLC, Bank Of America Corp /de/, Northwestern Mutual Wealth Management Co, SILVER OAK SECURITIES, Inc, Atlantic Family Wealth, Llc, Cwm, Llc, Royal Bank Of Canada, and Wells Fargo & Company/mn .
Lehman Abs Corp Backed Trust Certs Ser 2001-19 - Preferred Security (OTCPK:CDC) institutionel ejerskabsstruktur viser aktuelle positioner i virksomheden efter institutioner og fonde, samt seneste ændringer i positionsstørrelse. Større aktionærer kan omfatte individuelle investorer, investeringsforeninger, hedgefonde eller institutioner. Skema 13D angiver, at investoren besidder (eller besidder) mere end 5 % af virksomheden og har til hensigt (eller har til hensigt at) aktivt at forfølge en ændring i forretningsstrategi. Skema 13G indikerer en passiv investering på over 5%.
The share price as of September 8, 2025 is 65,32 / share. Previously, on September 9, 2024, the share price was 63,48 / share. This represents an increase of 2,91% over that period.
Fondens stemningsscore
Fund Sentiment Score (fka Ownership Accumulation Score) finder de aktier, der bliver mest købt af fonde. Det er resultatet af en sofistikeret, multi-faktor kvantitativ model, der identificerer virksomheder med de højeste niveauer af institutionel akkumulering. Scoringsmodellen bruger en kombination af den samlede stigning i oplyste ejere, ændringerne i porteføljeallokeringer i disse ejere og andre målinger. Tallet går fra 0 til 100, hvor højere tal indikerer et højere niveau af akkumulering for sine jævnaldrende, og 50 er gennemsnittet.
Opdateringsfrekvens: Dagligt
Se Ownership Explorer, som giver en liste over højest rangerende virksomheder.
Institutionel Put/Call-forhold
Ud over at indberette standardaktie- og gældsudstedelser skal institutter med mere end 100 mill. aktiver under forvaltning også oplyse deres put- og call-optionsbeholdninger. Da salgsoptioner generelt indikerer negativ stemning, og købsoptioner indikerer positiv stemning, kan vi få en fornemmelse af den overordnede institutionelle stemning ved at plotte forholdet mellem put og kald. Diagrammet til højre viser det historiske put/call-forhold for dette instrument.
Brug af Put/Call Ratio som en indikator for investorernes stemning overvinder en af de vigtigste mangler ved at bruge totalt institutionelt ejerskab, som er, at en betydelig mængde af aktiver under forvaltning investeres passivt for at spore indekser. Passivt forvaltede fonde køber typisk ikke optioner, så indikatoren for put/call-forholdet følger mere nøje følelsen af aktivt forvaltede fonde.
13F og NPORT arkivering
Detaljer om 13F-arkivering er gratis. Detaljer om NP-ansøgninger kræver et premium-medlemskab. Grønne rækker angiver nye positioner. Røde rækker angiver lukkede positioner. Klik på linket ikon for at se den fulde transaktionshistorik.
Opgrader
for at låse premium-data op og eksportere til Excel ![]() .
.
| Fil dato | Kilde | Investor | Type | Gennemsnitlig pris (Øst) |
Aktier | Δ Aktier (%) |
Rapporteret Værdi ($1000) |
Δ Værdi (%) |
Port Alloc (%) |
|
|---|---|---|---|---|---|---|---|---|---|---|
| 2025-08-05 | 13F | Tiaa Trust, National Association | 3.556 | 227 | ||||||
| 2025-08-11 | 13F | HighTower Advisors, LLC | 32.324 | 3,81 | 2.059 | 0,64 | ||||
| 2025-07-22 | 13F | Unique Wealth, Llc | 7.573 | -33,03 | 482 | -35,13 | ||||
| 2025-08-12 | 13F | Proequities, Inc. | 0 | 0 | ||||||
| 2025-08-18 | 13F | Pacific Center for Financial Services | 227 | 0,00 | 14 | 0,00 | ||||
| 2025-07-31 | 13F | Brinker Capital Investments, LLC | 0 | -100,00 | 0 | -100,00 | ||||
| 2025-09-04 | 13F/A | Advisor Group Holdings, Inc. | 75.773 | 19,99 | 4.829 | 16,31 | ||||
| 2025-08-05 | 13F | Integrity Financial Corp /WA | 3.556 | 0,03 | 227 | -3,00 | ||||
| 2025-07-25 | 13F | Atria Wealth Solutions, Inc. | 7.442 | 474 | ||||||
| 2025-08-01 | 13F | Envestnet Asset Management Inc | 167.067 | -3,36 | 10.644 | -6,31 | ||||
| 2025-08-14 | 13F | Wiley Bros.-aintree Capital, Llc | 47.032 | -0,14 | 3.018 | -1,31 | ||||
| 2025-08-15 | 13F | Equitable Holdings, Inc. | 8.364 | -0,05 | 533 | -3,10 | ||||
| 2025-08-07 | 13F | PFG Advisors | 27.684 | 7,47 | 1.764 | 4,20 | ||||
| 2025-08-14 | 13F | Ameriprise Financial Inc | 143.382 | -12,49 | 9.139 | -15,15 | ||||
| 2025-07-15 | 13F | Axis Wealth Partners, LLC | 13.063 | -0,99 | 832 | -4,04 | ||||
| 2025-08-13 | 13F | EverSource Wealth Advisors, LLC | 384 | -83,28 | 24 | -84,00 | ||||
| 2025-07-09 | 13F | Dynamic Advisor Solutions LLC | 4.211 | 4,39 | 268 | 1,13 | ||||
| 2025-07-24 | 13F | IFP Advisors, Inc | 3.647 | -4,25 | 232 | -7,20 | ||||
| 2025-04-21 | 13F | Nelson, Van Denburg & Campbell Wealth Management Group, LLC | 0 | -100,00 | 0 | |||||
| 2025-08-08 | 13F | Gts Securities Llc | 7.771 | 495 | ||||||
| 2025-07-30 | 13F | Smith Thornton Advisors LLC | 8.480 | -1,17 | 540 | -4,09 | ||||
| 2025-08-08 | 13F | Larson Financial Group LLC | 69 | 0,00 | 4 | 0,00 | ||||
| 2025-08-14 | 13F | Royal Bank Of Canada | 310.273 | 2,05 | 19.768 | -1,07 | ||||
| 2025-08-06 | 13F | Commonwealth Equity Services, Llc | 181.300 | -0,45 | 12 | 0,00 | ||||
| 2025-08-12 | 13F | Garrett Wealth Advisory Group, LLC | 121.243 | -0,58 | 7.724 | -3,62 | ||||
| 2025-04-30 | 13F | Alpha Cubed Investments, LLC | 0 | -100,00 | 0 | -100,00 | ||||
| 2025-08-12 | 13F | one8zero8, LLC | 3.300 | -35,42 | 210 | -37,31 | ||||
| 2025-07-21 | 13F | Patriot Financial Group Insurance Agency, LLC | 7.901 | 0,43 | 503 | -2,71 | ||||
| 2025-07-31 | 13F | Cambridge Investment Research Advisors, Inc. | 170.500 | -19,20 | 11 | -23,08 | ||||
| 2025-08-11 | 13F | Private Advisor Group, LLC | 93.487 | -1,72 | 5.956 | -4,72 | ||||
| 2025-08-01 | 13F | Advisory Alpha, LLC | 4.598 | -0,07 | 293 | -3,31 | ||||
| 2025-08-08 | 13F | Comprehensive Financial Planning, Inc./PA | 7.304 | 0,93 | 465 | -2,11 | ||||
| 2025-04-15 | 13F | Noble Wealth Management PBC | 980 | -3,64 | 64 | 1,59 | ||||
| 2025-07-25 | 13F | Cwm, Llc | 318.509 | 6,73 | 20 | 5,26 | ||||
| 2025-08-14 | 13F | Citadel Advisors Llc | 41.620 | 1.062,25 | 2.652 | 1.028,09 | ||||
| 2025-08-08 | 13F | Avantax Advisory Services, Inc. | 24.647 | -19,33 | 1.570 | -21,77 | ||||
| 2025-08-14 | 13F | Goldman Sachs Group Inc | 60.972 | 16,84 | 3.885 | 13,27 | ||||
| 2025-04-23 | 13F | Crewe Advisors LLC | 0 | -100,00 | 0 | |||||
| 2025-08-12 | 13F | J.w. Cole Advisors, Inc. | 20.698 | -22,30 | 1.319 | -24,69 | ||||
| 2025-08-06 | 13F | Rps Advisory Solutions Llc | 4.373 | -17,51 | 279 | -20,11 | ||||
| 2025-07-15 | 13F | Mather Group, Llc. | 37.805 | -0,84 | 2.409 | -3,87 | ||||
| 2025-07-29 | 13F | Private Trust Co Na | 2.200 | 0,00 | 140 | -2,78 | ||||
| 2025-08-01 | 13F | Bessemer Group Inc | 0 | -100,00 | 0 | |||||
| 2025-08-13 | 13F | Russell Investments Group, Ltd. | 11.040 | 703 | ||||||
| 2025-08-11 | 13F | Beta Wealth Group, Inc. | 0 | -100,00 | 0 | |||||
| 2025-07-28 | 13F | Harbour Investments, Inc. | 158 | 0,00 | 10 | 0,00 | ||||
| 2025-08-14 | 13F | Money Concepts Capital Corp | 51.550 | -7,05 | 3.284 | -9,88 | ||||
| 2025-08-14 | 13F | Comerica Bank | 3.203 | -0,25 | 204 | -3,32 | ||||
| 2025-07-21 | 13F | DHJJ Financial Advisors, Ltd. | 901 | 0,00 | 57 | -3,39 | ||||
| 2025-08-15 | 13F | Keel Point, LLC | 0 | -100,00 | 0 | |||||
| 2025-08-14 | 13F | UBS Group AG | 106.084 | -24,40 | 6.759 | -26,71 | ||||
| 2025-08-14 | 13F | Fmr Llc | 434 | -32,50 | 28 | -35,71 | ||||
| 2025-08-05 | 13F | Huntington National Bank | 72 | -4,05 | ||||||
| 2025-08-13 | 13F | Northwestern Mutual Wealth Management Co | 507.659 | -1,88 | 32.343 | -4,88 | ||||
| 2025-05-12 | 13F | Independent Advisor Alliance | 0 | -100,00 | 0 | |||||
| 2025-08-14 | 13F | Jane Street Group, Llc | 9.456 | 132,56 | 602 | 125,47 | ||||
| 2025-07-25 | 13F | NorthRock Partners, LLC | 2.023 | 0,00 | 129 | -3,03 | ||||
| 2025-08-15 | 13F | Morgan Stanley | 1.258.993 | -2,55 | 80.211 | -5,53 | ||||
| 2025-07-16 | 13F | Signaturefd, Llc | 0 | -100,00 | 0 | |||||
| 2025-08-19 | 13F | Newbridge Financial Services Group, Inc. | 200 | 0,00 | 13 | -7,69 | ||||
| 2025-08-12 | 13F | LPL Financial LLC | 599.519 | -2,90 | 38.195 | -5,87 | ||||
| 2025-08-14 | 13F | Operose Advisors LLC | 136 | 0,00 | 9 | 0,00 | ||||
| 2025-08-15 | 13F | Koesten, Hirschmann & Crabtree, INC. | 24 | 0,00 | 2 | 0,00 | ||||
| 2025-07-29 | 13F | Salus Financial Advisors, LLC | 18.037 | -0,62 | 1.149 | -3,61 | ||||
| 2025-08-12 | 13F | CIBC Private Wealth Group, LLC | 300 | 0,00 | 19 | 11,76 | ||||
| 2025-08-14 | 13F | Susquehanna International Group, Llp | 27.693 | 90,82 | 1.764 | 85,10 | ||||
| 2025-07-29 | 13F | Stratos Wealth Partners, LTD. | 11.364 | -4,98 | 724 | -7,77 | ||||
| 2025-08-14 | 13F | Wells Fargo & Company/mn | 238.715 | -0,53 | 15.209 | -3,57 | ||||
| 2025-07-23 | 13F | Prime Capital Investment Advisors, LLC | 0 | -100,00 | 0 | |||||
| 2025-08-14 | 13F | Old Mission Capital Llc | 4.634 | 295 | ||||||
| 2025-08-07 | 13F | Allworth Financial LP | 4.303 | 0,00 | 274 | 3,01 | ||||
| 2025-08-12 | 13F | Steward Partners Investment Advisory, Llc | 5.427 | -3,67 | 346 | -6,76 | ||||
| 2025-08-14 | 13F/A | Rockefeller Capital Management L.P. | 21.978 | -6,88 | 1.400 | -9,74 | ||||
| 2025-08-15 | 13F | Tower Research Capital LLC (TRC) | 17 | -29,17 | 1 | 0,00 | ||||
| 2025-08-11 | 13F | Advisor Resource Council | 0 | -100,00 | 0 | |||||
| 2025-03-17 | 13F/A | Wealth Enhancement Advisory Services, Llc | 0 | -100,00 | 0 | |||||
| 2025-08-12 | 13F | NWF Advisory Services Inc. | 0 | -100,00 | 0 | |||||
| 2025-08-06 | 13F | Vantage Financial Partners, LLC | 6.595 | -26,86 | 420 | -29,05 | ||||
| 2025-07-14 | 13F | Strategic Planning Group, Llc | 22.367 | 9,43 | 1.425 | 6,11 | ||||
| 2025-07-21 | 13F | Ameritas Advisory Services, LLC | 637 | 41 | ||||||
| 2025-08-12 | 13F | Park Square Financial Group, LLC | 34 | 0,00 | 2 | 0,00 | ||||
| 2025-08-14 | 13F | Bank Of America Corp /de/ | 577.860 | 1,03 | 36.815 | -2,06 | ||||
| 2025-08-14 | 13F | Sunbelt Securities, Inc. | 313 | 66,49 | 20 | 58,33 | ||||
| 2025-08-08 | 13F | Cetera Investment Advisers | 50.661 | 3,59 | 3.228 | 0,40 | ||||
| 2025-08-07 | 13F | Kestra Private Wealth Services, Llc | 9.124 | 0,39 | 581 | -2,68 | ||||
| 2025-08-11 | 13F | Aptus Capital Advisors, LLC | 248 | 0,81 | 16 | -6,25 | ||||
| 2025-08-15 | 13F | First Heartland Consultants, Inc. | 5.474 | 0,00 | 349 | -3,06 | ||||
| 2025-08-13 | 13F | Rsm Us Wealth Management Llc | 5.491 | 0,00 | 350 | -3,06 | ||||
| 2025-08-14 | 13F | Two Sigma Investments, Lp | 0 | -100,00 | 0 | |||||
| 2025-07-30 | 13F | Strategic Blueprint, LLC | 54.597 | 0,98 | 3.478 | -2,11 | ||||
| 2025-08-14 | 13F | Great Valley Advisor Group, Inc. | 9.758 | -18,59 | 622 | -21,09 | ||||
| 2025-07-30 | 13F/A | KPP Advisory Services LLC | 25.207 | -1,83 | 1.606 | -4,86 | ||||
| 2025-08-14 | 13F | Integrated Wealth Concepts LLC | 113.394 | -2,69 | 7.224 | -5,67 | ||||
| 2025-07-11 | 13F | Farther Finance Advisors, LLC | 413 | 0,00 | 26 | -3,70 | ||||
| 2025-08-14 | 13F | Becker Capital Management Inc | 0 | -100,00 | 0 | |||||
| 2025-07-11 | 13F | SILVER OAK SECURITIES, Inc | 499.265 | -2,64 | 31.808 | -4,46 | ||||
| 2025-08-14 | 13F | CoreCap Advisors, LLC | 6.789 | -2,05 | 433 | -5,05 | ||||
| 2025-08-14 | 13F | Mariner, LLC | 6.108 | 0,59 | 389 | -2,51 | ||||
| 2025-08-05 | 13F | GPS Wealth Strategies Group, LLC | 11.919 | -0,96 | 759 | -3,92 | ||||
| 2025-08-12 | 13F | Jpmorgan Chase & Co | 241 | -61,38 | 15 | -63,41 | ||||
| 2025-07-21 | 13F | Ameriflex Group, Inc. | 6.096 | 0,25 | 386 | -3,26 | ||||
| 2025-08-12 | 13F | Global Retirement Partners, LLC | 5.404 | -0,07 | 344 | 1,78 | ||||
| 2025-08-12 | 13F | Atlantic Family Wealth, Llc | 374.605 | 1,09 | 23.866 | -1,85 | ||||
| 2025-08-13 | 13F | StoneX Group Inc. | 12.570 | -0,56 | 801 | -3,61 | ||||
| 2025-08-13 | 13F | Keystone Financial Group | 33.906 | -3,97 | 2.160 | -6,90 | ||||
| 2025-08-14 | 13F | Hrt Financial Lp | 5.455 | 77,11 | 0 | |||||
| 2025-08-14 | 13F | GWM Advisors LLC | 41.889 | -4,96 | 2.669 | -7,87 | ||||
| 2025-07-08 | 13F | Nbc Securities, Inc. | 400 | 0,00 | 0 | |||||
| 2025-08-12 | 13F | Calton & Associates, Inc. | 6.161 | -7,17 | 393 | -10,09 | ||||
| 2025-07-24 | 13F | Capital Advisors, Ltd. LLC | 162 | 0,00 | 0 | |||||
| 2025-08-04 | 13F | Atria Investments Llc | 0 | -100,00 | 0 | |||||
| 2025-08-04 | 13F | Flagship Harbor Advisors, Llc | 8.571 | 0,86 | 546 | -2,15 | ||||
| 2025-08-14 | 13F | Stifel Financial Corp | 72.661 | 4,39 | 4.629 | 1,20 | ||||
| 2025-08-18 | 13F | Geneos Wealth Management Inc. | 2.682 | 22,30 | 171 | 18,06 | ||||
| 2025-05-12 | 13F | Claro Advisors LLC | 0 | -100,00 | 0 | -100,00 | ||||
| 2025-08-14 | 13F | Raymond James Financial Inc | 758.693 | -9,09 | 48.336 | -11,87 | ||||
| 2025-08-15 | 13F | Kestra Advisory Services, LLC | 18.321 | 15,07 | 1.167 | 11,57 | ||||
| 2025-05-15 | 13F | CAPROCK Group, Inc. | 43.162 | 0,33 | 2.837 | 5,35 | ||||
| 2025-07-18 | 13F | Truist Financial Corp | 38.049 | -1,24 | 2.424 | -4,23 |