Grundlæggende statistik
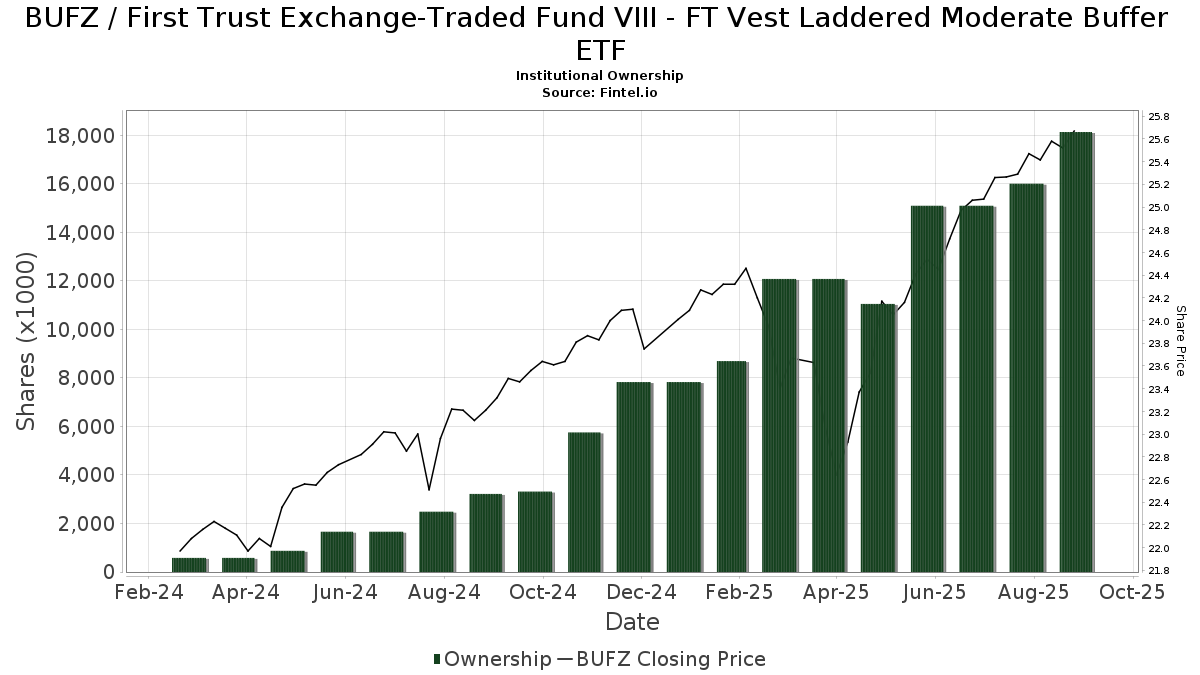
| Institutionelle ejere | 123 total, 123 long only, 0 short only, 0 long/short - change of 21,78% MRQ |
| Gennemsnitlig porteføljeallokering | 0.2372 % - change of -56,49% MRQ |
| Institutionelle aktier (lange) | 24.390.909 (ex 13D/G) - change of 2,52MM shares 11,53% MRQ |
| Institutionel værdi (lang) | $ 615.284 USD ($1000) |
Institutionelt ejerskab og aktionærer
First Trust Exchange-Traded Fund VIII - FT Vest Laddered Moderate Buffer ETF (US:BUFZ) har 123 institutionelle ejere og aktionærer, der har indsendt 13D/G- eller 13F-formularer til Securities Exchange Commission (SEC). Disse institutioner har i alt 24,390,909 aktier. Største aktionærer omfatter LPL Financial LLC, Raymond James Financial Inc, Forge Financial Services LLC, Advisor Group Holdings, Inc., Envestnet Asset Management Inc, Coppell Advisory Solutions LLC, Cwm, Llc, Cetera Investment Advisers, Jacobi Capital Management LLC, and Truist Financial Corp .
First Trust Exchange-Traded Fund VIII - FT Vest Laddered Moderate Buffer ETF (BATS:BUFZ) institutionel ejerskabsstruktur viser aktuelle positioner i virksomheden efter institutioner og fonde, samt seneste ændringer i positionsstørrelse. Større aktionærer kan omfatte individuelle investorer, investeringsforeninger, hedgefonde eller institutioner. Skema 13D angiver, at investoren besidder (eller besidder) mere end 5 % af virksomheden og har til hensigt (eller har til hensigt at) aktivt at forfølge en ændring i forretningsstrategi. Skema 13G indikerer en passiv investering på over 5%.
The share price as of April 10, 2026 is 26,84 / share. Previously, on April 14, 2025, the share price was 23,02 / share. This represents an increase of 16,59% over that period.
Fondens stemningsscore
Fund Sentiment Score (fka Ownership Accumulation Score) finder de aktier, der bliver mest købt af fonde. Det er resultatet af en sofistikeret, multi-faktor kvantitativ model, der identificerer virksomheder med de højeste niveauer af institutionel akkumulering. Scoringsmodellen bruger en kombination af den samlede stigning i oplyste ejere, ændringerne i porteføljeallokeringer i disse ejere og andre målinger. Tallet går fra 0 til 100, hvor højere tal indikerer et højere niveau af akkumulering for sine jævnaldrende, og 50 er gennemsnittet.
Opdateringsfrekvens: Dagligt
Se Ownership Explorer, som giver en liste over højest rangerende virksomheder.
AI+ Ask Fintel’s AI assistant about First Trust Exchange-Traded Fund VIII - FT Vest Laddered Moderate Buffer ETF.
Select a question to share a public post with an AI-crafted answer.
Thinking of good questions…
Institutionel Put/Call-forhold
Ud over at indberette standardaktie- og gældsudstedelser skal institutter med mere end 100 mill. aktiver under forvaltning også oplyse deres put- og call-optionsbeholdninger. Da salgsoptioner generelt indikerer negativ stemning, og købsoptioner indikerer positiv stemning, kan vi få en fornemmelse af den overordnede institutionelle stemning ved at plotte forholdet mellem put og kald. Diagrammet til højre viser det historiske put/call-forhold for dette instrument.
Brug af Put/Call Ratio som en indikator for investorernes stemning overvinder en af de vigtigste mangler ved at bruge totalt institutionelt ejerskab, som er, at en betydelig mængde af aktiver under forvaltning investeres passivt for at spore indekser. Passivt forvaltede fonde køber typisk ikke optioner, så indikatoren for put/call-forholdet følger mere nøje følelsen af aktivt forvaltede fonde.
13F og NPORT arkivering
Detaljer om 13F-arkivering er gratis. Detaljer om NP-ansøgninger kræver et premium-medlemskab. Grønne rækker angiver nye positioner. Røde rækker angiver lukkede positioner. Klik på linket ikon for at se den fulde transaktionshistorik.
Opgrader
for at låse premium-data op og eksportere til Excel ![]() .
.
| Fil dato | Kilde | Investor | Type | Gennemsnitlig pris (Øst) |
Aktier | Δ Aktier (%) |
Rapporteret Værdi ($1000) |
Δ Værdi (%) |
Port Alloc (%) |
|
|---|---|---|---|---|---|---|---|---|---|---|
| 2026-01-12 | 13F | World Equity Group, Inc. | 41.120 | -20,58 | 1.091 | -18,72 | ||||
| 2026-03-24 | 13F | Armis Advisers, LLC | 10.478 | 274 | ||||||
| 2026-02-11 | 13F | LPL Financial LLC | 3.993.430 | 26,55 | 105.946 | 29,63 | ||||
| 2026-02-17 | 13F | Signature Equity Partners, LLC | 4.310 | 114 | ||||||
| 2026-02-12 | 13F | Jane Street Group, Llc | 10.455 | 277 | ||||||
| 2026-01-30 | 13F | Sigma Planning Corp | 18.811 | 50,45 | 199 | -38,70 | ||||
| 2025-11-14 | 13F | Citadel Advisors Llc | 0 | -100,00 | 0 | |||||
| 2026-02-17 | 13F | Cetera Investment Advisers | 827.695 | 61,69 | 21.959 | 65,62 | ||||
| 2026-02-17 | 13F | Aqr Capital Management Llc | 74.942 | 0,00 | 1.988 | 2,47 | ||||
| 2026-01-21 | 13F | Ergawealth Advisors, Inc. | 64.642 | -50,06 | 1.715 | -48,87 | ||||
| 2026-02-17 | 13F | Advisory Services Network, LLC | 13.426 | 22,72 | 356 | 25,80 | ||||
| 2026-02-06 | 13F | GPS Wealth Strategies Group, LLC | 0 | -100,00 | 0 | |||||
| 2026-01-26 | 13F | AE Wealth Management LLC | 3.233 | 488,89 | 86 | 507,14 | ||||
| 2026-01-22 | 13F | Brookwood Investment Group LLC | 16.475 | 0,00 | 437 | 2,58 | ||||
| 2026-02-12 | 13F | Forge Financial Services LLC | 2.975.092 | 16,23 | 78.929 | 18,92 | ||||
| 2026-01-21 | 13F | Cambridge Advisors Inc. | 11.545 | 306 | ||||||
| 2026-01-29 | 13F | Kestra Private Wealth Services, Llc | 556.321 | 29,38 | 14.759 | 32,53 | ||||
| 2026-02-10 | 13F | Foundations Investment Advisors, LLC | 18.572 | 0,00 | 493 | 2,29 | ||||
| 2025-10-27 | 13F | Dagco, Inc. | 0 | -100,00 | 0 | -100,00 | ||||
| 2026-01-28 | 13F | Geneos Wealth Management Inc. | 528.132 | -1,84 | 14.011 | 0,55 | ||||
| 2026-02-14 | 13F | Rockefeller Capital Management L.P. | 10.000 | 0,00 | 265 | 2,32 | ||||
| 2026-02-05 | 13F | Cambridge Investment Research Advisors, Inc. | 207.597 | 14,66 | 6 | 25,00 | ||||
| 2026-02-11 | 13F | J.w. Cole Advisors, Inc. | 11.700 | 0,00 | 310 | 2,31 | ||||
| 2026-02-09 | 13F | Valtinson Bruner Financial Planning LLC | 11.805 | 313 | ||||||
| 2026-02-13 | 13F | Integrated Wealth Concepts LLC | 77.604 | -27,65 | 2.059 | -25,89 | ||||
| 2026-04-10 | 13F | Winebrenner Capital Management Llc | 8.877 | 233 | ||||||
| 2026-02-17 | 13F | United Capital Financial Advisers, Llc | 14.520 | 1,75 | 385 | 4,34 | ||||
| 2026-01-14 | 13F | Wolff Wiese Magana Llc | 47.971 | 10,87 | 1.273 | 13,57 | ||||
| 2026-01-21 | 13F | Prime Capital Investment Advisors, LLC | 28.316 | 751 | ||||||
| 2026-01-14 | 13F | Game Plan Financial Advisors, LLC | 0 | -100,00 | 0 | |||||
| 2026-04-03 | 13F | Rise Advisors, LLC | 699.118 | 6,51 | 18.408 | 5,70 | ||||
| 2026-01-26 | 13F | Independent Wealth Network Inc. | 8.412 | -5,25 | 223 | -2,62 | ||||
| 2026-01-26 | 13F | Prosperity Financial Group, Inc. | 65.940 | 11,10 | 1.749 | 13,79 | ||||
| 2026-02-17 | 13F | Private Advisor Group, LLC | 101.817 | 28,20 | 2.701 | 31,31 | ||||
| 2025-11-12 | 13F | Tounjian Advisory Partners, Llc | 0 | -100,00 | 0 | |||||
| 2026-02-13 | 13F | Kestra Advisory Services, LLC | 0 | -100,00 | 0 | |||||
| 2025-11-07 | 13F | Synovus Financial Corp | 63.393 | 4,03 | 1.642 | 8,03 | ||||
| 2026-01-23 | 13F | Diversify Advisory Services, LLC | 49.553 | 20,22 | 1.321 | 22,66 | ||||
| 2026-02-17 | 13F | Gallagher Fiduciary Advisors, LLC | 72.213 | 0,47 | 1.916 | 2,90 | ||||
| 2026-02-09 | 13F | HBK Sorce Advisory LLC | 12.603 | -0,62 | 337 | 2,75 | ||||
| 2026-02-11 | 13F | Paragon Private Wealth Management, LLC | 36.715 | -6,78 | 974 | -4,51 | ||||
| 2026-02-03 | 13F | Fsb Premier Wealth Management, Inc. | 34.763 | -0,69 | 922 | 1,77 | ||||
| 2026-02-13 | 13F | Visionary Wealth Advisors | 99.344 | 11,61 | 2.636 | 14,32 | ||||
| 2026-02-13 | 13F | Morgan Stanley | 344 | 9 | ||||||
| 2026-02-17 | 13F | Pinnacle Financial Partners, Inc. | 62.885 | 1.668 | ||||||
| 2026-01-06 | 13F | Arlington Capital Management, Inc. | 9.660 | -4,22 | 256 | -1,92 | ||||
| 2026-01-05 | 13F | GoalVest Advisory LLC | 22.282 | 20,21 | 591 | 23,13 | ||||
| 2026-02-11 | 13F | Jpmorgan Chase & Co | 20 | -99,98 | 1 | -100,00 | ||||
| 2026-02-20 | 13F | Sunbelt Securities, Inc. | 68.184 | -1,07 | 1.809 | 1,29 | ||||
| 2026-02-05 | 13F | IMG Wealth Management, Inc. | 4.500 | 0,00 | 119 | 2,59 | ||||
| 2026-02-17 | 13F | Advisor Group Holdings, Inc. | 1.750.091 | 8,47 | 46.429 | 12,61 | ||||
| 2026-01-22 | 13F | Apollon Wealth Management, LLC | 21.866 | -17,66 | 580 | -15,57 | ||||
| 2026-02-24 | 13F | MidFirst Bank | 3.698 | 98 | ||||||
| 2026-02-09 | 13F | Kingsview Wealth Management, LLC | 123.507 | 28,67 | 3.277 | 31,83 | ||||
| 2026-02-10 | 13F | Nvest Financial, LLC | 36.298 | 36,21 | 963 | 39,42 | ||||
| 2026-04-07 | 13F | Farther Finance Advisors, LLC | 3.200 | 84 | ||||||
| 2026-02-11 | 13F | Gateway Wealth Partners, LLC | 19.321 | 513 | ||||||
| 2026-02-12 | 13F | Brinker Capital Investments, LLC | 23.964 | 3,27 | 636 | 5,66 | ||||
| 2026-02-12 | 13F | Steward Partners Investment Advisory, Llc | 33.079 | 105,72 | 878 | 110,82 | ||||
| 2026-01-29 | 13F | Comprehensive Financial Consultants Institutional, Inc. | 69.722 | 17,19 | 1.850 | 20,06 | ||||
| 2026-02-09 | 13F | Kestra Investment Management, LLC | 17.855 | 2,67 | 474 | 5,11 | ||||
| 2026-02-10 | 13F | Godfrey Financial Associates, Inc. | 5.092 | 135 | ||||||
| 2026-01-26 | 13F | Cwm, Llc | 873.047 | 9,86 | 23 | 15,00 | ||||
| 2026-01-21 | 13F | Sound Income Strategies, LLC | 348 | 9 | ||||||
| 2026-01-23 | 13F | Clear Creek Financial Management, LLC | 7.700 | 204 | ||||||
| 2026-02-02 | 13F | Mcdonald Partners Llc | 11.500 | 0,00 | 305 | 2,69 | ||||
| 2026-02-12 | 13F | Richmond Investment Services, LLC | 279.588 | 11,86 | 7.417 | 14,58 | ||||
| 2026-02-10 | 13F | Envestnet Asset Management Inc | 1.235.242 | 0,30 | 32.771 | 2,74 | ||||
| 2026-02-04 | 13F | Ameritas Advisory Services, LLC | 11.860 | 315 | ||||||
| 2026-02-13 | 13F | Glen Eagle Advisors, LLC | 150.342 | 2,93 | 3.989 | 5,45 | ||||
| 2026-02-03 | 13F | Koshinski Asset Management, Inc. | 15.240 | 404 | ||||||
| 2026-02-09 | 13F | SLT Holdings LLC | 18.572 | 0,00 | 493 | 2,29 | ||||
| 2026-02-12 | 13F | Benson Wealth Management INC | 6.576 | 174 | ||||||
| 2026-04-07 | 13F | CoreCap Advisors, LLC | 10.060 | -0,18 | 264 | -1,12 | ||||
| 2026-02-05 | 13F | Tucker Asset Management Llc | 14.686 | 72,15 | 390 | 76,82 | ||||
| 2026-01-12 | 13F | DAVENPORT & Co LLC | 13.365 | 3,01 | 355 | 5,36 | ||||
| 2026-01-16 | 13F | Legacy Capital Wealth Partners, LLC | 34.871 | 46,03 | 925 | 49,68 | ||||
| 2026-01-13 | 13F | Adamsbrown Wealth Consultants Llc | 25.500 | 38,70 | 677 | 42,02 | ||||
| 2026-02-10 | 13F/A | Northwestern Mutual Wealth Management Co | 372 | 10 | ||||||
| 2026-02-11 | 13F | Capital Analysts, Inc. | 33.921 | -14,91 | 1 | -100,00 | ||||
| 2026-01-22 | 13F | Apollon Financial, LLC | 7.556 | 200 | ||||||
| 2026-02-13 | 13F | Wells Fargo & Company/mn | 3.170 | -6,35 | 84 | -3,45 | ||||
| 2026-02-10 | 13F | WCG Wealth Advisors LLC | 13.200 | 350 | ||||||
| 2026-02-17 | 13F | Susquehanna International Group, Llp | 18.834 | -57,70 | 500 | -56,72 | ||||
| 2026-02-03 | 13F | Legacy Wealth Managment, LLC/ID | 30.521 | 5,68 | 810 | 8,30 | ||||
| 2026-02-19 | 13F | Mcguire Capital Advisors Inc | 2.117 | 56 | ||||||
| 2026-01-23 | 13F | HBW Advisory Services LLC | 13.291 | 0,00 | 353 | 2,33 | ||||
| 2026-01-29 | 13F | Nbc Securities, Inc. | 7.481 | 0,00 | 198 | 2,59 | ||||
| 2026-02-02 | 13F | Truist Financial Corp | 712.423 | 30,55 | 18.901 | 33,73 | ||||
| 2026-02-17 | 13F | Equitable Holdings, Inc. | 15.512 | 14,94 | 412 | 17,77 | ||||
| 2026-02-12 | 13F | Commonwealth Equity Services, Llc | 649.275 | -24,49 | 17.225 | 78.195,45 | ||||
| 2025-11-14 | 13F | Old Mission Capital Llc | 0 | -100,00 | 0 | |||||
| 2026-02-05 | 13F | Atria Investments Llc | 63.204 | 0,49 | 1.677 | 2,89 | ||||
| 2026-01-15 | 13F | Brookstone Capital Management | 78.661 | 70,96 | 2.087 | 75,15 | ||||
| 2026-02-06 | 13F | Goldenstone Wealth Management LLC | 142.999 | 3.794 | ||||||
| 2026-02-06 | 13F | IFP Advisors, Inc | 15.345 | 71,53 | 407 | 76,19 | ||||
| 2026-02-13 | 13F | SRS Capital Advisors, Inc. | 2.101 | 56 | ||||||
| 2026-02-17 | 13F | Raymond James Financial Inc | 2.987.289 | 30,46 | 79.253 | 33,63 | ||||
| 2026-02-09 | 13F | Harbour Investments, Inc. | 128.246 | -1,06 | 3.402 | 1,34 | ||||
| 2026-01-21 | 13F | Mayfair Advisory Group, LLC | 85.607 | -2,54 | 2.273 | -0,13 | ||||
| 2026-02-13 | 13F | Mariner, LLC | 9.200 | 244 | ||||||
| 2026-02-06 | 13F | HighTower Advisors, LLC | 26.924 | 714 | ||||||
| 2026-02-17 | 13F | Royal Bank Of Canada | 3.476 | 5,85 | 92 | 8,24 | ||||
| 2026-02-10 | 13F | Goldman Sachs Group Inc | 0 | -100,00 | 0 | |||||
| 2026-04-09 | 13F | DHJJ Financial Advisors, Ltd. | 13.455 | -9,26 | 353 | -10,18 | ||||
| 2026-02-05 | 13F | Atlas Private Wealth Advisors | 83.924 | -3,47 | 2.226 | -1,11 | ||||
| 2026-02-05 | 13F | Western Wealth Management, LLC | 19.060 | 83,55 | 506 | 88,43 | ||||
| 2026-02-13 | 13F | Mml Investors Services, Llc | 157.832 | 10,60 | 4.187 | 13,28 | ||||
| 2026-02-11 | 13F | Janney Montgomery Scott LLC | 36.744 | 0,96 | 1 | |||||
| 2026-02-02 | 13F | B.O.S.S. Retirement Advisors, LLC | 0 | -100,00 | 0 | |||||
| 2026-02-02 | 13F | Bullseye Investment Management, LLC | 272.868 | 0,00 | 6.412 | 0,00 | ||||
| 2026-01-30 | 13F | Simplicity Wealth,LLC | 23.723 | 22,80 | 629 | 25,80 | ||||
| 2026-02-11 | 13F | O'shaughnessy Asset Management, Llc | 96 | 0,00 | 3 | 0,00 | ||||
| 2026-01-29 | 13F | Sanctuary Advisors, LLC | 16.839 | 0,00 | 447 | 2,29 | ||||
| 2026-02-18 | 13F | GWM Advisors LLC | 40.304 | -0,48 | 1.069 | 2,00 | ||||
| 2026-01-26 | 13F | Private Trust Co Na | 37.503 | 151,11 | 995 | 157,51 | ||||
| 2026-02-17 | 13F | Coppell Advisory Solutions LLC | 1.203.876 | -7,48 | 32.023 | -4,89 | ||||
| 2026-02-12 | 13F | StoneX Group Inc. | 93.427 | 7,54 | 2.479 | 10,13 | ||||
| 2026-02-10 | 13F | Founders Financial Securities Llc | 21.564 | 572 | ||||||
| 2026-01-20 | 13F | AdvisorNet Financial, Inc | 77.431 | 308,35 | 2.054 | 318,33 | ||||
| 2026-02-09 | 13F | Prospera Financial Services Inc | 57.208 | 21,29 | 1.518 | 24,24 | ||||
| 2026-02-17 | 13F | Ameriflex Group, Inc. | 1.750 | -50,00 | 46 | -48,89 | ||||
| 2025-11-14 | 13F | IHT Wealth Management, LLC | 0 | -100,00 | 0 | |||||
| 2026-02-06 | 13F | Global Retirement Partners, LLC | 51.566 | 6,23 | 1.368 | 8,83 | ||||
| 2026-02-17 | 13F | Wealth Watch Advisors, INC | 5.355 | -40,84 | 142 | -39,32 | ||||
| 2026-04-08 | 13F | Wealth Enhancement Advisory Services, Llc | 106.673 | -41,59 | 2.819 | -41,98 | ||||
| 2026-01-20 | 13F | Stratos Wealth Partners, LTD. | 15.878 | 80,12 | 421 | 84,65 | ||||
| 2026-02-13 | 13F | Resources Investment Advisors, LLC. | 0 | -100,00 | 0 | |||||
| 2026-01-08 | 13F | Maridea Wealth Management LLC | 13.350 | -24,84 | 354 | -23,38 | ||||
| 2026-02-13 | 13F | Change Path, LLC | 331.009 | 16,01 | 8.782 | 18,82 | ||||
| 2026-01-14 | 13F | Wealthcare Advisory Partners LLC | 9.871 | 262 | ||||||
| 2026-02-17 | 13F | Harvest Investment Services, LLC | 47.235 | 14,14 | 1.253 | 16,99 | ||||
| 2026-02-13 | 13F | Arkadios Wealth Advisors | 9.925 | 263 | ||||||
| 2025-10-27 | 13F | ZEGA Investments, LLC | 0 | -100,00 | 0 | -100,00 | ||||
| 2026-02-13 | 13F | Jacobi Capital Management LLC | 776.713 | 50,14 | 20.606 | 53,80 |