Grundlæggende statistik
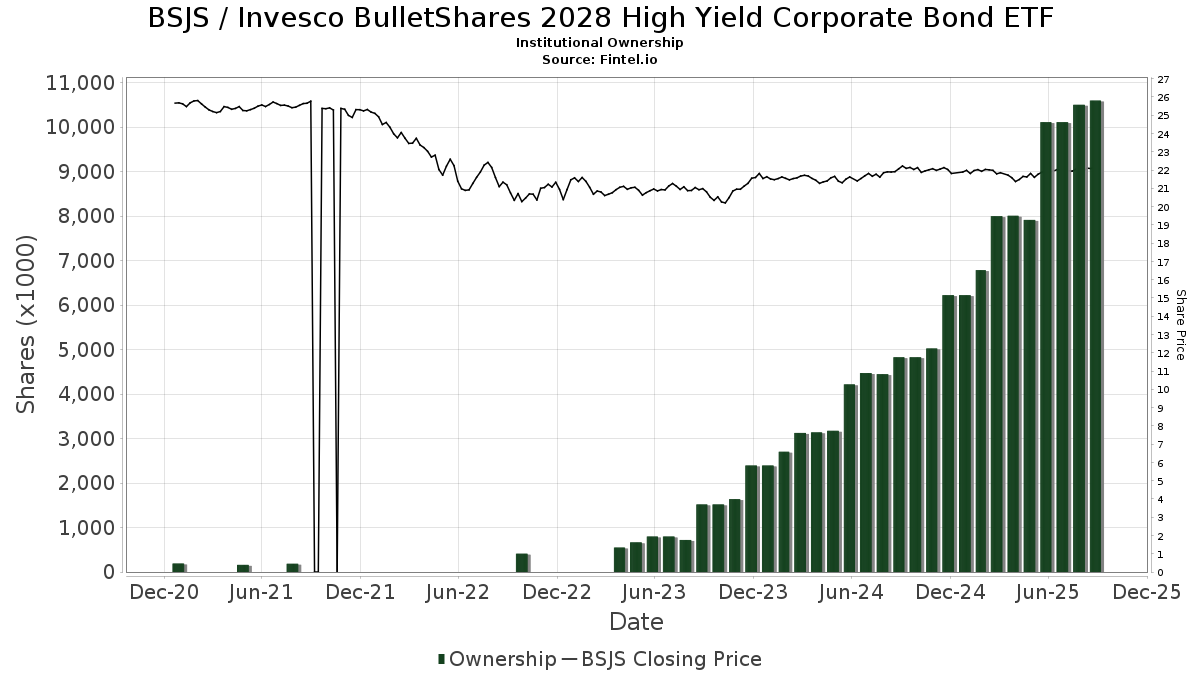
| Institutionelle ejere | 117 total, 117 long only, 0 short only, 0 long/short - change of 11,54% MRQ |
| Gennemsnitlig porteføljeallokering | 0.1732 % - change of -16,82% MRQ |
| Institutionelle aktier (lange) | 10.594.764 (ex 13D/G) - change of 0,50MM shares 4,97% MRQ |
| Institutionel værdi (lang) | $ 221.789 USD ($1000) |
Institutionelt ejerskab og aktionærer
Invesco BulletShares 2028 High Yield Corporate Bond ETF (US:BSJS) har 117 institutionelle ejere og aktionærer, der har indsendt 13D/G- eller 13F-formularer til Securities Exchange Commission (SEC). Disse institutioner har i alt 10,594,764 aktier. Største aktionærer omfatter LPL Financial LLC, Wells Fargo & Company/mn, Morgan Stanley, Envestnet Asset Management Inc, Cetera Investment Advisers, UBS Group AG, SFE Investment Counsel, Equitable Holdings, Inc., Mercer Global Advisors Inc /adv, and Steward Partners Investment Advisory, Llc .
Invesco BulletShares 2028 High Yield Corporate Bond ETF (NasdaqGM:BSJS) institutionel ejerskabsstruktur viser aktuelle positioner i virksomheden efter institutioner og fonde, samt seneste ændringer i positionsstørrelse. Større aktionærer kan omfatte individuelle investorer, investeringsforeninger, hedgefonde eller institutioner. Skema 13D angiver, at investoren besidder (eller besidder) mere end 5 % af virksomheden og har til hensigt (eller har til hensigt at) aktivt at forfølge en ændring i forretningsstrategi. Skema 13G indikerer en passiv investering på over 5%.
The share price as of September 8, 2025 is 22,14 / share. Previously, on September 9, 2024, the share price was 22,05 / share. This represents an increase of 0,43% over that period.
Fondens stemningsscore
Fund Sentiment Score (fka Ownership Accumulation Score) finder de aktier, der bliver mest købt af fonde. Det er resultatet af en sofistikeret, multi-faktor kvantitativ model, der identificerer virksomheder med de højeste niveauer af institutionel akkumulering. Scoringsmodellen bruger en kombination af den samlede stigning i oplyste ejere, ændringerne i porteføljeallokeringer i disse ejere og andre målinger. Tallet går fra 0 til 100, hvor højere tal indikerer et højere niveau af akkumulering for sine jævnaldrende, og 50 er gennemsnittet.
Opdateringsfrekvens: Dagligt
Se Ownership Explorer, som giver en liste over højest rangerende virksomheder.
Institutionel Put/Call-forhold
Ud over at indberette standardaktie- og gældsudstedelser skal institutter med mere end 100 mill. aktiver under forvaltning også oplyse deres put- og call-optionsbeholdninger. Da salgsoptioner generelt indikerer negativ stemning, og købsoptioner indikerer positiv stemning, kan vi få en fornemmelse af den overordnede institutionelle stemning ved at plotte forholdet mellem put og kald. Diagrammet til højre viser det historiske put/call-forhold for dette instrument.
Brug af Put/Call Ratio som en indikator for investorernes stemning overvinder en af de vigtigste mangler ved at bruge totalt institutionelt ejerskab, som er, at en betydelig mængde af aktiver under forvaltning investeres passivt for at spore indekser. Passivt forvaltede fonde køber typisk ikke optioner, så indikatoren for put/call-forholdet følger mere nøje følelsen af aktivt forvaltede fonde.
13F og NPORT arkivering
Detaljer om 13F-arkivering er gratis. Detaljer om NP-ansøgninger kræver et premium-medlemskab. Grønne rækker angiver nye positioner. Røde rækker angiver lukkede positioner. Klik på linket ikon for at se den fulde transaktionshistorik.
Opgrader
for at låse premium-data op og eksportere til Excel ![]() .
.
| Fil dato | Kilde | Investor | Type | Gennemsnitlig pris (Øst) |
Aktier | Δ Aktier (%) |
Rapporteret Værdi ($1000) |
Δ Værdi (%) |
Port Alloc (%) |
|
|---|---|---|---|---|---|---|---|---|---|---|
| 2025-08-01 | 13F | Envestnet Asset Management Inc | 485.597 | 4,84 | 10.707 | 6,82 | ||||
| 2025-04-17 | 13F | Rebalance, Llc | 0 | -100,00 | 0 | |||||
| 2025-08-05 | 13F | Pacific Wealth Strategies Group, Inc. | 31.328 | 172,42 | 687 | 177,02 | ||||
| 2025-04-21 | 13F | Nelson, Van Denburg & Campbell Wealth Management Group, LLC | 0 | -100,00 | 0 | |||||
| 2025-08-12 | 13F | Proequities, Inc. | 0 | 0 | ||||||
| 2025-07-29 | 13F | Tradewinds Capital Management, LLC | 1.215 | 1,76 | 27 | 4,00 | ||||
| 2025-07-28 | 13F | Harbour Investments, Inc. | 48.227 | 2,12 | 1.063 | 4,11 | ||||
| 2025-07-22 | 13F | Net Worth Advisory Group | 17.403 | 21,52 | 384 | 23,95 | ||||
| 2025-07-24 | 13F | IFP Advisors, Inc | 0 | -100,00 | 0 | |||||
| 2025-08-14 | 13F | Arete Wealth Advisors, LLC | 13.923 | 0,00 | 0 | |||||
| 2025-04-22 | 13F | Tassel Capital Management, Inc. | 0 | -100,00 | 0 | |||||
| 2025-09-09 | 13F | Cambridge Financial Group, LLC | 18.942 | 418 | ||||||
| 2025-08-13 | 13F | VestGen Advisors, LLC | 20.337 | 35,48 | 448 | 37,96 | ||||
| 2025-07-25 | 13F | We Are One Seven, LLC | 9.228 | 203 | ||||||
| 2025-08-14 | 13F | Royal Bank Of Canada | 197.775 | 3,89 | 4.361 | 5,88 | ||||
| 2025-08-18 | 13F | Geneos Wealth Management Inc. | 9.751 | 3,32 | 215 | 5,39 | ||||
| 2025-08-19 | 13F | Anchor Investment Management, LLC | 1.425 | 235,29 | 31 | 244,44 | ||||
| 2025-08-12 | 13F | BlackRock, Inc. | 0 | -100,00 | 0 | |||||
| 2025-08-14 | 13F | Integrated Wealth Concepts LLC | 32.804 | 6,52 | 723 | 8,56 | ||||
| 2025-08-08 | 13F | Cetera Investment Advisers | 423.448 | -10,59 | 9.337 | -8,89 | ||||
| 2025-08-12 | 13F | Fca Corp /tx | 49.014 | 1,90 | 1.081 | 3,85 | ||||
| 2025-08-11 | 13F | Aptus Capital Advisors, LLC | 450 | 0,00 | 10 | 0,00 | ||||
| 2025-08-07 | 13F | Private Advisory Group LLC | 22.960 | -2,71 | 506 | -0,78 | ||||
| 2025-07-29 | 13F | BXM Wealth LLC | 10.025 | 221 | ||||||
| 2025-07-11 | 13F | Farther Finance Advisors, LLC | 8.423 | 186 | ||||||
| 2025-09-04 | 13F/A | Advisor Group Holdings, Inc. | 173.216 | 45,01 | 3.820 | 47,79 | ||||
| 2025-07-31 | 13F | Glass Jacobson Investment Advisors llc | 21.559 | 89,30 | 475 | 93,09 | ||||
| 2025-07-09 | 13F | Sarver Vrooman Wealth Advisors | 1.328 | 0,00 | 29 | 3,57 | ||||
| 2025-08-08 | 13F | Foundations Investment Advisors, LLC | 27.282 | 143,52 | 602 | 148,35 | ||||
| 2025-07-22 | 13F | Siligmueller & Norvid Wealth Advisors LLC | 22.520 | -5,74 | 495 | -4,26 | ||||
| 2025-08-06 | 13F | Valtinson Bruner Financial Planning LLC | 19.471 | 0,65 | 429 | 2,63 | ||||
| 2025-08-14 | 13F | Wells Fargo & Company/mn | 747.270 | 0,25 | 16.477 | 2,15 | ||||
| 2025-08-14 | 13F | TCG Advisory Services, LLC | 299.313 | 9,51 | 6.600 | 11,58 | ||||
| 2025-08-14 | 13F | Jane Street Group, Llc | 27.714 | -42,91 | 611 | -41,81 | ||||
| 2025-08-15 | 13F | WFA of San Diego, LLC | 2.294 | 51 | ||||||
| 2025-07-30 | 13F | Brookstone Capital Management | 27.104 | -5,29 | 598 | -3,55 | ||||
| 2025-07-31 | 13F | Oppenheimer & Co Inc | 12.006 | -2,78 | 265 | -1,12 | ||||
| 2025-05-12 | 13F | Fmr Llc | 0 | -100,00 | 0 | |||||
| 2025-08-01 | 13F | Advisory Alpha, LLC | 265.313 | 18,99 | 5.850 | 21,24 | ||||
| 2025-08-12 | 13F | Horizon Financial Services, Llc | 1.582 | -8,87 | 35 | -8,11 | ||||
| 2025-07-10 | 13F | Wealth Enhancement Advisory Services, Llc | 38.571 | -19,98 | 850 | -18,50 | ||||
| 2025-08-12 | 13F | Jpmorgan Chase & Co | 169 | -99,29 | 4 | -99,42 | ||||
| 2025-08-14 | 13F | Susquehanna International Group, Llp | 25.348 | 559 | ||||||
| 2025-08-12 | 13F | J.w. Cole Advisors, Inc. | 11.412 | 0,98 | 252 | 2,87 | ||||
| 2025-07-11 | 13F | AA Financial Advisors, LLC | 15.797 | 348 | ||||||
| 2025-08-07 | 13F | Hennion & Walsh Asset Management, Inc. | 72.463 | 3,98 | 1.598 | 5,90 | ||||
| 2025-08-12 | 13F | Steward Partners Investment Advisory, Llc | 307.039 | -5,26 | 6.770 | -3,46 | ||||
| 2025-07-31 | 13F | Topsail Wealth Management, LLC | 16.060 | 21,76 | 354 | 24,21 | ||||
| 2025-08-08 | 13F | IMA Wealth, Inc. | 32.491 | 0,75 | 716 | 2,73 | ||||
| 2025-07-22 | 13F | 4Thought Financial Group Inc. | 20.899 | -3,25 | 461 | -1,50 | ||||
| 2025-08-13 | 13F | Vermillion & White Wealth Management Group, LLC | 21.269 | -27,28 | 469 | -25,95 | ||||
| 2025-07-29 | 13F | Kraft, Davis & Associates, LLC | 24.925 | 7,57 | 547 | 10,30 | ||||
| 2025-07-24 | 13F | Leo Wealth, LLC | 217.208 | 4.789 | ||||||
| 2025-08-13 | 13F | Capital Analysts, Inc. | 14.703 | 1,15 | 0 | |||||
| 2025-08-15 | 13F | Morgan Stanley | 506.340 | -15,96 | 11.165 | -14,37 | ||||
| 2025-05-12 | 13F | Independent Advisor Alliance | 0 | -100,00 | 0 | |||||
| 2025-08-01 | 13F | MorganRosel Wealth Management, LLC | 5.911 | 0,00 | 130 | 2,36 | ||||
| 2025-08-06 | 13F | Prospera Financial Services Inc | 130.790 | 2,41 | 2.884 | 4,34 | ||||
| 2025-08-06 | 13F | Commonwealth Equity Services, Llc | 95.458 | 24,76 | 2 | 100,00 | ||||
| 2025-07-21 | 13F | Empirical Financial Services, LLC d.b.a. Empirical Wealth Management | 33.891 | 2,64 | 747 | 4,62 | ||||
| 2025-08-14 | 13F | Comerica Bank | 15.260 | -2,40 | 336 | -0,59 | ||||
| 2025-08-07 | 13F | SFE Investment Counsel | 355.613 | 2,05 | 7.841 | 3,99 | ||||
| 2025-07-11 | 13F | Meriwether Wealth & Planning, LLC | 23.005 | 3,93 | 507 | 5,85 | ||||
| 2025-08-05 | 13F | Key FInancial Inc | 18.835 | 41,88 | 415 | 44,60 | ||||
| 2025-07-14 | 13F | Sound Stewardship, LLC | 53.005 | 11,47 | 1.169 | 13,51 | ||||
| 2025-07-31 | 13F | Cambridge Investment Research Advisors, Inc. | 83.117 | 4,18 | 2 | 0,00 | ||||
| 2025-08-18 | 13F | Tyler-Stone Wealth Management | 38.707 | 3,65 | 853 | 5,57 | ||||
| 2025-04-17 | 13F | Missouri Trust & Investment Co | 0 | -100,00 | 0 | |||||
| 2025-04-25 | 13F | Albion Financial Group /ut | 0 | -100,00 | 0 | |||||
| 2025-07-08 | 13F | S.E.E.D. Planning Group LLC | 74.566 | 3,15 | 1.644 | 5,12 | ||||
| 2025-07-24 | 13F | Vantage Point Financial LLC | 46.375 | -1,98 | 1.023 | -0,10 | ||||
| 2025-08-15 | 13F | Captrust Financial Advisors | 259.885 | 6,03 | 5.730 | 8,03 | ||||
| 2025-07-14 | 13F | GAMMA Investing LLC | 4.311 | -92,30 | 95 | -92,15 | ||||
| 2025-08-05 | 13F | Summit Investment Advisory Services, LLC | 112.928 | 2.490 | ||||||
| 2025-08-14 | 13F | UBS Group AG | 391.338 | -15,19 | 8.629 | -13,57 | ||||
| 2025-08-01 | 13F | GPM Growth Investors, Inc. | 210.775 | 11,94 | 4.648 | 14,06 | ||||
| 2025-07-25 | 13F | Cwm, Llc | 0 | -100,00 | 0 | |||||
| 2025-08-01 | 13F | Koss-Olinger Consulting, LLC | 15.643 | -7,43 | 345 | -6,01 | ||||
| 2025-08-04 | 13F | IFG Advisory, LLC | 16.307 | 20,79 | 360 | 22,95 | ||||
| 2025-07-29 | 13F | Alaska Permanent Capital Management | 6.933 | 152 | ||||||
| 2025-08-11 | 13F | Principal Securities, Inc. | 2.926 | 58,76 | 65 | 64,10 | ||||
| 2025-08-14 | 13F | Old Mission Capital Llc | 0 | -100,00 | 0 | |||||
| 2025-08-14 | 13F | Mercer Global Advisors Inc /adv | 341.181 | -2,78 | 7.523 | -0,93 | ||||
| 2025-08-14 | 13F | GWM Advisors LLC | 61.387 | 0,15 | 1.354 | 2,04 | ||||
| 2025-07-23 | 13F | Ironwood Financial, llc | 88.704 | 0,00 | 1.920 | 0,00 | ||||
| 2025-08-04 | 13F | AlphaStar Capital Management, LLC | 16.836 | 1,21 | 371 | 3,34 | ||||
| 2025-07-08 | 13F | Ballew Advisors, Inc | 25.316 | 0,00 | 558 | 4,10 | ||||
| 2025-08-13 | 13F | Brown Advisory Inc | 29.062 | 0,00 | 641 | 1,91 | ||||
| 2025-07-14 | 13F | AdvisorNet Financial, Inc | 28 | 0,00 | 1 | |||||
| 2025-07-29 | 13F | APCM Wealth Management for Individuals | 9.114 | 201 | ||||||
| 2025-08-12 | 13F | SRS Capital Advisors, Inc. | 471 | 10 | ||||||
| 2025-08-13 | 13F | Jones Financial Companies Lllp | 138.195 | 23,01 | 3.035 | 24,70 | ||||
| 2025-08-14 | 13F | Atomi Financial Group, Inc. | 43.273 | 13,51 | 954 | 15,78 | ||||
| 2025-08-07 | 13F | Allworth Financial LP | 300 | 7 | ||||||
| 2025-07-21 | 13F | Ashton Thomas Securities, Llc | 57.764 | 0,38 | 1.274 | 2,25 | ||||
| 2025-08-12 | 13F | Kaye Capital Management | 0 | -100,00 | 0 | |||||
| 2025-08-14 | 13F | Ameriprise Financial Inc | 209.104 | 5,52 | 4.611 | 7,66 | ||||
| 2025-07-18 | 13F | Consolidated Portfolio Review Corp | 42.491 | 8,19 | 937 | 10,25 | ||||
| 2025-08-05 | 13F | Bank Of Montreal /can/ | 0 | -100,00 | 0 | |||||
| 2025-08-14 | 13F | Stifel Financial Corp | 83.155 | 15,18 | 1.834 | 17,35 | ||||
| 2025-07-11 | 13F | Quad-Cities Investment Group, LLC | 9.161 | 202 | ||||||
| 2025-08-14 | 13F | Bank Of America Corp /de/ | 91.342 | 34,77 | 2.014 | 37,38 | ||||
| 2025-07-29 | 13F | Stephens Inc /ar/ | 16.006 | -18,49 | 353 | -16,98 | ||||
| 2025-08-06 | 13F | Summit Investment Advisors, Inc. | 121.173 | 10,19 | 2.662 | 11,99 | ||||
| 2025-08-11 | 13F | Oder Investment Management, LLC | 29.059 | 5,54 | 641 | 7,56 | ||||
| 2025-08-19 | 13F | Asset Dedication, LLC | 4.350 | 96 | ||||||
| 2025-08-11 | 13F | Cornerstone Planning Group LLC | 93 | 2 | ||||||
| 2025-08-14 | 13F | Mml Investors Services, Llc | 124.541 | 18,26 | 3 | 0,00 | ||||
| 2025-08-11 | 13F | Private Advisor Group, LLC | 21.742 | 6,55 | 479 | 8,62 | ||||
| 2025-07-31 | 13F | Strait & Sound Wealth Management LLC | 65.231 | 33,61 | 1.438 | 36,17 | ||||
| 2025-07-31 | 13F | Turning Point Benefit Group, Inc. | 33.075 | 64,45 | 729 | 72,75 | ||||
| 2025-08-08 | 13F | Larson Financial Group LLC | 7.866 | 1,69 | 173 | 3,59 | ||||
| 2025-08-11 | 13F | Shufro Rose & Co Llc | 10.000 | 0,00 | 216 | 0,00 | ||||
| 2025-07-31 | 13F | Carnegie Capital Asset Management, LLC | 14.350 | 316 | ||||||
| 2025-08-06 | 13F | Altrius Capital Management Inc | 30.679 | 50,57 | 676 | 53,64 | ||||
| 2025-07-07 | 13F | Horizons Wealth Management | 3.069 | 0,00 | 68 | 1,52 | ||||
| 2025-07-21 | 13F | Segment Wealth Management, LLC | 52.060 | -1,42 | 1.148 | 0,44 | ||||
| 2025-08-14 | 13F | Raymond James Financial Inc | 156.154 | -47,81 | 3.443 | -46,82 | ||||
| 2025-07-17 | 13F | Wolff Wiese Magana Llc | 1.025 | 48,12 | 23 | 57,14 | ||||
| 2025-05-07 | 13F | Vista Private Wealth Partners. LLC | 0 | -100,00 | 0 | |||||
| 2025-08-11 | 13F | Howard Wealth Management, Llc | 97.735 | -0,53 | 2.155 | 1,36 | ||||
| 2025-08-13 | 13F | Invesco Ltd. | 124.113 | 29,12 | 2.737 | 31,54 | ||||
| 2025-07-15 | 13F | Legacy Financial Group LLC | 27.076 | 6,28 | 597 | 8,35 | ||||
| 2025-08-12 | 13F | LPL Financial LLC | 1.382.592 | 21,46 | 30.486 | 23,76 | ||||
| 2025-04-10 | 13F | Retireful, LLC | 0 | -100,00 | 0 | |||||
| 2025-08-15 | 13F | Equitable Holdings, Inc. | 343.562 | -4,26 | 7.576 | -2,45 | ||||
| 2025-07-29 | 13F | Latitude Advisors, LLC | 10.760 | 237 | ||||||
| 2025-07-18 | 13F | Ledgewood Wealth Advisors, LLC | 17.332 | 0,57 | 382 | 2,69 | ||||
| 2025-08-13 | 13F | MONECO Advisors, LLC | 25.499 | -26,02 | 562 | -24,56 | ||||
| 2025-05-15 | 13F | Ancora Advisors, LLC | 0 | -100,00 | 0 | -100,00 | ||||
| 2025-08-14 | 13F | Guardian Wealth Advisors, Llc / Nc | 450 | 0,00 | 10 | 0,00 | ||||
| 2025-07-25 | 13F | Astoria Portfolio Advisors LLC. | 57.742 | 1,26 | 1.268 | 3,59 | ||||
| 2025-08-06 | 13F | Financial Advisory Corp /ut/ /adv | 199.085 | -1,14 | 4 | 0,00 | ||||
| 2025-07-29 | 13F | Private Trust Co Na | 941 | 159,23 | 21 | 185,71 |