Grundlæggende statistik
| Institutionelle ejere | 86 total, 86 long only, 0 short only, 0 long/short - change of 1,18% MRQ |
| Gennemsnitlig porteføljeallokering | 0.1255 % - change of -38,26% MRQ |
| Institutionelle aktier (lange) | 2.299.345 (ex 13D/G) - change of -0,46MM shares -16,71% MRQ |
| Institutionel værdi (lang) | $ 83.087 USD ($1000) |
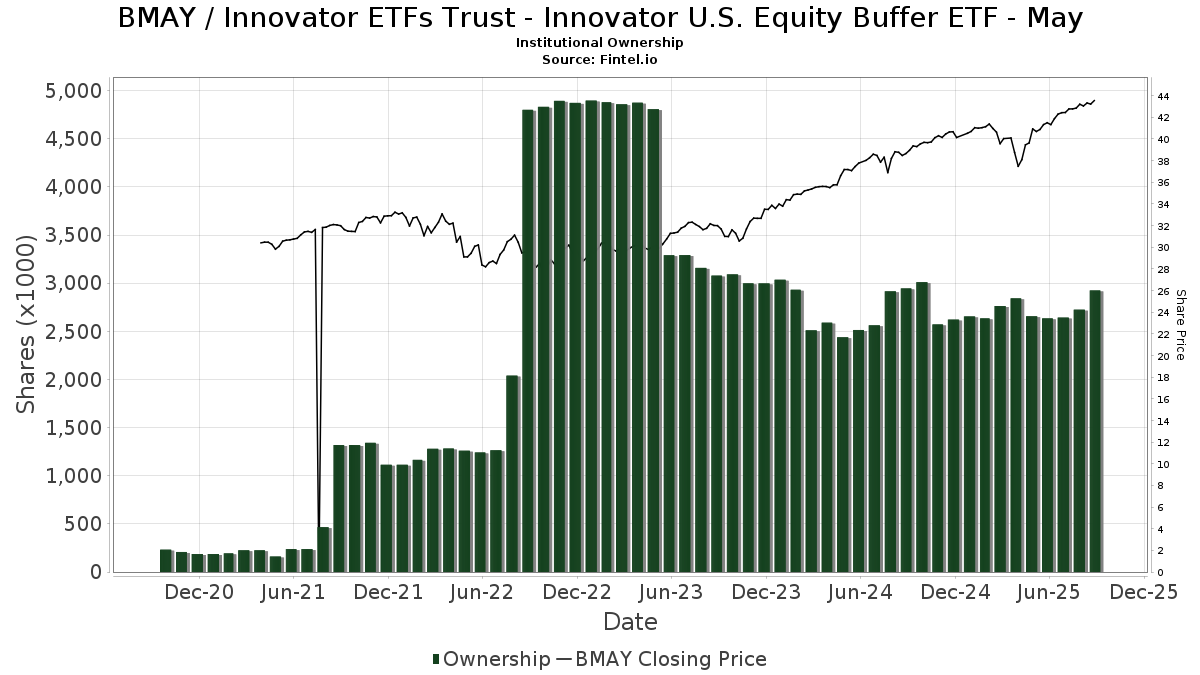
Institutionelt ejerskab og aktionærer
Innovator ETFs Trust - Innovator U.S. Equity Buffer ETF - May (US:BMAY) har 86 institutionelle ejere og aktionærer, der har indsendt 13D/G- eller 13F-formularer til Securities Exchange Commission (SEC). Disse institutioner har i alt 2,299,345 aktier. Største aktionærer omfatter Penserra Capital Management LLC, Raymond James Financial Inc, Valtinson Bruner Financial Planning LLC, Advisor Group Holdings, Inc., Commonwealth Equity Services, Llc, Cerity Partners LLC, Blue Bell Private Wealth Management, Llc, Envestnet Asset Management Inc, Mml Investors Services, Llc, and Focus Financial Network, Inc. .
Innovator ETFs Trust - Innovator U.S. Equity Buffer ETF - May (BATS:BMAY) institutionel ejerskabsstruktur viser aktuelle positioner i virksomheden efter institutioner og fonde, samt seneste ændringer i positionsstørrelse. Større aktionærer kan omfatte individuelle investorer, investeringsforeninger, hedgefonde eller institutioner. Skema 13D angiver, at investoren besidder (eller besidder) mere end 5 % af virksomheden og har til hensigt (eller har til hensigt at) aktivt at forfølge en ændring i forretningsstrategi. Skema 13G indikerer en passiv investering på over 5%.
The share price as of March 27, 2026 is 44,10 / share. Previously, on March 28, 2025, the share price was 39,46 / share. This represents an increase of 11,77% over that period.
Fondens stemningsscore
Fund Sentiment Score (fka Ownership Accumulation Score) finder de aktier, der bliver mest købt af fonde. Det er resultatet af en sofistikeret, multi-faktor kvantitativ model, der identificerer virksomheder med de højeste niveauer af institutionel akkumulering. Scoringsmodellen bruger en kombination af den samlede stigning i oplyste ejere, ændringerne i porteføljeallokeringer i disse ejere og andre målinger. Tallet går fra 0 til 100, hvor højere tal indikerer et højere niveau af akkumulering for sine jævnaldrende, og 50 er gennemsnittet.
Opdateringsfrekvens: Dagligt
Se Ownership Explorer, som giver en liste over højest rangerende virksomheder.
AI+ Ask Fintel’s AI assistant about Innovator ETFs Trust - Innovator U.S. Equity Buffer ETF - May.
Select a question to share a public post with an AI-crafted answer.
Thinking of good questions…
Institutionel Put/Call-forhold
Ud over at indberette standardaktie- og gældsudstedelser skal institutter med mere end 100 mill. aktiver under forvaltning også oplyse deres put- og call-optionsbeholdninger. Da salgsoptioner generelt indikerer negativ stemning, og købsoptioner indikerer positiv stemning, kan vi få en fornemmelse af den overordnede institutionelle stemning ved at plotte forholdet mellem put og kald. Diagrammet til højre viser det historiske put/call-forhold for dette instrument.
Brug af Put/Call Ratio som en indikator for investorernes stemning overvinder en af de vigtigste mangler ved at bruge totalt institutionelt ejerskab, som er, at en betydelig mængde af aktiver under forvaltning investeres passivt for at spore indekser. Passivt forvaltede fonde køber typisk ikke optioner, så indikatoren for put/call-forholdet følger mere nøje følelsen af aktivt forvaltede fonde.
13F og NPORT arkivering
Detaljer om 13F-arkivering er gratis. Detaljer om NP-ansøgninger kræver et premium-medlemskab. Grønne rækker angiver nye positioner. Røde rækker angiver lukkede positioner. Klik på linket ikon for at se den fulde transaktionshistorik.
Opgrader
for at låse premium-data op og eksportere til Excel ![]() .
.
| Fil dato | Kilde | Investor | Type | Gennemsnitlig pris (Øst) |
Aktier | Δ Aktier (%) |
Rapporteret Værdi ($1000) |
Δ Værdi (%) |
Port Alloc (%) |
|
|---|---|---|---|---|---|---|---|---|---|---|
| 2026-02-13 | 13F | Integrity Financial Corp /WA | 1.629 | 0,00 | 73 | 2,82 | ||||
| 2026-02-13 | 13F | Morgan Stanley | 1.500 | 100,00 | 67 | 109,38 | ||||
| 2026-03-12 | 13F | Nalls Sherbakoff Group, Llc | 1.600 | 72 | ||||||
| 2026-01-23 | 13F | DHJJ Financial Advisors, Ltd. | 20.632 | -1,67 | 925 | 0,54 | ||||
| 2026-02-10 | 13F | COFG Advisors, LLC | 12.954 | 581 | ||||||
| 2026-02-17 | 13F | Old Mission Capital Llc | 0 | -100,00 | 0 | |||||
| 2026-02-02 | 13F | Chapman Financial Group, Llc | 800 | 0,00 | 36 | 0,00 | ||||
| 2026-02-05 | 13F | Allworth Financial LP | 7.580 | 0,00 | 340 | 2,11 | ||||
| 2026-01-15 | 13F | My Personal CFO, LLC | 13.000 | 583 | ||||||
| 2026-02-17 | 13F | First Commonwealth Financial Corp /pa/ | 9.898 | -27,48 | 444 | -25,92 | ||||
| 2026-01-21 | 13F | Bluesphere Advisors, LLC | 6.796 | 0,00 | 305 | 2,36 | ||||
| 2026-02-17 | 13F | Raymond James Financial Inc | 209.100 | 12,29 | 9.371 | 14,84 | ||||
| 2026-02-11 | 13F | Outlook Wealth Advisors, LLC | 18.300 | 0,00 | 820 | 2,37 | ||||
| 2026-02-17 | 13F | Blair William & Co/il | 3.708 | 0,00 | 166 | 2,47 | ||||
| 2026-02-11 | 13F | Cerity Partners LLC | 97.231 | 2,26 | 4.357 | 4,58 | ||||
| 2025-11-12 | 13F | Bellwether Advisors, LLC | 0 | -100,00 | 0 | |||||
| 2026-02-12 | 13F | TopTier Wealth Management, LLC | 36.872 | 1.652 | ||||||
| 2026-02-18 | 13F | Beacon Pointe Advisors, LLC | 14.082 | -18,23 | 631 | -16,31 | ||||
| 2026-01-07 | 13F | Fragasso Group Inc. | 23.033 | -0,68 | 1.032 | 1,47 | ||||
| 2026-02-09 | 13F | Blue Bell Private Wealth Management, Llc | 69.067 | -1,35 | 3.095 | 0,88 | ||||
| 2026-02-10 | 13F | Clear Point Advisors Inc. | 6.154 | -6,10 | 276 | -4,18 | ||||
| 2026-02-17 | 13F | Advisor Group Holdings, Inc. | 117.124 | -6,16 | 5.249 | -3,53 | ||||
| 2026-02-13 | 13F | Gts Securities Llc | 0 | -100,00 | 0 | |||||
| 2026-01-23 | 13F | Pinnacle Wealth Management Group, Inc. | 0 | -100,00 | 0 | |||||
| 2026-02-03 | 13F | Allegiance Financial Group Advisory Services LLC | 13.114 | 0,00 | 588 | 2,26 | ||||
| 2026-02-04 | 13F | Ballast Rock Private Wealth LLC | 4.786 | 214 | ||||||
| 2026-01-12 | 13F | Central Valley Advisors, Llc | 5.670 | 0,00 | 254 | 2,42 | ||||
| 2026-01-13 | 13F | CoreCap Advisors, LLC | 8.238 | -3,15 | 369 | -0,81 | ||||
| 2026-01-14 | 13F | Spire Wealth Management | 32.478 | 0,51 | 1.456 | 2,83 | ||||
| 2026-01-26 | 13F | BCS Wealth Management | 8.982 | 72,47 | 403 | 76,32 | ||||
| 2026-02-02 | 13F | Bullseye Investment Management, LLC | 7.482 | 0,00 | 297 | 0,00 | ||||
| 2026-02-10 | 13F | Weaver Consulting Group | 14.310 | 0,00 | 641 | 2,23 | ||||
| 2026-01-14 | 13F | Lantz Financial LLC | 19.036 | 0,00 | 853 | 2,28 | ||||
| 2026-02-03 | 13F | Retirement Planning Group | 12.415 | 0,00 | 556 | 2,21 | ||||
| 2026-01-20 | 13F | Secure Asset Management, LLC | 8.083 | -14,13 | 362 | -12,35 | ||||
| 2026-02-12 | 13F | Commonwealth Equity Services, Llc | 109.687 | -23,40 | 4.916 | 81.816,67 | ||||
| 2026-01-20 | 13F | Stratos Wealth Advisors, LLC | 9.500 | -3,31 | 426 | -1,16 | ||||
| 2026-02-09 | 13F | Keating Financial Advisory Services, Inc. | 938 | 42 | ||||||
| 2026-02-09 | 13F | Harbour Investments, Inc. | 824 | -80,81 | 37 | -80,85 | ||||
| 2026-02-13 | 13F | Mml Investors Services, Llc | 44.519 | 4,31 | 1.995 | 6,68 | ||||
| 2026-02-13 | 13F | WPWealth LLP | 16.782 | -18,92 | 752 | -17,00 | ||||
| 2026-01-12 | 13F | Focus Financial Network, Inc. | 43.858 | -0,30 | 1.966 | 1,97 | ||||
| 2026-02-10 | 13F | Envestnet Asset Management Inc | 60.298 | -12,82 | 2.702 | -10,83 | ||||
| 2026-02-11 | 13F | LPL Financial LLC | 20.651 | -7,49 | 925 | -5,42 | ||||
| 2026-02-17 | 13F | Snowden Capital Advisors LLC | 10.524 | 0,00 | 472 | 2,17 | ||||
| 2026-02-12 | 13F | Principal Securities, Inc. | 5.667 | 0,00 | 254 | 2,02 | ||||
| 2026-02-13 | 13F | Change Path, LLC | 7.745 | 0,17 | 347 | 2,66 | ||||
| 2026-02-06 | 13F | Integral Investment Advisors, Inc. | 37.478 | 0,00 | 1.680 | 2,25 | ||||
| 2026-02-11 | 13F | Jpmorgan Chase & Co | 188 | 0,00 | 8 | 0,00 | ||||
| 2026-02-13 | 13F | Arete Wealth Advisors, LLC | 11.953 | -0,94 | 1 | |||||
| 2026-02-17 | 13F | Cetera Investment Advisers | 39.835 | -7,73 | 1.785 | -5,61 | ||||
| 2026-02-13 | 13F | Kestra Advisory Services, LLC | 37.148 | 0,54 | 1.665 | 2,78 | ||||
| 2025-11-10 | 13F | Lion Street Advisors, LLC | 0 | -100,00 | 0 | -100,00 | ||||
| 2026-01-23 | 13F | Retirement Guys Formula Llc | 0 | -100,00 | 0 | |||||
| 2026-02-05 | 13F | Cambridge Investment Research Advisors, Inc. | 11.423 | -19,69 | 1 | |||||
| 2025-11-14 | 13F | Wood Tarver Financial Group, LLC | 0 | -100,00 | 0 | |||||
| 2026-02-13 | 13F | SRS Capital Advisors, Inc. | 11.236 | 504 | ||||||
| 2026-01-23 | 13F | Farther Finance Advisors, LLC | 0 | -100,00 | 0 | |||||
| 2026-02-10 | 13F | Gill Capital Partners, Llc | 14.835 | 0,00 | 665 | 2,15 | ||||
| 2026-01-27 | 13F | Berkshire Money Management, Inc. | 6.072 | 272 | ||||||
| 2026-01-30 | 13F | Sigma Planning Corp | 10.770 | -2,80 | 483 | -0,62 | ||||
| 2026-02-02 | 13F | FSA Advisors, Inc. | 5.437 | -0,60 | 244 | 1,67 | ||||
| 2026-02-13 | 13F | Barclays Plc | 633 | -84,82 | 28 | -84,62 | ||||
| 2026-01-26 | 13F | Phillips Financial Management, Llc | 6.123 | 0,00 | 274 | 2,24 | ||||
| 2026-01-15 | 13F | Maltin Wealth Management, Inc. | 26.185 | 0,00 | 1.173 | 2,27 | ||||
| 2026-02-06 | 13F | Creative Financial Designs Inc /adv | 700 | 0,00 | 31 | 3,33 | ||||
| 2026-02-13 | 13F | Beck Capital Management, Llc | 41.422 | -2,27 | 1.856 | -0,05 | ||||
| 2026-01-13 | 13F | Kathmere Capital Management, LLC | 7.007 | -0,98 | 314 | 1,29 | ||||
| 2026-01-20 | 13F | Signaturefd, Llc | 27.313 | 0,00 | 1.224 | 2,34 | ||||
| 2026-01-28 | 13F | Chicago Partners Investment Group LLC | 31.264 | -4,58 | 1.410 | -2,69 | ||||
| 2026-02-17 | 13F | SageView Advisory Group, LLC | 250 | -99,62 | 11 | -83,08 | ||||
| 2026-02-10 | 13F | Foundations Investment Advisors, LLC | 5.002 | -9,69 | 224 | -7,44 | ||||
| 2026-02-17 | 13F | Citadel Advisors Llc | 0 | -100,00 | 0 | |||||
| 2026-02-11 | 13F | Gilpin Wealth Management, Llc | 500 | 22 | ||||||
| 2026-02-17 | 13F | Royal Bank Of Canada | 750 | 0,00 | 34 | 3,03 | ||||
| 2026-02-09 | 13F | Annis Gardner Whiting Capital Advisors, LLC | 2.265 | 0,00 | 102 | 2,02 | ||||
| 2026-01-15 | 13F | Brookstone Capital Management | 13.844 | -1,47 | 620 | 0,81 | ||||
| 2026-01-29 | 13F | UBS Group AG | 182 | -64,80 | 8 | -63,64 | ||||
| 2026-02-03 | 13F | Orion Capital Management LLC | 8.700 | 0,00 | 390 | 2,10 | ||||
| 2026-02-06 | 13F | HighTower Advisors, LLC | 31.888 | 0,00 | 1.429 | 2,29 | ||||
| 2026-02-09 | 13F | Integrity Alliance, Llc. | 27.647 | 1.239 | ||||||
| 2026-02-17 | 13F | Susquehanna International Group, Llp | 0 | -100,00 | 0 | |||||
| 2025-11-14 | 13F | Wolverine Trading, Llc | 0 | -100,00 | 0 | -100,00 | ||||
| 2026-02-09 | 13F | Optimist Retirement Group LLC | 15.054 | -4,90 | 675 | -2,74 | ||||
| 2026-02-11 | 13F | Buckingham Strategic Partners | 0 | -100,00 | 0 | |||||
| 2026-02-09 | 13F | Collaborative Wealth Managment Inc. | 40.505 | 0,00 | 1.815 | 2,31 | ||||
| 2026-02-12 | 13F | Penserra Capital Management LLC | 409.908 | -1,04 | 18 | 0,00 | ||||
| 2026-02-12 | 13F | Steward Partners Investment Advisory, Llc | 2.101 | 0,00 | 94 | 2,17 | ||||
| 2026-02-13 | 13F | Pinnacle Wealth Planning Services, Inc. | 112 | 5 | ||||||
| 2026-02-17 | 13F | Advisory Services Network, LLC | 0 | -100,00 | 0 | |||||
| 2025-11-14 | 13F | Northwestern Mutual Wealth Management Co | 0 | -100,00 | 0 | |||||
| 2026-01-26 | 13F | AE Wealth Management LLC | 12.719 | -1,21 | 570 | 1,06 | ||||
| 2026-01-20 | 13F | Global Trust Asset Management, LLC | 0 | -100,00 | 0 | -100,00 | ||||
| 2026-02-06 | 13F | IFP Advisors, Inc | 2.015 | 0,00 | 90 | 2,27 | ||||
| 2026-02-02 | 13F | Truist Financial Corp | 19.543 | -2,84 | 876 | -0,68 | ||||
| 2026-02-05 | 13F | Soltis Investment Advisors LLC | 6.557 | 0,00 | 294 | 2,09 | ||||
| 2026-02-13 | 13F | Financial Network Wealth Advisors LLC | 272 | 0,00 | 12 | 9,09 | ||||
| 2026-02-09 | 13F | Valtinson Bruner Financial Planning LLC | 200.763 | -4,87 | 8.997 | -2,70 | ||||
| 2026-01-26 | 13F | Merit Financial Group, LLC | 7.276 | 326 | ||||||
| 2026-02-11 | 13F | Janney Montgomery Scott LLC | 11.088 | 6,71 | 0 | |||||
| 2026-01-22 | 13F | Weaver Capital Management LLC | 16.735 | 0,00 | 750 | 2,18 |