Grundlæggende statistik
| Institutionelle aktier (lange) | 4.563.602 - 11,38% (ex 13D/G) - change of 0,93MM shares 25,57% MRQ |
| Institutionel værdi (lang) | $ 10.866 USD ($1000) |
Institutionelt ejerskab og aktionærer
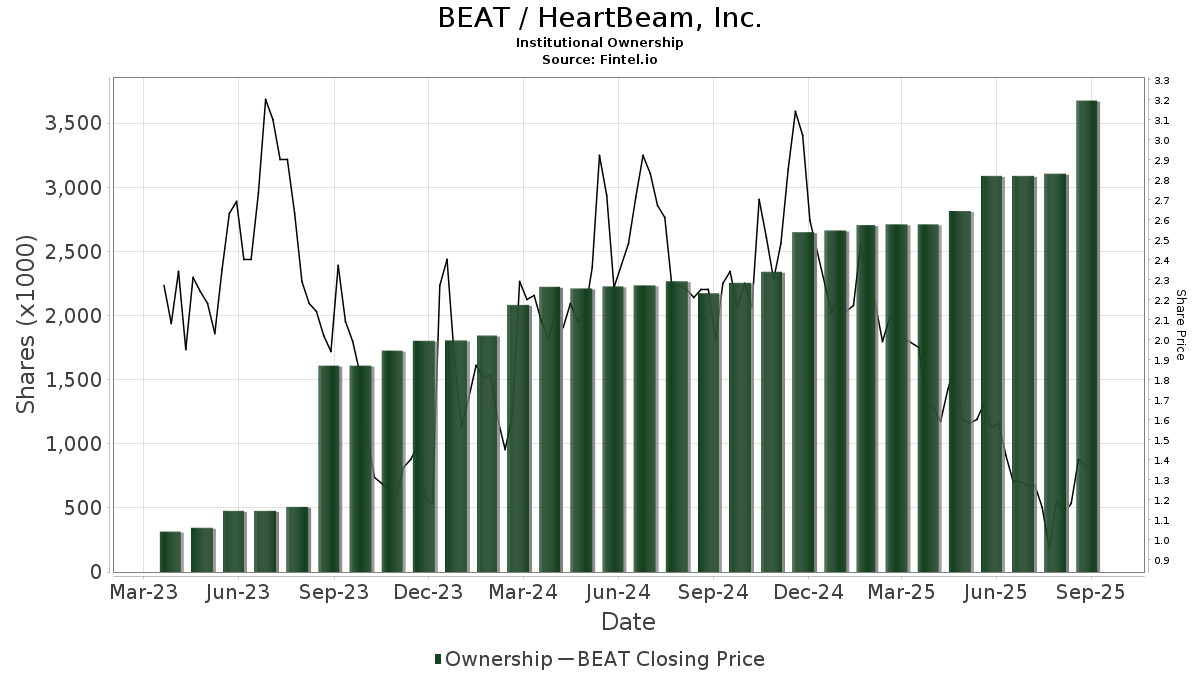
HeartBeam, Inc. (US:BEAT) har 42 institutionelle ejere og aktionærer, der har indsendt 13D/G- eller 13F-formularer til Securities Exchange Commission (SEC). Disse institutioner har i alt 4,563,602 aktier. Største aktionærer omfatter Vanguard Group Inc, BlackRock, Inc., UBS Group AG, Smith, Salley & Associates, Geode Capital Management, Llc, Ritholtz Wealth Management, Kestra Private Wealth Services, Llc, O'shaughnessy Asset Management, Llc, State Street Corp, and Raymond James Financial Inc .
HeartBeam, Inc. (NasdaqCM:BEAT) institutionel ejerskabsstruktur viser aktuelle positioner i virksomheden efter institutioner og fonde, samt seneste ændringer i positionsstørrelse. Større aktionærer kan omfatte individuelle investorer, investeringsforeninger, hedgefonde eller institutioner. Skema 13D angiver, at investoren besidder (eller besidder) mere end 5 % af virksomheden og har til hensigt (eller har til hensigt at) aktivt at forfølge en ændring i forretningsstrategi. Skema 13G indikerer en passiv investering på over 5%.
The share price as of March 12, 2026 is 1,47 / share. Previously, on March 13, 2025, the share price was 2,02 / share. This represents a decline of 27,23% over that period.
Fondens stemningsscore
Fund Sentiment Score (fka Ownership Accumulation Score) finder de aktier, der bliver mest købt af fonde. Det er resultatet af en sofistikeret, multi-faktor kvantitativ model, der identificerer virksomheder med de højeste niveauer af institutionel akkumulering. Scoringsmodellen bruger en kombination af den samlede stigning i oplyste ejere, ændringerne i porteføljeallokeringer i disse ejere og andre målinger. Tallet går fra 0 til 100, hvor højere tal indikerer et højere niveau af akkumulering for sine jævnaldrende, og 50 er gennemsnittet.
Opdateringsfrekvens: Dagligt
Se Ownership Explorer, som giver en liste over højest rangerende virksomheder.
AI+ Ask Fintel’s AI assistant about HeartBeam, Inc..
Select a question to share a public post with an AI-crafted answer.
Thinking of good questions…
Institutionel Put/Call-forhold
Ud over at indberette standardaktie- og gældsudstedelser skal institutter med mere end 100 mill. aktiver under forvaltning også oplyse deres put- og call-optionsbeholdninger. Da salgsoptioner generelt indikerer negativ stemning, og købsoptioner indikerer positiv stemning, kan vi få en fornemmelse af den overordnede institutionelle stemning ved at plotte forholdet mellem put og kald. Diagrammet til højre viser det historiske put/call-forhold for dette instrument.
Brug af Put/Call Ratio som en indikator for investorernes stemning overvinder en af de vigtigste mangler ved at bruge totalt institutionelt ejerskab, som er, at en betydelig mængde af aktiver under forvaltning investeres passivt for at spore indekser. Passivt forvaltede fonde køber typisk ikke optioner, så indikatoren for put/call-forholdet følger mere nøje følelsen af aktivt forvaltede fonde.
13F og NPORT arkivering
Detaljer om 13F-arkivering er gratis. Detaljer om NP-ansøgninger kræver et premium-medlemskab. Grønne rækker angiver nye positioner. Røde rækker angiver lukkede positioner. Klik på linket ikon for at se den fulde transaktionshistorik.
Opgrader
for at låse premium-data op og eksportere til Excel ![]() .
.
| Fil dato | Kilde | Investor | Type | Gennemsnitlig pris (Øst) |
Aktier | Δ Aktier (%) |
Rapporteret Værdi ($1000) |
Δ Værdi (%) |
Port Alloc (%) |
|
|---|---|---|---|---|---|---|---|---|---|---|
| 2026-02-17 | 13F | Bank Of America Corp /de/ | 57 | 83,87 | 0 | |||||
| 2025-11-14 | 13F | Beacon Pointe Advisors, LLC | 0 | -100,00 | 0 | |||||
| 2026-01-12 | 13F | Abound Wealth Management | 1.600 | 4 | ||||||
| 2026-02-12 | 13F | Steward Partners Investment Advisory, Llc | 11.000 | 0,00 | 26 | 44,44 | ||||
| 2025-11-14 | 13F | Susquehanna International Group, Llp | 0 | -100,00 | 0 | |||||
| 2025-11-14 | 13F | Squarepoint Ops LLC | 0 | -100,00 | 0 | -100,00 | ||||
| 2026-02-11 | 13F | O'shaughnessy Asset Management, Llc | 139.182 | 0,00 | 334 | 45,85 | ||||
| 2026-01-23 | 13F | Ritholtz Wealth Management | 208.191 | 49,58 | 500 | 117,90 | ||||
| 2026-02-13 | 13F | Barclays Plc | 0 | -100,00 | 0 | |||||
| 2026-02-04 | 13F | D'Orazio & Associates, Inc. | 48.987 | 48,50 | 118 | 116,67 | ||||
| 2026-02-13 | 13F | Advisory Research Inc | 50.000 | 0,00 | 120 | 46,34 | ||||
| 2026-01-26 | 13F | SMART Wealth LLC | 0 | -100,00 | 0 | |||||
| 2026-02-05 | 13F | Bessemer Group Inc | 0 | -100,00 | 0 | |||||
| 2026-02-17 | 13F | Tower Research Capital LLC (TRC) | 0 | -100,00 | 0 | -100,00 | ||||
| 2026-02-02 | 13F | Truist Financial Corp | 15.000 | 36 | ||||||
| 2026-01-29 | 13F | Kestra Private Wealth Services, Llc | 175.189 | -0,45 | 420 | 44,83 | ||||
| 2026-02-17 | 13F | National Asset Management, Inc. | 15.000 | 36 | ||||||
| 2026-02-09 | 13F | Geode Capital Management, Llc | 305.740 | 4,14 | 734 | 51,45 | ||||
| 2026-01-30 | 13F | Activest Wealth Management | 25.500 | 61 | ||||||
| 2026-01-28 | 13F | Clarity Financial LLC | 10.504 | 25 | ||||||
| 2026-01-26 | 13F | Spectrum Asset Management, Inc. (NB/CA) | 94.400 | 26,88 | 227 | 85,25 | ||||
| 2026-02-17 | 13F | XTX Topco Ltd | 0 | -100,00 | 0 | -100,00 | ||||
| 2026-02-12 | 13F | CIBC Private Wealth Group, LLC | 10.631 | 26 | ||||||
| 2025-09-24 | NP | SWTSX - Schwab Total Stock Market Index Fund This fund is a listed as child fund of Charles Schwab Investment Management Inc and if that institution has disclosed ownership in this security, then these positions will not be double counted when calculating total shares and total value | 14.543 | 0,00 | 16 | -36,00 | ||||
| 2026-02-11 | 13F | LPL Financial LLC | 0 | -100,00 | 0 | -100,00 | ||||
| 2026-02-18 | 13F | GWM Advisors LLC | 1.000 | 0,00 | 2 | 100,00 | ||||
| 2026-02-09 | 13F | Harbour Investments, Inc. | 9.250 | 0,00 | 22 | 46,67 | ||||
| 2026-02-13 | 13F | Stifel Financial Corp | 51.000 | -49,00 | 122 | -26,06 | ||||
| 2026-02-10 | 13F | Goldman Sachs Group Inc | 0 | -100,00 | 0 | -100,00 | ||||
| 2026-02-13 | 13F | Citigroup Inc | 1 | -99,97 | 0 | -100,00 | ||||
| 2026-01-16 | 13F | Ronald Blue Trust, Inc. | 1.928 | 0,00 | 5 | 33,33 | ||||
| 2026-02-11 | 13F | Jpmorgan Chase & Co | 500 | 0,00 | 1 | |||||
| 2026-01-30 | 13F | Sigma Planning Corp | 61.650 | 45,40 | 148 | 113,04 | ||||
| 2026-01-29 | 13F | UBS Group AG | 453.719 | 135,63 | 1.089 | 243,22 | ||||
| 2026-02-05 | 13F | bLong Financial, LLC | 0 | -100,00 | 0 | |||||
| 2026-02-13 | 13F | Charles Schwab Investment Management Inc | 0 | -100,00 | 0 | |||||
| 2026-02-23 | 13F | Virtu Financial LLC | 29.322 | 0 | ||||||
| 2026-01-29 | 13F | Vanguard Group Inc | 1.084.210 | -3,06 | 2.602 | 41,03 | ||||
| 2026-02-12 | 13F | Insigneo Advisory Services, Llc | 30.645 | 74 | ||||||
| 2026-02-04 | 13F | Cannon Financial Strategists, Inc. | 72.788 | -7,56 | 175 | 34,88 | ||||
| 2026-01-27 | 13F | Smith, Salley & Associates | 367.647 | 0,00 | 882 | 45,54 | ||||
| 2025-11-07 | 13F/A | Merit Financial Group, LLC | 0 | -100,00 | 0 | -100,00 | ||||
| 2026-02-17 | 13F | Raymond James Financial Inc | 102.050 | 15,90 | 245 | 68,28 | ||||
| 2026-02-17 | 13F | Advisor Group Holdings, Inc. | 1.000 | 0,00 | 2 | 100,00 | ||||
| 2026-02-09 | 13F | Texas Capital Bank Wealth Management Services Inc | 10.000 | 0,00 | 24 | 50,00 | ||||
| 2026-02-13 | 13F | State Street Corp | 125.473 | 60,10 | 301 | 133,33 | ||||
| 2026-02-17 | 13F | Northern Trust Corp | 58.164 | 17,47 | 140 | 71,60 | ||||
| 2026-02-12 | 13F | Jane Street Group, Llc | 22.827 | 55 | ||||||
| 2025-11-14 | 13F | Citadel Advisors Llc | 0 | -100,00 | 0 | -100,00 | ||||
| 2026-02-17 | 13F | Royal Bank Of Canada | 3.000 | 7 | ||||||
| 2026-02-06 | 13F | Larson Financial Group LLC | 1.250 | 0,00 | 3 | 50,00 | ||||
| 2026-02-12 | 13F | BlackRock, Inc. | 892.165 | 890,81 | 2.141 | 1.346,62 | ||||
| 2025-11-14 | 13F | Hrt Financial Lp | 0 | -100,00 | 0 | |||||
| 2026-02-13 | 13F | Wells Fargo & Company/mn | 1.000 | 0,00 | 2 | 100,00 | ||||
| 2026-01-28 | 13F | HB Wealth Management, LLC | 10.000 | 24 | ||||||
| 2026-02-12 | 13F | Litman Gregory Asset Management LLC | 400 | 1 | ||||||
| 2026-02-13 | 13F | Morgan Stanley | 61.632 | -12,73 | 148 | 26,72 |