Grundlæggende statistik
| Institutionelle ejere | 37 total, 37 long only, 0 short only, 0 long/short - change of 19,35% MRQ |
| Gennemsnitlig porteføljeallokering | 0.0889 % - change of 280,11% MRQ |
| Institutionelle aktier (lange) | 445.145 (ex 13D/G) - change of -0,29MM shares -39,19% MRQ |
| Institutionel værdi (lang) | $ 14.464 USD ($1000) |
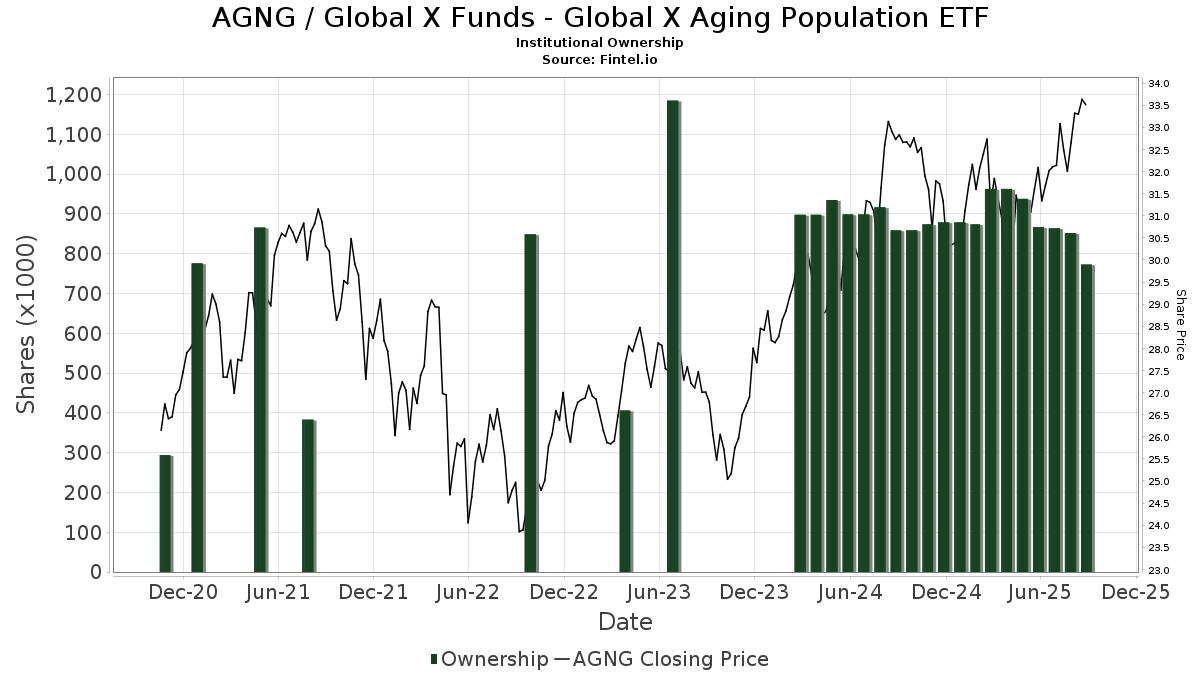
Institutionelt ejerskab og aktionærer
Global X Funds - Global X Aging Population ETF (US:AGNG) har 37 institutionelle ejere og aktionærer, der har indsendt 13D/G- eller 13F-formularer til Securities Exchange Commission (SEC). Disse institutioner har i alt 445,145 aktier. Største aktionærer omfatter Bright Futures Wealth Management, LLC., Daiwa Securities Group Inc., Cetera Investment Advisers, GWM Advisors LLC, LPL Financial LLC, Paller Financial Services Inc, REDW Wealth LLC, Lido Advisors, LLC, Bank Of America Corp /de/, and Susquehanna International Group, Llp .
Global X Funds - Global X Aging Population ETF (NasdaqGM:AGNG) institutionel ejerskabsstruktur viser aktuelle positioner i virksomheden efter institutioner og fonde, samt seneste ændringer i positionsstørrelse. Større aktionærer kan omfatte individuelle investorer, investeringsforeninger, hedgefonde eller institutioner. Skema 13D angiver, at investoren besidder (eller besidder) mere end 5 % af virksomheden og har til hensigt (eller har til hensigt at) aktivt at forfølge en ændring i forretningsstrategi. Skema 13G indikerer en passiv investering på over 5%.
The share price as of April 14, 2026 is 36,50 / share. Previously, on April 15, 2025, the share price was 29,52 / share. This represents an increase of 23,66% over that period.
Fondens stemningsscore
Fund Sentiment Score (fka Ownership Accumulation Score) finder de aktier, der bliver mest købt af fonde. Det er resultatet af en sofistikeret, multi-faktor kvantitativ model, der identificerer virksomheder med de højeste niveauer af institutionel akkumulering. Scoringsmodellen bruger en kombination af den samlede stigning i oplyste ejere, ændringerne i porteføljeallokeringer i disse ejere og andre målinger. Tallet går fra 0 til 100, hvor højere tal indikerer et højere niveau af akkumulering for sine jævnaldrende, og 50 er gennemsnittet.
Opdateringsfrekvens: Dagligt
Se Ownership Explorer, som giver en liste over højest rangerende virksomheder.
AI+ Ask Fintel’s AI assistant about Global X Funds - Global X Aging Population ETF.
Select a question to share a public post with an AI-crafted answer.
Thinking of good questions…
Institutionel Put/Call-forhold
Ud over at indberette standardaktie- og gældsudstedelser skal institutter med mere end 100 mill. aktiver under forvaltning også oplyse deres put- og call-optionsbeholdninger. Da salgsoptioner generelt indikerer negativ stemning, og købsoptioner indikerer positiv stemning, kan vi få en fornemmelse af den overordnede institutionelle stemning ved at plotte forholdet mellem put og kald. Diagrammet til højre viser det historiske put/call-forhold for dette instrument.
Brug af Put/Call Ratio som en indikator for investorernes stemning overvinder en af de vigtigste mangler ved at bruge totalt institutionelt ejerskab, som er, at en betydelig mængde af aktiver under forvaltning investeres passivt for at spore indekser. Passivt forvaltede fonde køber typisk ikke optioner, så indikatoren for put/call-forholdet følger mere nøje følelsen af aktivt forvaltede fonde.
13F og NPORT arkivering
Detaljer om 13F-arkivering er gratis. Detaljer om NP-ansøgninger kræver et premium-medlemskab. Grønne rækker angiver nye positioner. Røde rækker angiver lukkede positioner. Klik på linket ikon for at se den fulde transaktionshistorik.
Opgrader
for at låse premium-data op og eksportere til Excel ![]() .
.
| Fil dato | Kilde | Investor | Type | Gennemsnitlig pris (Øst) |
Aktier | Δ Aktier (%) |
Rapporteret Værdi ($1000) |
Δ Værdi (%) |
Port Alloc (%) |
|
|---|---|---|---|---|---|---|---|---|---|---|
| 2026-02-13 | 13F | Manufacturers Life Insurance Company, The | 6.950 | 249 | ||||||
| 2026-04-10 | 13F | Connecticut Capital Management Group, LLC | 5.854 | 208 | ||||||
| 2026-04-07 | 13F | Estate Planners Group, LLC | 307 | 11 | ||||||
| 2026-02-17 | 13F | Susquehanna International Group, Llp | 21.520 | 772 | ||||||
| 2026-02-17 | 13F | Fmr Llc | 215 | -83,29 | 8 | -83,72 | ||||
| 2026-02-13 | 13F | Toroso Investments, LLC | 7.526 | 270 | ||||||
| 2026-02-17 | 13F | Glenmede Trust Co Na | 0 | -100,00 | 0 | |||||
| 2026-02-13 | 13F | Arkadios Wealth Advisors | 7.121 | 0,00 | 256 | 7,14 | ||||
| 2026-02-12 | 13F | Bank Of Montreal /can/ | 22 | 0,00 | 1 | |||||
| 2026-02-17 | 13F | Cetera Investment Advisers | 34.019 | 38,00 | 1.221 | 48,18 | ||||
| 2026-01-28 | 13F | REDW Wealth LLC | 25.379 | -10,25 | 911 | -3,70 | ||||
| 2026-02-17 | 13F | Bank Of America Corp /de/ | 24.528 | -52,26 | 880 | -48,81 | ||||
| 2026-02-05 | 13F | Bright Futures Wealth Management, LLC. | 52.641 | 1.890 | ||||||
| 2026-02-11 | 13F | Simplex Trading, Llc | 18 | 1 | ||||||
| 2026-02-12 | 13F | Rossby Financial, LCC | 42 | -6,67 | 2 | 0,00 | ||||
| 2025-11-14 | 13F | Royal Bank Of Canada | 0 | -100,00 | 0 | -100,00 | ||||
| 2026-01-20 | 13F | Stratos Wealth Partners, LTD. | 7.875 | 4,51 | 283 | 11,90 | ||||
| 2026-02-06 | 13F | Pnc Financial Services Group, Inc. | 2.900 | 0,00 | 104 | 7,22 | ||||
| 2025-10-16 | 13F | Harwood Advisory Group, LLC | 0 | -100,00 | 0 | |||||
| 2026-02-17 | 13F | Advisor Group Holdings, Inc. | 16.256 | 2,85 | 584 | 12,12 | ||||
| 2026-02-12 | 13F | Principal Securities, Inc. | 0 | -100,00 | 0 | -100,00 | ||||
| 2026-02-11 | 13F | Insight Advisors, LLC/ PA | 8.565 | -14,45 | 307 | -8,36 | ||||
| 2026-02-13 | 13F | Wells Fargo & Company/mn | 0 | 0 | ||||||
| 2026-02-17 | 13F | Raymond James Financial Inc | 20.166 | -4,46 | 724 | 2,41 | ||||
| 2026-02-18 | 13F | GWM Advisors LLC | 33.750 | 1.212 | ||||||
| 2026-02-02 | 13F | Oppenheimer & Co Inc | 15.902 | -2,36 | 571 | 4,59 | ||||
| 2026-01-21 | 13F | Signature Resources Capital Management, LLC | 0 | -100,00 | 0 | |||||
| 2026-02-05 | 13F | Allworth Financial LP | 125 | 4 | ||||||
| 2026-02-13 | 13F | Sei Investments Co | 0 | -100,00 | 0 | |||||
| 2026-02-10 | 13F | Daiwa Securities Group Inc. | 40.000 | -91,11 | 1 | -93,33 | ||||
| 2026-02-17 | 13F | Jones Financial Companies Lllp | 0 | -100,00 | 0 | |||||
| 2026-02-11 | 13F | Franklin Resources Inc | 0 | -100,00 | 0 | |||||
| 2026-02-12 | 13F | Richard W. Paul & Associates, LLC | 17 | -58,54 | 1 | -100,00 | ||||
| 2025-11-13 | 13F | Glenmede Investment Management, LP | 1.050 | 0,00 | 35 | 6,06 | ||||
| 2026-04-07 | 13F | Farther Finance Advisors, LLC | 6.757 | 456,59 | 244 | 465,12 | ||||
| 2026-02-11 | 13F | LPL Financial LLC | 32.702 | 12,72 | 1.174 | 20,93 | ||||
| 2025-11-13 | 13F | Black Swift Group, LLC | 0 | -100,00 | 0 | -100,00 | ||||
| 2026-01-27 | 13F | Elevated Capital Advisors, LLC | 179 | 6 | ||||||
| 2026-01-28 | 13F | Geneos Wealth Management Inc. | 124 | 0,00 | 4 | 0,00 | ||||
| 2025-11-14 | 13F | Flow Traders U.s. Llc | 0 | -100,00 | 0 | |||||
| 2026-01-20 | 13F | Coastal Investment Advisors, Inc. | 113 | 145,65 | 4 | 300,00 | ||||
| 2026-01-15 | 13F | Paller Financial Services Inc | 28.030 | 1.006 | ||||||
| 2026-02-06 | 13F | Global Retirement Partners, LLC | 853 | 0,00 | 31 | 7,14 | ||||
| 2026-04-13 | 13F | IFP Advisors, Inc | 600 | 0,00 | 21 | 0,00 | ||||
| 2026-01-23 | 13F | HBW Advisory Services LLC | 0 | -100,00 | 0 | |||||
| 2026-02-12 | 13F | Oder Investment Management, LLC | 11.651 | 0,00 | 418 | 7,46 | ||||
| 2026-02-13 | 13F | Morgan Stanley | 612 | 21,91 | 22 | 31,25 | ||||
| 2026-02-10 | 13F | Lido Advisors, LLC | 24.706 | 0,00 | 827 | 0,12 | ||||
| 2026-02-06 | 13F | Northbridge Financial Group, Llc | 6.070 | 218 |