Grundlæggende statistik
| Institutionelle ejere | 59 total, 56 long only, 0 short only, 3 long/short - change of 3,39% MRQ |
| Gennemsnitlig porteføljeallokering | 0.3674 % - change of -16,14% MRQ |
| Institutionelle aktier (lange) | 16.024.392 (ex 13D/G) - change of 6,11MM shares 61,64% MRQ |
| Institutionel værdi (lang) | $ 72.245 USD ($1000) |
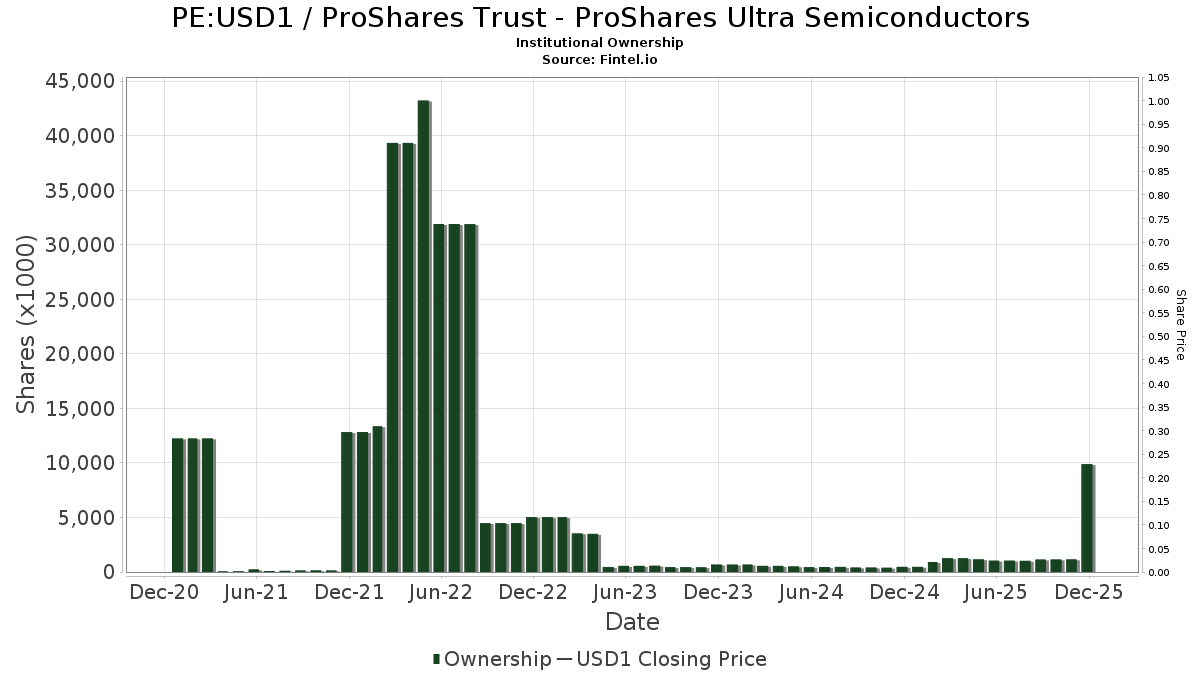
Institutionelt ejerskab og aktionærer
ProShares Trust - ProShares Ultra Semiconductors (PE:USD1) har 59 institutionelle ejere og aktionærer, der har indsendt 13D/G- eller 13F-formularer til Securities Exchange Commission (SEC). Disse institutioner har i alt 16,024,392 aktier. Største aktionærer omfatter Mariner, LLC, Dale Q Rice Investment Management Ltd, Susquehanna International Group, Llp, Citadel Advisors Llc, Susquehanna International Group, Llp, Dedeker Financial LLC, Citadel Advisors Llc, Jane Street Group, Llc, IMC-Chicago, LLC, and Blair William & Co/il .
ProShares Trust - ProShares Ultra Semiconductors (BVL:USD1) institutionel ejerskabsstruktur viser aktuelle positioner i virksomheden efter institutioner og fonde, samt seneste ændringer i positionsstørrelse. Større aktionærer kan omfatte individuelle investorer, investeringsforeninger, hedgefonde eller institutioner. Skema 13D angiver, at investoren besidder (eller besidder) mere end 5 % af virksomheden og har til hensigt (eller har til hensigt at) aktivt at forfølge en ændring i forretningsstrategi. Skema 13G indikerer en passiv investering på over 5%.
Fondens stemningsscore
Fund Sentiment Score (fka Ownership Accumulation Score) finder de aktier, der bliver mest købt af fonde. Det er resultatet af en sofistikeret, multi-faktor kvantitativ model, der identificerer virksomheder med de højeste niveauer af institutionel akkumulering. Scoringsmodellen bruger en kombination af den samlede stigning i oplyste ejere, ændringerne i porteføljeallokeringer i disse ejere og andre målinger. Tallet går fra 0 til 100, hvor højere tal indikerer et højere niveau af akkumulering for sine jævnaldrende, og 50 er gennemsnittet.
Opdateringsfrekvens: Dagligt
Se Ownership Explorer, som giver en liste over højest rangerende virksomheder.
AI+ Ask Fintel’s AI assistant about ProShares Trust - ProShares Ultra Semiconductors.
Select a question to share a public post with an AI-crafted answer.
Thinking of good questions…
13F og NPORT arkivering
Detaljer om 13F-arkivering er gratis. Detaljer om NP-ansøgninger kræver et premium-medlemskab. Grønne rækker angiver nye positioner. Røde rækker angiver lukkede positioner. Klik på linket ikon for at se den fulde transaktionshistorik.
Opgrader
for at låse premium-data op og eksportere til Excel ![]() .
.
| Fil dato | Kilde | Investor | Type | Gennemsnitlig pris (Øst) |
Aktier | Δ Aktier (%) |
Rapporteret Værdi ($1000) |
Δ Værdi (%) |
Port Alloc (%) |
|
|---|---|---|---|---|---|---|---|---|---|---|
| 2026-01-23 | 13F | Diversify Advisory Services, LLC | 0 | -100,00 | 0 | |||||
| 2026-02-05 | 13F | Tucker Asset Management Llc | 164 | 9 | ||||||
| 2026-02-13 | 13F | Integrated Wealth Concepts LLC | 0 | -100,00 | 0 | |||||
| 2026-01-29 | 13F | UBS Group AG | 1.088 | 57 | ||||||
| 2026-04-20 | 13F | Amiral Gestion | 0 | -100,00 | 0 | |||||
| 2026-02-03 | 13F | Bokf, Na | 720 | 100,00 | 38 | 5,71 | ||||
| 2026-04-07 | 13F | Farther Finance Advisors, LLC | 7.314 | 15,65 | 365 | 9,64 | ||||
| 2026-02-12 | 13F | Jane Street Group, Llc | 42.827 | 584,47 | 2.249 | 263,17 | ||||
| 2026-01-26 | 13F | Whittier Trust Co | 960 | 100,00 | 54 | 8,16 | ||||
| 2026-02-10 | 13F | Beaton Management Co. Inc. | 20.980 | 64,94 | 1 | 0,00 | ||||
| 2026-02-17 | 13F | Qube Research & Technologies Ltd | 0 | -100,00 | 0 | |||||
| 2026-02-18 | 13F | Plotkin Financial Advisors, LLC | 0 | -100,00 | 0 | |||||
| 2026-02-11 | 13F | Franklin Resources Inc | 2.156 | 163,57 | 113 | 41,25 | ||||
| 2026-02-13 | 13F | Morgan Stanley | 423 | -1,63 | 22 | -47,62 | ||||
| 2026-04-02 | 13F | Marex Group plc | 6.091 | 33,66 | 246 | -17,23 | ||||
| 2026-02-19 | 13F | CI Private Wealth, LLC | 0 | -100,00 | 0 | |||||
| 2026-01-21 | 13F | Sound Income Strategies, LLC | 176 | 10 | ||||||
| 2026-02-04 | 13F | Concentrum Wealth Management | 4.903 | 102,02 | 257 | 7,08 | ||||
| 2026-02-11 | 13F | Jpmorgan Chase & Co | 7.304 | -59,07 | 384 | -78,31 | ||||
| 2026-02-11 | 13F | Parallel Advisors, LLC | 962 | 5,37 | 51 | -44,44 | ||||
| 2026-02-17 | 13F/A | Sentinus, LLC | 4.600 | 242 | ||||||
| 2026-02-17 | 13F | Tower Research Capital LLC (TRC) | 37.360 | 3.735.900,00 | 1.962 | |||||
| 2026-01-28 | 13F | Chicago Partners Investment Group LLC | 4.205 | 99,95 | 238 | -5,56 | ||||
| 2026-02-12 | 13F | Federation des caisses Desjardins du Quebec | 609 | 32 | ||||||
| 2026-02-17 | 13F | Scientech Research LLC | 7.562 | 397 | ||||||
| 2026-02-17 | 13F | Citadel Advisors Llc | Call | 142.500 | -10,77 | 7.483 | -52,68 | |||
| 2026-03-31 | 13F/A | Barclays Plc | 0 | -100,00 | 0 | |||||
| 2026-02-17 | 13F | Citadel Advisors Llc | Put | 87.700 | 78,98 | 4.605 | -5,07 | |||
| 2026-02-17 | 13F | Quantinno Capital Management LP | 4.204 | 100,00 | 221 | 5,77 | ||||
| 2026-02-17 | 13F | Citadel Advisors Llc | 37.180 | 1.952 | ||||||
| 2025-11-14 | 13F | Wolverine Trading, Llc | Put | 0 | -100,00 | 0 | -100,00 | |||
| 2026-02-13 | 13F | Mariner, LLC | 14.832.743 | 66,58 | 14.956 | 66,70 | ||||
| 2025-11-14 | 13F | Raymond James Financial Inc | 0 | -100,00 | 0 | |||||
| 2026-04-22 | 13F | Spire Wealth Management | 4.395 | -1,17 | 211 | -9,87 | ||||
| 2025-11-13 | 13F | Quadrature Capital Ltd | 0 | -100,00 | 0 | |||||
| 2025-11-14 | 13F | Wolverine Trading, Llc | Call | 0 | -100,00 | 0 | -100,00 | |||
| 2025-12-02 | 13F | IFP Advisors, Inc | 0 | -100,00 | 0 | |||||
| 2026-02-02 | 13F | Chung Wu Investment Group, LLC | 18.200 | 116,67 | 956 | 14,92 | ||||
| 2026-02-17 | 13F | Blair William & Co/il | 60.282 | 99,27 | 3.165 | 5,68 | ||||
| 2026-02-17 | 13F | XTX Topco Ltd | 0 | -100,00 | 0 | |||||
| 2026-01-29 | 13F | IMC-Chicago, LLC | 63.823 | 21,09 | 3.351 | -35,79 | ||||
| 2026-02-09 | 13F | Hantz Financial Services, Inc. | 400 | 100,00 | 0 | |||||
| 2026-01-21 | 13F | Prime Capital Investment Advisors, LLC | 10.476 | 110,02 | 550 | 11,56 | ||||
| 2026-01-27 | 13F | US Asset Management LLC | 14.626 | 55,68 | 768 | -17,42 | ||||
| 2026-02-10 | 13F | Bnp Paribas Arbitrage, Sa | 155 | 638,10 | 8 | 300,00 | ||||
| 2026-02-05 | 13F | Cambridge Investment Research Advisors, Inc. | 58.213 | 785,23 | 3 | |||||
| 2026-02-13 | 13F | Citigroup Inc | 2 | 0 | ||||||
| 2026-02-10 | 13F | Moors & Cabot, Inc. | 4.847 | 100,29 | 255 | 6,28 | ||||
| 2026-04-21 | 13F | J.E. Simmons & Co., P.C. | 5.324 | -36,80 | 255 | -42,31 | ||||
| 2026-04-08 | 13F | Wealth Enhancement Advisory Services, Llc | 8.814 | 51,60 | 444 | 37,04 | ||||
| 2026-02-03 | 13F | SBI Securities Co., Ltd. | 45 | 2 | ||||||
| 2026-02-13 | 13F | Wells Fargo & Company/mn | 0 | -100,00 | 0 | |||||
| 2026-02-03 | 13F/A | Bank Of America Corp /de/ | 0 | -100,00 | 0 | -100,00 | ||||
| 2026-02-09 | 13F | First National Trust Co | 6.400 | 100,00 | 336 | 6,33 | ||||
| 2026-04-10 | 13F | Pure Financial Advisors, Inc. | 6.872 | 330 | ||||||
| 2026-02-13 | 13F | Headlands Technologies LLC | 0 | -100,00 | 0 | |||||
| 2026-02-10 | 13F | Catalyst Capital Advisors LLC | 312 | 16 | ||||||
| 2026-02-11 | 13F | LPL Financial LLC | 4.261 | 107,25 | 224 | 9,85 | ||||
| 2025-11-04 | 13F | Guerra Advisors Inc | 266 | 26 | ||||||
| 2026-02-11 | 13F | Vestor Capital, Llc | 295 | -97,11 | 1 | -100,00 | ||||
| 2026-02-17 | 13F | Wealth Watch Advisors, INC | 194 | 100,00 | 10 | 11,11 | ||||
| 2026-02-06 | 13F | Advisory Alpha, LLC | 20.559 | 100,30 | 1.080 | 1,22 | ||||
| 2026-01-30 | 13F | Dale Q Rice Investment Management Ltd | 438.563 | 89,98 | 23.009 | -8,59 | ||||
| 2026-02-17 | 13F | Susquehanna International Group, Llp | Call | 415.000 | 231,73 | 21.792 | 75,92 | |||
| 2026-04-07 | 13F | CoreCap Advisors, LLC | 0 | -100,00 | 0 | -100,00 | ||||
| 2026-04-21 | 13F | Avaii Wealth Management, Llc | 24.864 | 0,00 | 1.192 | -8,66 | ||||
| 2026-02-03 | 13F | Morse Asset Management, Inc | 17.687 | 99,29 | 929 | 5,69 | ||||
| 2026-02-04 | 13F | Valeo Financial Advisors, LLC | 9.200 | 100,00 | 483 | 6,15 | ||||
| 2026-04-10 | 13F | Client First Investment Management LLC | 0 | -100,00 | 0 | |||||
| 2026-04-15 | 13F | Dedeker Financial LLC | 90.225 | 37,43 | 4.326 | 25,50 | ||||
| 2026-02-17 | 13F | Momentous Wealth Management, Inc. | 8.485 | 446 | ||||||
| 2026-02-17 | 13F | Two Sigma Securities, Llc | 5.354 | 13,48 | 281 | -39,83 | ||||
| 2026-02-17 | 13F | Susquehanna International Group, Llp | 21.497 | 85,30 | 1.129 | -1,74 | ||||
| 2026-02-17 | 13F | Susquehanna International Group, Llp | Put | 123.300 | 56,27 | 6.474 | -17,13 | |||
| 2026-02-09 | 13F | Keating Financial Advisory Services, Inc. | 2.240 | 118 | ||||||
| 2026-02-17 | 13F | Advisor Group Holdings, Inc. | 2 | -99,44 | 0 | -100,00 | ||||
| 2026-02-11 | 13F | Simplex Trading, Llc | 0 | -100,00 | 0 | |||||
| 2026-02-12 | 13F | Renaissance Technologies Llc | 0 | -100,00 | 0 | |||||
| 2026-02-17 | 13F | TCG Advisory Services, LLC | 25.189 | 1.323 | ||||||
| 2026-04-07 | 13F | Signaturefd, Llc | 60 | 0,00 | 3 | -33,33 | ||||
| 2025-10-27 | 13F | Bogart Wealth, LLC | 0 | -100,00 | 0 | |||||
| 2026-02-12 | 13F | Jane Street Group, Llc | Put | 41.600 | -1,65 | 2.184 | -47,85 | |||
| 2026-01-22 | 13F | Brookwood Investment Group LLC | 10.197 | 62,35 | 535 | -13,85 | ||||
| 2026-01-28 | 13F | Retirement Planning Co of New England, Inc. | 50.465 | 89,72 | 2.650 | 0,61 | ||||
| 2026-02-12 | 13F | Jane Street Group, Llc | Call | 85.500 | 35,71 | 4.490 | -28,04 | |||
| 2026-02-17 | 13F | Jones Financial Companies Lllp | 0 | -100,00 | 0 | |||||
| 2026-02-12 | 13F | Hrt Financial Lp | 7.072 | 51,11 | 0 |
Other Listings
| US:USD | 80,25 $ |