Grundlæggende statistik
| Institutionelle ejere | 164 total, 151 long only, 2 short only, 11 long/short - change of 28,41% MRQ |
| Gennemsnitlig porteføljeallokering | 0.1225 % - change of -24,75% MRQ |
| Institutionelle aktier (lange) | 31.821.262 (ex 13D/G) - change of 0,55MM shares 1,93% MRQ |
| Institutionel værdi (lang) | $ 390.695 USD ($1000) |
Institutionelt ejerskab og aktionærer
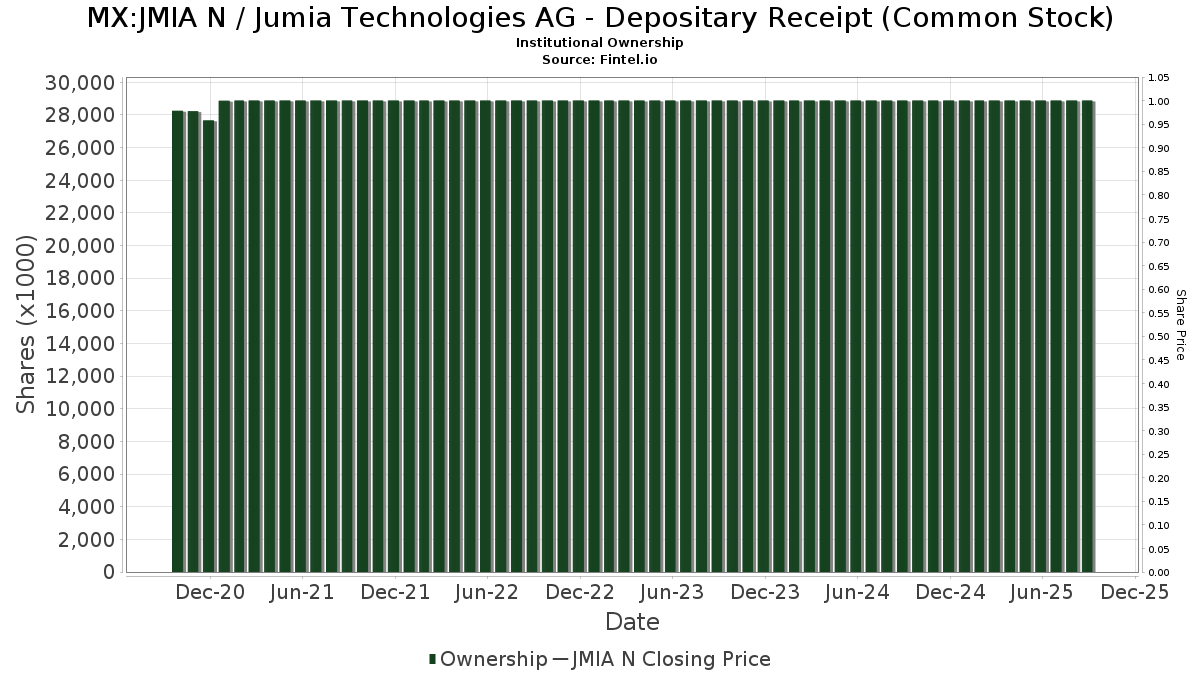
Jumia Technologies AG - Depositary Receipt (Common Stock) (MX:JMIA N) har 164 institutionelle ejere og aktionærer, der har indsendt 13D/G- eller 13F-formularer til Securities Exchange Commission (SEC). Disse institutioner har i alt 31,821,262 aktier. Største aktionærer omfatter Fund 1 Investments, LLC, D. E. Shaw & Co., Inc., Nomura Holdings Inc, Two Sigma Investments, Lp, UBS Group AG, Morgan Stanley, Jane Street Group, Llc, Susquehanna International Group, Llp, Two Sigma Advisers, Lp, and Susquehanna International Group, Llp .
Jumia Technologies AG - Depositary Receipt (Common Stock) (BMV:JMIA N) institutionel ejerskabsstruktur viser aktuelle positioner i virksomheden efter institutioner og fonde, samt seneste ændringer i positionsstørrelse. Større aktionærer kan omfatte individuelle investorer, investeringsforeninger, hedgefonde eller institutioner. Skema 13D angiver, at investoren besidder (eller besidder) mere end 5 % af virksomheden og har til hensigt (eller har til hensigt at) aktivt at forfølge en ændring i forretningsstrategi. Skema 13G indikerer en passiv investering på over 5%.
Fondens stemningsscore
Fund Sentiment Score (fka Ownership Accumulation Score) finder de aktier, der bliver mest købt af fonde. Det er resultatet af en sofistikeret, multi-faktor kvantitativ model, der identificerer virksomheder med de højeste niveauer af institutionel akkumulering. Scoringsmodellen bruger en kombination af den samlede stigning i oplyste ejere, ændringerne i porteføljeallokeringer i disse ejere og andre målinger. Tallet går fra 0 til 100, hvor højere tal indikerer et højere niveau af akkumulering for sine jævnaldrende, og 50 er gennemsnittet.
Opdateringsfrekvens: Dagligt
Se Ownership Explorer, som giver en liste over højest rangerende virksomheder.
AI+ Ask Fintel’s AI assistant about Jumia Technologies AG - Depositary Receipt (Common Stock).
Select a question to share a public post with an AI-crafted answer.
Thinking of good questions…
13F og NPORT arkivering
Detaljer om 13F-arkivering er gratis. Detaljer om NP-ansøgninger kræver et premium-medlemskab. Grønne rækker angiver nye positioner. Røde rækker angiver lukkede positioner. Klik på linket ikon for at se den fulde transaktionshistorik.
Opgrader
for at låse premium-data op og eksportere til Excel ![]() .
.
| Fil dato | Kilde | Investor | Type | Gennemsnitlig pris (Øst) |
Aktier | Δ Aktier (%) |
Rapporteret Værdi ($1000) |
Δ Værdi (%) |
Port Alloc (%) |
|
|---|---|---|---|---|---|---|---|---|---|---|
| 2026-02-12 | 13F | Federation des caisses Desjardins du Quebec | 9.797 | 29,30 | 122 | 40,23 | ||||
| 2026-02-17 | 13F | Advisory Services Network, LLC | 0 | -100,00 | 0 | |||||
| 2026-02-17 | 13F | D. E. Shaw & Co., Inc. | Call | 268.800 | 119,97 | 3.357 | 136,74 | |||
| 2026-02-13 | 13F | Centiva Capital, LP | 0 | -100,00 | 0 | |||||
| 2026-02-02 | 13F | Truist Financial Corp | 0 | -100,00 | 0 | |||||
| 2026-02-17 | 13F | D. E. Shaw & Co., Inc. | 4.059.288 | 4,78 | 50.701 | 12,72 | ||||
| 2026-02-12 | 13F | Wealthspire Advisors, LLC | 0 | -100,00 | 0 | |||||
| 2026-02-10 | 13F | Belvedere Trading LLC | 16.690 | 208 | ||||||
| 2026-02-05 | 13F | Allworth Financial LP | 2.045 | 3,18 | 26 | 8,70 | ||||
| 2026-02-17 | 13F | Fund 1 Investments, LLC | 8.755.298 | 32,85 | 109.354 | 42,92 | ||||
| 2026-02-17 | 13F | Fund 1 Investments, LLC | Call | 500.000 | -83,33 | 6.245 | -82,07 | |||
| 2026-02-09 | 13F | MRP Capital Investments, LLC | 500 | 0,00 | 6 | 200,00 | ||||
| 2025-11-20 | 13F | First Affirmative Financial Network | 0 | -100,00 | 0 | |||||
| 2026-02-11 | 13F | Winnow Wealth Llc | 400 | 5 | ||||||
| 2026-02-17 | 13F | National Asset Management, Inc. | Call | 0 | -100,00 | 0 | ||||
| 2025-11-14 | 13F | Cubist Systematic Strategies, LLC | 134.904 | 1.566 | ||||||
| 2026-02-12 | 13F | Insigneo Advisory Services, Llc | 65.500 | -1,43 | 818 | 6,10 | ||||
| 2025-11-14 | 13F | Cubist Systematic Strategies, LLC | Put | 297.800 | 3.457 | |||||
| 2026-02-10 | 13F | Daiwa Securities Group Inc. | 5.317 | -68,71 | 0 | |||||
| 2025-11-14 | 13F | Cubist Systematic Strategies, LLC | Call | 211.600 | 2.457 | |||||
| 2026-02-17 | 13F | Jump Financial, LLC | 27.517 | -93,63 | 344 | -93,17 | ||||
| 2026-02-13 | 13F | Dynamic Technology Lab Private Ltd | 16.251 | 203 | ||||||
| 2026-01-29 | 13F | IMC-Chicago, LLC | 188.866 | 2.359 | ||||||
| 2025-11-05 | 13F | J.w. Cole Advisors, Inc. | 0 | -100,00 | 0 | |||||
| 2026-01-29 | 13F | IMC-Chicago, LLC | Put | 244.300 | 40,73 | 3.051 | 51,41 | |||
| 2026-02-17 | 13F | National Asset Management, Inc. | 0 | -100,00 | 0 | |||||
| 2026-01-29 | 13F | IMC-Chicago, LLC | Call | 555.300 | 29,32 | 6.936 | 39,12 | |||
| 2026-02-13 | 13F | Walleye Capital LLC | Call | 0 | -100,00 | 0 | -100,00 | |||
| 2026-02-13 | 13F | WealthTrust Axiom LLC | 17.580 | -12,65 | 220 | -6,01 | ||||
| 2025-11-14 | 13F | Parallax Volatility Advisers, L.P. | Call | 0 | -100,00 | 0 | -100,00 | |||
| 2025-11-06 | 13F | Ameritas Advisory Services, LLC | 0 | -100,00 | 0 | |||||
| 2026-02-11 | 13F | Modus Advisors, LLC | 20.000 | 250 | ||||||
| 2026-04-13 | 13F | IFP Advisors, Inc | 100 | 0,00 | 1 | -100,00 | ||||
| 2026-02-11 | 13F | LPL Financial LLC | 187.778 | -2,70 | 2.345 | 4,69 | ||||
| 2026-02-17 | 13F | XTX Topco Ltd | 76.852 | 88,13 | 960 | 102,32 | ||||
| 2026-04-21 | 13F | Wealth Effects Llc | 58.560 | 0,00 | 404 | -44,73 | ||||
| 2026-04-22 | 13F | Samalin Investment Counsel, LLC | 14.768 | 20,46 | 102 | -33,99 | ||||
| 2026-02-17 | 13F | Susquehanna International Group, Llp | Put | 317.900 | 4,74 | 3.971 | 12,69 | |||
| 2026-02-17 | 13F | Susquehanna International Group, Llp | Call | 894.900 | 1,46 | 11.177 | 9,15 | |||
| 2026-02-13 | 13F | Colony Group, LLC | 12.235 | 153 | ||||||
| 2026-02-17 | 13F | Susquehanna International Group, Llp | 1.200.472 | 10,32 | 14.994 | 18,67 | ||||
| 2026-02-17 | 13F | Citadel Advisors Llc | 231.080 | -82,51 | 2.886 | -81,18 | ||||
| 2026-02-17 | 13F | Citadel Advisors Llc | Call | 715.000 | -2,28 | 8.930 | 5,12 | |||
| 2026-02-17 | 13F | Tower Research Capital LLC (TRC) | 568 | 667,57 | 7 | |||||
| 2026-02-17 | 13F | Citadel Advisors Llc | Put | 127.000 | 13,60 | 1.586 | 22,28 | |||
| 2026-02-17 | 13F | one8zero8, LLC | 167.800 | 20,89 | 2.096 | 30,04 | ||||
| 2026-04-22 | 13F | Stone House Investment Management, LLC | 3.350 | 0,00 | 23 | -43,90 | ||||
| 2026-02-17 | 13F | EFG International AG | 38.212 | 477 | ||||||
| 2026-02-09 | 13F | Fisher Asset Management, LLC | 0 | -100,00 | 0 | |||||
| 2026-04-21 | 13F | Pinnacle Wealth Management Advisory Group, LLC | 14.669 | 101 | ||||||
| 2026-01-30 | 13F | Us Bancorp \de\ | 134 | 0,00 | 2 | 0,00 | ||||
| 2026-02-17 | 13F | MIRAE ASSET GLOBAL ETFS HOLDINGS Ltd. | 52.506 | -11,29 | 656 | -4,66 | ||||
| 2026-02-17 | 13F | SageView Advisory Group, LLC | 115 | 1 | ||||||
| 2026-04-15 | 13F | Compagnie Lombard Odier SCmA | 4.000 | 0,00 | 28 | -44,90 | ||||
| 2026-02-17 | 13F | Raymond James Financial Inc | 142.338 | 1.778 | ||||||
| 2026-04-07 | 13F | Financially Speaking Inc | 0 | -100,00 | 0 | |||||
| 2026-01-28 | 13F | Financial Perspectives, Inc | 34 | 0,00 | 0 | |||||
| 2026-02-17 | 13F | Creative Planning | 25.802 | 5,77 | 322 | 13,78 | ||||
| 2026-02-05 | 13F | Cambridge Investment Research Advisors, Inc. | 49.984 | 320,88 | 1 | |||||
| 2025-11-03 | 13F | Crumly & Associates Inc. | 0 | -100,00 | 0 | |||||
| 2026-01-29 | 13F | UBS Group AG | Call | 1.661.200 | 20.748 | |||||
| 2026-01-29 | 13F | UBS Group AG | 427.263 | -11,93 | 5.337 | -5,26 | ||||
| 2026-02-17 | 13F | Two Sigma Advisers, Lp | 956.007 | 14,96 | 11.941 | 23,68 | ||||
| 2026-04-07 | 13F | Farther Finance Advisors, LLC | 14.191 | 1,02 | 99 | -44,00 | ||||
| 2025-11-19 | 13F | Sunbelt Securities, Inc. | 0 | -100,00 | 0 | |||||
| 2026-02-11 | 13F | Jpmorgan Chase & Co | 139.515 | 67.625,73 | 1.743 | 87.000,00 | ||||
| 2026-02-03 | 13F | SBI Securities Co., Ltd. | 536.568 | 15,18 | 6.702 | 23,91 | ||||
| 2026-02-17 | 13F | Advisor Group Holdings, Inc. | 36.770 | -14,97 | 459 | 12,50 | ||||
| 2026-02-13 | 13F | Squarepoint Ops LLC | 0 | -100,00 | 0 | -100,00 | ||||
| 2026-02-10 | 13F/A | Northwestern Mutual Wealth Management Co | 5 | -91,38 | 0 | |||||
| 2026-02-13 | 13F | MYDA Advisors LLC | Call | 60.000 | 749 | |||||
| 2026-04-20 | 13F | Boston Standard Wealth Management, LLC | 20.892 | 9,43 | 144 | -39,50 | ||||
| 2026-02-17 | 13F | Prostatis Group LLC | 0 | -100,00 | 0 | |||||
| 2026-02-12 | 13F | Principal Securities, Inc. | 0 | -100,00 | 0 | -100,00 | ||||
| 2026-02-13 | 13F | MYDA Advisors LLC | 60.000 | 749 | ||||||
| 2026-02-17 | 13F | SIH Partners, LLLP | 62.032 | 775 | ||||||
| 2026-02-13 | 13F | MAI Capital Management | 410 | 95,24 | 5 | 150,00 | ||||
| 2026-02-17 | 13F | Balyasny Asset Management Llc | 172.386 | 35,28 | 2.153 | 45,57 | ||||
| 2026-02-04 | 13F | Raelipskie Partnership | 2.450 | 0,00 | 31 | 7,14 | ||||
| 2026-02-17 | 13F | Massar Capital Management, LP | 198.495 | 2.479 | ||||||
| 2026-02-17 | 13F | General Equity Holdings LP | 653.029 | 79,85 | 8.156 | 93,50 | ||||
| 2026-02-03 | 13F | Mitsubishi UFJ Kokusai Asset Management Co., Ltd. | 24.989 | -67,79 | 321 | -64,44 | ||||
| 2026-02-13 | 13F | Kilter Group LLC | 200 | -60,00 | 2 | -60,00 | ||||
| 2026-02-17 | 13F | Nomura Holdings Inc | 3.213.173 | 595,99 | 40.133 | 648,87 | ||||
| 2026-02-13 | 13F | SRS Capital Advisors, Inc. | 405 | 5 | ||||||
| 2026-02-12 | 13F | BlackRock, Inc. | 135.679 | -7,56 | 1.695 | -0,59 | ||||
| 2026-02-12 | 13F | Skopos Labs, Inc. | 24.367 | 129,10 | 283 | 130,08 | ||||
| 2026-02-17 | 13F | Jones Financial Companies Lllp | 34.468 | 2,17 | 431 | 12,27 | ||||
| 2026-02-11 | 13F | Franklin Resources Inc | 231.700 | 2.894 | ||||||
| 2026-02-13 | 13F | Wells Fargo & Company/mn | 97.943 | 5,75 | 1.223 | 13,77 | ||||
| 2026-02-12 | 13F | Triumph Capital Management | 500 | 6 | ||||||
| 2026-02-13 | 13F | Toroso Investments, LLC | 37.175 | 464 | ||||||
| 2026-01-21 | 13F | Sound Income Strategies, LLC | 1.857 | 0,00 | 23 | 0,00 | ||||
| 2026-02-11 | 13F | Fox Run Management, L.l.c. | 0 | -100,00 | 0 | |||||
| 2026-04-15 | 13F | Activest Wealth Management | 1.001 | 0,00 | 7 | -50,00 | ||||
| 2026-02-13 | 13F | Caitong International Asset Management Co., Ltd | 3.770 | 2.066,67 | 47 | 2.250,00 | ||||
| 2026-02-17 | 13F | Brevan Howard Capital Management LP | 0 | -100,00 | 0 | -100,00 | ||||
| 2026-02-17 | 13F | Toronto Dominion Bank | Call | 68.400 | 839 | |||||
| 2025-11-13 | 13F | Clear Street Markets Llc | Call | 0 | -100,00 | 0 | ||||
| 2026-04-21 | 13F | Pinnacle Associates Ltd | 14.669 | 101 | ||||||
| 2026-02-09 | 13F | Harbour Investments, Inc. | 50 | 0,00 | 1 | |||||
| 2026-02-17 | 13F | Hood River Capital Management LLC | 110.767 | 1.383 | ||||||
| 2026-02-11 | 13F | Simplex Trading, Llc | Put | 328.600 | -1,17 | 4.104 | 136.700,00 | |||
| 2026-02-17 | 13F | Voloridge Investment Management, Llc | 0 | -100,00 | 0 | |||||
| 2026-02-11 | 13F | Simplex Trading, Llc | 258.418 | -1,35 | 3.228 | 107.466,67 | ||||
| 2026-02-13 | 13F | Manufacturers Life Insurance Company, The | 19.653 | 4,01 | 245 | 11,87 | ||||
| 2026-02-17 | 13F | Capital Fund Management S.a. | 119.299 | 1.490 | ||||||
| 2026-02-11 | 13F | Simplex Trading, Llc | Call | 101.900 | -46,87 | 1.273 | 63.500,00 | |||
| 2026-02-17 | 13F | Ameriprise Financial Inc | 18.666 | -8,48 | 233 | -1,27 | ||||
| 2026-02-12 | 13F | Quadrant Capital Group Llc | 3.578 | 0,00 | 45 | 7,32 | ||||
| 2026-02-17 | 13F | Trexquant Investment LP | 146.029 | 1.824 | ||||||
| 2026-02-10 | 13F | Acadian Asset Management Llc | 0 | -100,00 | 0 | |||||
| 2026-02-17 | 13F | Millennium Management Llc | 59.223 | -75,48 | 740 | -73,64 | ||||
| 2026-01-22 | 13F | Bfsg, Llc | 350 | 0,00 | 4 | 0,00 | ||||
| 2026-04-17 | 13F | AdvisorNet Financial, Inc | 5.400 | 0,00 | 37 | -44,78 | ||||
| 2026-02-17 | 13F | Cetera Investment Advisers | Call | 1.500 | 7,14 | 2 | 0,00 | |||
| 2026-02-17 | 13F | Royal Bank Of Canada | 10.309 | 104,87 | 128 | 120,69 | ||||
| 2026-02-17 | 13F | Spears Abacus Advisors LLC | 40.000 | 500 | ||||||
| 2026-02-17 | 13F | Cetera Investment Advisers | 20.850 | -7,36 | 260 | -0,38 | ||||
| 2026-01-13 | 13F | CoreCap Advisors, LLC | 0 | -100,00 | 0 | |||||
| 2026-02-13 | 13F | Citigroup Inc | 985 | -2,86 | 12 | 9,09 | ||||
| 2026-02-17 | 13F | Mangrove Partners | 15.629 | 195 | ||||||
| 2026-02-13 | 13F | Altrafin AG | 0 | -100,00 | 0 | |||||
| 2026-02-10 | 13F | Goldman Sachs Group Inc | 61.393 | -95,69 | 767 | -95,36 | ||||
| 2026-02-06 | 13F | Global Retirement Partners, LLC | 3.800 | 0,00 | 47 | 6,82 | ||||
| 2026-02-10 | 13F | Goldman Sachs Group Inc | Call | 462.300 | 96,06 | 5.774 | 110,96 | |||
| 2026-02-09 | 13F | Huntington National Bank | 3.000 | 0,00 | 37 | 8,82 | ||||
| 2026-04-15 | 13F | Bayforest Capital Ltd | 235 | 2 | ||||||
| 2026-02-17 | 13F | Clear Street Markets Llc | 716 | 9 | ||||||
| 2026-02-12 | 13F | CIBC Private Wealth Group, LLC | 50 | 0,00 | 1 | |||||
| 2026-02-06 | 13F | FourThought Financial Partners, LLC | 18.471 | 231 | ||||||
| 2026-02-13 | 13F | National Bank Of Canada /fi/ | 750 | -99,76 | 9 | -99,76 | ||||
| 2026-02-26 | 13F/A | Banque Transatlantique SA | 110 | 0,00 | 1 | 0,00 | ||||
| 2026-02-10 | 13F | Bnp Paribas Arbitrage, Sa | 121.646 | 481,54 | 1.519 | 527,69 | ||||
| 2026-02-12 | 13F | Commonwealth Equity Services, Llc | 25.696 | -2,72 | 321 | |||||
| 2025-11-14 | 13F | Wolverine Trading, Llc | 40.034 | -12,26 | 479 | 188,55 | ||||
| 2025-11-10 | 13F | Atomi Financial Group, Inc. | 0 | -100,00 | 0 | -100,00 | ||||
| 2025-11-14 | 13F | Wolverine Trading, Llc | Call | 222.200 | 49,73 | 2.660 | 389,69 | |||
| 2026-04-10 | 13F | Octavia Wealth Advisors, LLC | 18.075 | 24,66 | 125 | -31,49 | ||||
| 2026-04-15 | 13F | Exchange Traded Concepts, Llc | 51.992 | -6,92 | 359 | -48,64 | ||||
| 2025-11-14 | 13F | Wolverine Trading, Llc | Put | 40.100 | 71,37 | 480 | 463,53 | |||
| 2026-04-21 | 13F | PDS Planning, Inc | 14.552 | 0,00 | 100 | -44,75 | ||||
| 2025-10-28 | 13F | Ritholtz Wealth Management | 0 | -100,00 | 0 | |||||
| 2026-04-09 | 13F | Key Client Fiduciary Advisors, LLC | 17.516 | 0,68 | 121 | -44,70 | ||||
| 2026-02-17 | 13F | Schonfeld Strategic Advisors LLC | 0 | -100,00 | 0 | |||||
| 2026-02-13 | 13F | Walleye Trading LLC | Call | 79.600 | -38,05 | 994 | -33,33 | |||
| 2026-02-13 | 13F | Walleye Trading LLC | 24.471 | 306 | ||||||
| 2026-02-13 | 13F | Walleye Trading LLC | Put | 49.900 | -37,86 | 623 | -33,15 | |||
| 2025-11-14 | 13F | Brown Advisory Inc | 0 | -100,00 | 0 | |||||
| 2026-03-11 | 13F | Leonteq Securities AG | 0 | -100,00 | 0 | |||||
| 2026-04-17 | 13F | RFG Advisory, LLC | 30.969 | 197,18 | 214 | 63,85 | ||||
| 2026-02-13 | 13F | Marshall Wace, Llp | 17.100 | -75,87 | 214 | -74,09 | ||||
| 2026-02-12 | 13F | Hrt Financial Lp | 174.700 | 244,58 | 2 | |||||
| 2026-02-17 | 13F | Crawford Fund Management, LLC | Put | 105.500 | 66,14 | 1.318 | 78,70 | |||
| 2026-02-13 | 13F | State Street Corp | 502.461 | -43,59 | 6.276 | -39,33 | ||||
| 2026-02-06 | 13F | Profund Advisors Llc | 0 | -100,00 | 0 | |||||
| 2026-02-17 | 13F | Cantor Fitzgerald, L. P. | Call | 100.000 | 1.249 | |||||
| 2026-02-12 | 13F | Jane Street Group, Llc | 1.375.071 | 266,05 | 17.175 | 293,81 | ||||
| 2026-02-13 | 13F | Squarepoint Ops LLC | Put | 18.900 | 9,88 | 236 | 18,59 | |||
| 2026-02-12 | 13F | Jane Street Group, Llc | Call | 621.100 | 1.247,29 | 7.758 | 1.349,91 | |||
| 2026-02-12 | 13F | Jane Street Group, Llc | Put | 23.300 | 291 | |||||
| 2026-02-17 | 13F | Shay Capital LLC | 214.200 | 2.675 | ||||||
| 2026-02-17 | 13F | Shay Capital LLC | Call | 796.100 | 9.943 | |||||
| 2026-04-06 | 13F | Versant Capital Management, Inc | 382 | 0,00 | 3 | -50,00 | ||||
| 2026-02-10 | 13F | Lido Advisors, LLC | 12.214 | 0,00 | 146 | 3,55 | ||||
| 2026-02-12 | 13F | Steward Partners Investment Advisory, Llc | 19.221 | -28,07 | 240 | -22,58 | ||||
| 2026-02-17 | 13F | Lazard Asset Management Llc | 121.643 | 1.519 | ||||||
| 2026-01-30 | 13F | Archer Investment Corp | 450 | 0,00 | 6 | 0,00 | ||||
| 2026-02-17 | 13F | Private Advisor Group, LLC | 23.743 | -4,01 | 297 | 3,14 | ||||
| 2026-02-17 | 13F | Susquehanna Portfolio Strategies, LLC | 29.878 | 0,00 | 373 | 7,80 | ||||
| 2026-02-03 | 13F | International Assets Investment Management, Llc | 21.150 | -42,45 | 264 | 54,39 | ||||
| 2026-02-04 | 13F | Dogwood Wealth Management LLC | 175 | 0,00 | 2 | 0,00 | ||||
| 2025-12-09 | 13F/A | Tudor Investment Corp Et Al | 44.692 | 519 | ||||||
| 2026-04-06 | 13F | GAMMA Investing LLC | 11.419 | 17,31 | 79 | -35,54 | ||||
| 2025-11-12 | 13F | HAP Trading, LLC | 85.059 | 988 | ||||||
| 2026-04-07 | 13F | Central Pacific Bank - Trust Division | 11.921 | 0,00 | 82 | -44,59 | ||||
| 2026-04-07 | 13F | Signaturefd, Llc | 360 | -39,19 | 2 | -71,43 | ||||
| 2026-02-13 | 13F | National Bank Of Canada /fi/ | Put | 0 | -100,00 | 0 | ||||
| 2026-04-15 | 13F | Valley National Advisers Inc | 200 | 0,00 | 0 | |||||
| 2026-02-12 | 13F | Marex Group plc | 55.000 | 0,00 | 687 | 7,52 | ||||
| 2026-02-14 | 13F | Rockefeller Capital Management L.P. | 0 | -100,00 | 0 | |||||
| 2026-02-10 | 13F | Root Financial Partners, LLC | 0 | -100,00 | 0 | |||||
| 2026-02-17 | 13F | Engineers Gate Manager LP | 26.055 | 325 | ||||||
| 2026-02-13 | 13F | JustInvest LLC | 19.473 | 1,32 | 243 | 8,97 | ||||
| 2026-02-13 | 13F | Barclays Plc | 20.500 | 7,89 | 256 | 16,36 | ||||
| 2026-02-17 | 13F | Laird Norton Trust Company, Llc | 129.669 | 11,47 | 1.620 | 19,93 | ||||
| 2026-02-13 | 13F | Quarry LP | 1.839 | 11,59 | 23 | 15,79 | ||||
| 2026-02-06 | 13F | Gsa Capital Partners Llp | 74.392 | 2,08 | 1 | |||||
| 2026-02-13 | 13F | Headlands Technologies LLC | 94.099 | 25,64 | 1.175 | 35,21 | ||||
| 2026-02-11 | 13F | Group One Trading, L.p. | Put | 368.900 | -45,91 | 4.608 | -41,82 | |||
| 2026-02-11 | 13F | Group One Trading, L.p. | Call | 833.800 | 3,31 | 10.414 | 11,14 | |||
| 2026-02-11 | 13F | Group One Trading, L.p. | 450.176 | 94,22 | 5.623 | 109,00 | ||||
| 2026-02-17 | 13F | Aquatic Capital Management LLC | 0 | -100,00 | 0 | |||||
| 2026-02-13 | 13F | Y-Intercept (Hong Kong) Ltd | 27.695 | 346 | ||||||
| 2026-02-17 | 13F | Caption Management, LLC | 18.000 | 225 | ||||||
| 2026-02-17 | 13F | Caption Management, LLC | Call | 50.000 | 624 | |||||
| 2026-04-21 | 13F | PharVision Advisers, LLC | 0 | -100,00 | 0 | |||||
| 2026-02-12 | 13F | Bank Of Montreal /can/ | 120.903 | -43,67 | 1.510 | -39,38 | ||||
| 2026-02-17 | 13F | Point72 Asset Management, L.P. | Call | 225.500 | 2.816 | |||||
| 2026-01-27 | 13F | Zurcher Kantonalbank (Zurich Cantonalbank) | 10.225 | 128 | ||||||
| 2026-02-17 | 13F | Point72 Asset Management, L.P. | 265.578 | 44,42 | 3.317 | 55,36 | ||||
| 2026-02-17 | 13F | Point72 Asset Management, L.P. | Put | 217.100 | 2.712 | |||||
| 2026-02-06 | 13F | GPS Wealth Strategies Group, LLC | 500 | 0,00 | 6 | 20,00 | ||||
| 2026-02-13 | 13F | Walleye Capital LLC | 1 | -100,00 | 0 | -100,00 | ||||
| 2026-02-13 | 13F | Walleye Capital LLC | Put | 14.500 | -65,39 | 181 | -62,76 | |||
| 2026-02-17 | 13F | Cantor Fitzgerald, L. P. | 0 | -100,00 | 0 | -100,00 | ||||
| 2026-02-12 | 13F | Scotia Capital Inc. | 10.000 | 0,00 | 125 | 6,90 | ||||
| 2026-02-17 | 13F | Two Sigma Investments, Lp | 1.724.662 | -1,03 | 21.541 | 6,47 | ||||
| 2026-04-13 | 13F | Gill Capital Partners, Llc | 50 | 0 | ||||||
| 2026-01-07 | 13F | Yeomans Consulting Group, Inc. | 28.780 | -26,38 | 359 | -22,13 | ||||
| 2026-02-17 | 13F | Blair William & Co/il | 13.700 | -15,43 | 171 | -9,04 | ||||
| 2026-04-22 | 13F | Qp Wealth Management, Llc | 0 | -100,00 | 0 | |||||
| 2026-02-12 | 13F | Groupe la Francaise | 0 | -100,00 | 0 | |||||
| 2026-01-27 | 13F | TD Waterhouse Canada Inc. | 2.074 | -9,98 | 26 | -7,41 | ||||
| 2026-01-21 | 13F | Flagship Harbor Advisors, Llc | 200 | 2 | ||||||
| 2026-02-17 | 13F | Prelude Capital Management, Llc | 27.500 | 27,91 | 343 | 37,75 | ||||
| 2026-01-28 | 13F | Geneos Wealth Management Inc. | 50 | 0,00 | 1 | |||||
| 2025-11-14 | 13F | Peak6 Llc | Call | 0 | -100,00 | 0 | ||||
| 2026-02-13 | 13F | Morgan Stanley | 1.595.217 | 72,65 | 19.924 | 85,74 | ||||
| 2026-02-13 | 13F | Kestra Advisory Services, LLC | 4.344 | 54 | ||||||
| 2026-02-17 | 13F | Bank Of America Corp /de/ | 52.167 | -83,31 | 652 | -82,06 | ||||
| 2026-02-13 | 13F | Verition Fund Management LLC | 147.583 | 19,36 | 1.843 | 28,43 | ||||
| 2026-01-26 | 13F | Cwm, Llc | 47.806 | -8,99 | 1 | |||||
| 2026-01-14 | 13F | ORG Partners LLC | 100 | 0,00 | 1 | 0,00 | ||||
| 2026-01-27 | 13F | Revisor Wealth Management LLC | 185.350 | 0,00 | 2.347 | -1,72 | ||||
| 2026-02-06 | 13F | Pnc Financial Services Group, Inc. | 2.400 | 0,00 | 30 | 7,41 | ||||
| 2026-02-19 | 13F | Mcguire Capital Advisors Inc | 800 | 10 | ||||||
| 2026-02-11 | 13F | Parallel Advisors, LLC | 1.264 | 8,97 | 16 | 15,38 | ||||
| 2026-02-18 | 13F | GWM Advisors LLC | 500 | 6 | ||||||
| 2026-02-06 | 13F | EverSource Wealth Advisors, LLC | 4.167 | -10,56 | 52 | -3,70 | ||||
| 2026-02-17 | 13F | Ninepoint Partners LP | 113 | 1 | ||||||
| 2026-02-02 | 13F | Nkcfo Llc | 25.000 | 0 | ||||||
| 2026-02-13 | 13F | Rhumbline Advisers | 1.390 | 0,36 | 17 | 6,25 | ||||
| 2026-02-10 | 13F | Quantbot Technologies LP | 0 | -100,00 | 0 | |||||
| 2025-11-14 | 13F | Point72 (DIFC) Ltd | 0 | -100,00 | 0 |