Grundlæggende statistik
| Institutionelle aktier (lange) | 26.084.226 - 43,60% (ex 13D/G) - change of 2,82MM shares 11,14% MRQ |
| Institutionel værdi (lang) | $ 550.786 USD ($1000) |
Institutionelt ejerskab og aktionærer
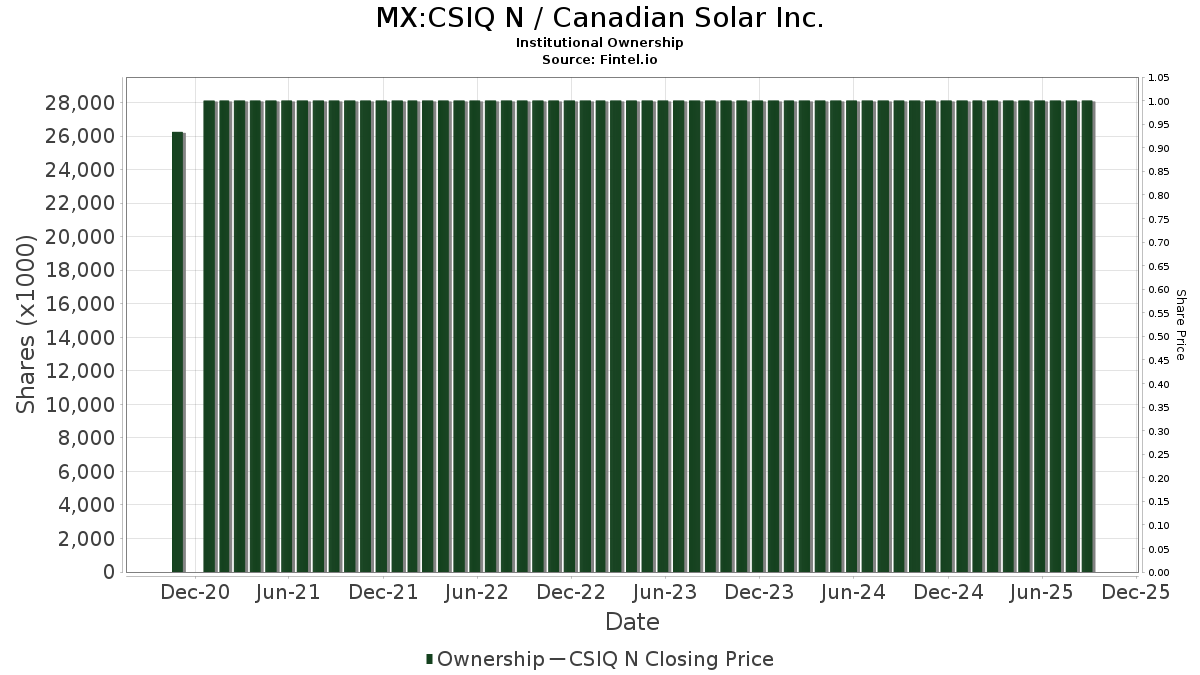
Canadian Solar Inc. (MX:CSIQ N) har 147 institutionelle ejere og aktionærer, der har indsendt 13D/G- eller 13F-formularer til Securities Exchange Commission (SEC). Disse institutioner har i alt 26,084,226 aktier. Største aktionærer omfatter Mackenzie Financial Corp, Susquehanna International Group, Llp, D. E. Shaw & Co., Inc., Invesco Ltd., Polunin Capital Partners Ltd, Group One Trading, L.p., Morgan Stanley, Legal & General Group Plc, Walleye Trading LLC, and Susquehanna International Group, Llp .
Canadian Solar Inc. (BMV:CSIQ N) institutionel ejerskabsstruktur viser aktuelle positioner i virksomheden efter institutioner og fonde, samt seneste ændringer i positionsstørrelse. Større aktionærer kan omfatte individuelle investorer, investeringsforeninger, hedgefonde eller institutioner. Skema 13D angiver, at investoren besidder (eller besidder) mere end 5 % af virksomheden og har til hensigt (eller har til hensigt at) aktivt at forfølge en ændring i forretningsstrategi. Skema 13G indikerer en passiv investering på over 5%.
Fondens stemningsscore
Fund Sentiment Score (fka Ownership Accumulation Score) finder de aktier, der bliver mest købt af fonde. Det er resultatet af en sofistikeret, multi-faktor kvantitativ model, der identificerer virksomheder med de højeste niveauer af institutionel akkumulering. Scoringsmodellen bruger en kombination af den samlede stigning i oplyste ejere, ændringerne i porteføljeallokeringer i disse ejere og andre målinger. Tallet går fra 0 til 100, hvor højere tal indikerer et højere niveau af akkumulering for sine jævnaldrende, og 50 er gennemsnittet.
Opdateringsfrekvens: Dagligt
Se Ownership Explorer, som giver en liste over højest rangerende virksomheder.
AI+ Ask Fintel’s AI assistant about Canadian Solar Inc..
Select a question to share a public post with an AI-crafted answer.
Thinking of good questions…
13F og NPORT arkivering
Detaljer om 13F-arkivering er gratis. Detaljer om NP-ansøgninger kræver et premium-medlemskab. Grønne rækker angiver nye positioner. Røde rækker angiver lukkede positioner. Klik på linket ikon for at se den fulde transaktionshistorik.
Opgrader
for at låse premium-data op og eksportere til Excel ![]() .
.
| Fil dato | Kilde | Investor | Type | Gennemsnitlig pris (Øst) |
Aktier | Δ Aktier (%) |
Rapporteret Værdi ($1000) |
Δ Værdi (%) |
Port Alloc (%) |
|
|---|---|---|---|---|---|---|---|---|---|---|
| 2025-11-14 | 13F | Peak6 Llc | 0 | -100,00 | 0 | -100,00 | ||||
| 2026-02-13 | 13F | Golden State Wealth Management, LLC | 2 | 0,00 | 0 | |||||
| 2026-02-13 | 13F | Great West Life Assurance Co /can/ | 24.093 | 21,89 | 1 | |||||
| 2026-02-11 | 13F | LPL Financial LLC | 15.525 | 16,68 | 369 | 113,29 | ||||
| 2026-02-12 | 13F | Steward Partners Investment Advisory, Llc | 7 | 0 | ||||||
| 2026-03-06 | 13F | Hsbc Holdings Plc | 11.691 | 278 | ||||||
| 2026-02-13 | 13F | Macquarie Group Ltd | 0 | -100,00 | 0 | -100,00 | ||||
| 2026-03-02 | 13F | Reflection Asset Management | 100 | 2 | ||||||
| 2025-11-14 | 13F | Two Sigma Securities, Llc | 0 | -100,00 | 0 | -100,00 | ||||
| 2025-11-12 | 13F | Simplex Trading, Llc | 0 | -100,00 | 0 | |||||
| 2026-02-10 | 13F | Bnp Paribas Arbitrage, Sa | Put | 700 | 1.664 | |||||
| 2026-02-10 | 13F | Bnp Paribas Arbitrage, Sa | Call | 761 | 1.809 | |||||
| 2026-04-03 | 13F | Adirondack Trust Co | 500 | 0,00 | 7 | -45,45 | ||||
| 2026-02-13 | 13F | SPX Equities Gestao de Recursos Ltda | 0 | -100,00 | 0 | |||||
| 2026-02-13 | 13F | National Bank Of Canada /fi/ | 3.023 | -24,39 | 72 | 36,54 | ||||
| 2026-02-06 | 13F | EverSource Wealth Advisors, LLC | 102 | 0,00 | 2 | 100,00 | ||||
| 2026-04-21 | 13F | Nemes Rush Group LLC | 100 | 0,00 | 1 | -50,00 | ||||
| 2025-11-06 | 13F | Ameritas Advisory Services, LLC | 0 | -100,00 | 0 | |||||
| 2026-02-10 | 13F | Bnp Paribas Arbitrage, Sa | 744.259 | 12,56 | 17.691 | 105,21 | ||||
| 2026-01-29 | 13F | UBS Group AG | 399.963 | 71,25 | 9.507 | 212,22 | ||||
| 2026-02-17 | 13F | Brevan Howard Capital Management LP | 0 | -100,00 | 0 | |||||
| 2026-02-05 | 13F | Allworth Financial LP | 651 | 0,00 | 15 | 87,50 | ||||
| 2026-02-11 | 13F | Allianz Asset Management GmbH | 9.272 | 220 | ||||||
| 2026-02-10 | 13F | Acadian Asset Management Llc | 69.501 | 2 | ||||||
| 2026-02-17 | 13F | Balyasny Asset Management Llc | 19.981 | 475 | ||||||
| 2026-02-17 | 13F | Clear Street Markets Llc | Call | 20.000 | 475 | |||||
| 2026-02-13 | 13F | Sculptor Capital LP | Put | 27.300 | 0,00 | 649 | 82,54 | |||
| 2026-02-12 | 13F | Polen Capital Management Llc | 22.223 | 528 | ||||||
| 2026-02-13 | 13F | Sculptor Capital LP | 16.500 | -39,56 | 392 | 10,42 | ||||
| 2026-02-17 | 13F | Engineers Gate Manager LP | 10.173 | 242 | ||||||
| 2025-11-14 | 13F | California Public Employees Retirement System | 0 | -100,00 | 0 | |||||
| 2026-02-12 | 13F | Skandinaviska Enskilda Banken AB (publ) | 0 | -100,00 | 0 | |||||
| 2025-11-12 | 13F | Mach-1 Financial Group, Inc. | 0 | -100,00 | 0 | -100,00 | ||||
| 2026-02-13 | 13F | Morgan Stanley | 1.688.944 | 9,88 | 40.146 | 100,30 | ||||
| 2026-02-13 | 13F | Verition Fund Management LLC | 63.540 | -58,97 | 1.510 | -25,21 | ||||
| 2026-01-30 | 13F | State of New Jersey Common Pension Fund D | 16.375 | 389 | ||||||
| 2025-12-16 | 13F | Emergent Wealth Advisors, LLC | 0 | 0 | ||||||
| 2026-02-13 | 13F | Walleye Trading LLC | 0 | -100,00 | 0 | -100,00 | ||||
| 2026-02-17 | 13F | Boothbay Fund Management, Llc | 171.050 | 4.066 | ||||||
| 2026-02-13 | 13F | K2 Principal Fund, L.p. | Put | 75.000 | 1.783 | |||||
| 2026-02-11 | 13F | Group One Trading, L.p. | Put | 305.100 | 106,43 | 7.252 | 276,34 | |||
| 2026-02-12 | 13F | Federation des caisses Desjardins du Quebec | 19.698 | -8,73 | 468 | 66,55 | ||||
| 2026-02-17 | 13F | Susquehanna International Group, Llp | Put | 1.358.600 | 217,50 | 32.294 | 478,83 | |||
| 2026-02-11 | 13F | Group One Trading, L.p. | Call | 1.918.100 | 60,27 | 45.593 | 192,15 | |||
| 2026-02-17 | 13F | Susquehanna International Group, Llp | Call | 2.705.000 | 263,53 | 64.298 | 562,65 | |||
| 2026-04-15 | 13F | City Holding Co | 300 | 0,00 | 4 | -42,86 | ||||
| 2026-02-17 | 13F | Susquehanna International Group, Llp | 20.536 | -92,50 | 488 | -86,32 | ||||
| 2026-02-13 | 13F | Smartleaf Asset Management LLC | 48 | 1 | ||||||
| 2026-02-14 | 13F | Taikang Asset Management (Hong Kong) Co Ltd | 2.900 | 69 | ||||||
| 2026-01-15 | 13F | Lodestone Wealth Management LLC | 430 | 10 | ||||||
| 2026-02-05 | 13F | Bank Julius Baer & Co. Ltd, Zurich | 5.650 | 0,00 | 133 | 82,19 | ||||
| 2026-02-17 | 13F | Parallax Volatility Advisers, L.P. | Put | 20.100 | 0,00 | 478 | 82,06 | |||
| 2026-02-17 | 13F | Parallax Volatility Advisers, L.P. | 3.591 | 85 | ||||||
| 2026-02-17 | 13F | MIRAE ASSET GLOBAL ETFS HOLDINGS Ltd. | 355.738 | -54,49 | 8.462 | -16,17 | ||||
| 2026-02-13 | 13F | Walleye Trading LLC | Put | 625.700 | 1.472,11 | 14.873 | 2.771,04 | |||
| 2026-02-13 | 13F | Citigroup Inc | 528.708 | 441,83 | 12.567 | 887,97 | ||||
| 2026-02-13 | 13F | Citigroup Inc | Call | 250.000 | 5.942 | |||||
| 2026-02-13 | 13F | Walleye Trading LLC | Call | 1.507.100 | 6.719,46 | 35.824 | 12.338,54 | |||
| 2026-01-16 | 13F | Standard Life Aberdeen plc | 61.597 | -20,76 | 1.464 | 44,52 | ||||
| 2026-02-17 | 13F | SummitTX Capital, L.P. | 13.973 | 332 | ||||||
| 2025-10-27 | 13F | Decker Retirement Planning Inc. | 0 | -100,00 | 0 | |||||
| 2026-02-17 | 13F | Tudor Investment Corp Et Al | Put | 169.900 | 4.039 | |||||
| 2026-02-17 | 13F | Citadel Advisors Llc | 242.842 | 650,60 | 5.772 | 1.271,02 | ||||
| 2026-02-17 | 13F | Tudor Investment Corp Et Al | Call | 156.400 | 3.718 | |||||
| 2026-02-17 | 13F | Citadel Advisors Llc | Put | 525.400 | 49,43 | 12.489 | 172,43 | |||
| 2026-02-17 | 13F | Tudor Investment Corp Et Al | 431.175 | 12,27 | 10.249 | 104,69 | ||||
| 2026-02-17 | 13F | Citadel Advisors Llc | Call | 819.900 | 123,71 | 19.489 | 307,80 | |||
| 2026-03-03 | 13F/A | Caitong International Asset Management Co., Ltd | 16.879 | 427,80 | 401 | 878,05 | ||||
| 2026-02-03 | 13F | Mitsubishi UFJ Kokusai Asset Management Co., Ltd. | 22.499 | -38,90 | 572 | 18,96 | ||||
| 2025-11-17 | 13F | PharVision Advisers, LLC | 0 | -100,00 | 0 | |||||
| 2026-02-13 | 13F | Barclays Plc | 9.471 | -39,28 | 225 | 10,84 | ||||
| 2026-02-13 | 13F | State Street Corp | 601.915 | -22,80 | 14.308 | 40,72 | ||||
| 2026-02-17 | 13F | Voloridge Investment Management, Llc | 252.964 | 6.013 | ||||||
| 2026-02-13 | 13F | Ubs Asset Management Americas Inc | 27.309 | 649 | ||||||
| 2026-02-18 | 13F | Mackenzie Financial Corp | 2.884.415 | -48,67 | 68.485 | -6,54 | ||||
| 2026-02-10 | 13F | Clear Harbor Asset Management, LLC | 15.075 | -16,60 | 358 | 52,34 | ||||
| 2025-11-14 | 13F | Cubist Systematic Strategies, LLC | Put | 10.300 | -75,24 | 134 | -70,81 | |||
| 2026-02-12 | 13F | Skopos Labs, Inc. | 16.443 | 400 | ||||||
| 2026-01-22 | 13F/A | Cresset Asset Management, LLC | 0 | -100,00 | 0 | |||||
| 2025-11-13 | 13F | Private Advisor Group, LLC | 0 | -100,00 | 0 | |||||
| 2026-02-09 | 13F | Geode Capital Management, Llc | 81.687 | 13,11 | 1.942 | 106,27 | ||||
| 2026-02-12 | 13F | BlackRock, Inc. | 1.056.431 | 24,40 | 25.111 | 126,78 | ||||
| 2026-02-12 | 13F | AI-Squared Management Ltd | 297.800 | 7.079 | ||||||
| 2026-02-10 | 13F | Goldman Sachs Group Inc | 591.446 | -41,68 | 14.059 | 6,30 | ||||
| 2026-02-13 | 13F | Centiva Capital, LP | 110.914 | 2.636 | ||||||
| 2026-04-17 | 13F | Bell Investment Advisors, Inc | 29 | 0 | ||||||
| 2026-04-09 | 13F | DHJJ Financial Advisors, Ltd. | 100 | 0,00 | 1 | -50,00 | ||||
| 2026-01-29 | 13F | IMC-Chicago, LLC | Put | 348.600 | 194,92 | 8.286 | 437,70 | |||
| 2026-01-29 | 13F | IMC-Chicago, LLC | Call | 551.500 | 105,86 | 13.109 | 275,29 | |||
| 2026-02-02 | 13F | Hussman Strategic Advisors, Inc. | 126.000 | 2.995 | ||||||
| 2026-02-17 | 13F | Weiss Asset Management LP | 0 | -100,00 | 0 | -100,00 | ||||
| 2026-02-17 | 13F | Millennium Management Llc | 340.118 | 148,23 | 8.085 | 352,63 | ||||
| 2026-04-14 | 13F | Banque Pictet & Cie Sa | 0 | -100,00 | 0 | |||||
| 2026-01-28 | 13F | DekaBank Deutsche Girozentrale | 7.920 | 0,00 | 0 | |||||
| 2026-02-12 | 13F | Principal Securities, Inc. | 0 | -100,00 | 0 | |||||
| 2026-02-11 | 13F | Deutsche Bank Ag\ | 378.758 | 9.003 | ||||||
| 2026-02-12 | 13F | Jane Street Group, Llc | 0 | -100,00 | 0 | -100,00 | ||||
| 2026-01-29 | 13F | China Universal Asset Management Co., Ltd. | 2.000 | 48 | ||||||
| 2026-02-12 | 13F | Jane Street Group, Llc | Put | 341.100 | 453,73 | 8.108 | 909,59 | |||
| 2026-02-12 | 13F | Jane Street Group, Llc | Call | 1.084.200 | 796,77 | 25.771 | 1.535,22 | |||
| 2026-02-17 | 13F | Public Employees Retirement System Of Ohio | 4.872 | -13,37 | 116 | 57,53 | ||||
| 2025-11-07 | 13F | Vanguard Group Inc | 0 | -100,00 | 0 | -100,00 | ||||
| 2026-02-17 | 13F | Schonfeld Strategic Advisors LLC | 0 | -100,00 | 0 | -100,00 | ||||
| 2026-02-17 | 13F | Jump Financial, LLC | 145.645 | -14,07 | 3.462 | 56,61 | ||||
| 2026-01-26 | 13F | KBC Group NV | 123.626 | 0,00 | 3 | 100,00 | ||||
| 2026-02-17 | 13F | Susquehanna Portfolio Strategies, LLC | 67.107 | 0,00 | 1.595 | 82,29 | ||||
| 2025-11-14 | 13F | Financial Network Wealth Management LLC | 0 | -100,00 | 0 | |||||
| 2026-04-21 | 13F | Guinness Asset Management LTD | 319.334 | 0,91 | 4.423 | -42,52 | ||||
| 2026-01-22 | 13F | Harwood Advisory Group, LLC | 28 | 1 | ||||||
| 2026-02-09 | 13F | Legal & General Group Plc | 1.523.837 | -25,71 | 36.224 | 35,47 | ||||
| 2026-02-10 | 13F | Nomura Asset Management Co Ltd | 3.400 | 0,00 | 81 | 81,82 | ||||
| 2026-02-06 | 13F | Gsa Capital Partners Llp | 0 | -100,00 | 0 | |||||
| 2026-01-27 | 13F | Zurcher Kantonalbank (Zurich Cantonalbank) | 6.880 | 43,45 | 164 | 162,90 | ||||
| 2026-02-11 | 13F | Inceptionr Llc | 0 | -100,00 | 0 | -100,00 | ||||
| 2026-02-05 | 13F | Center for Financial Planning, Inc. | 5 | 0,00 | 0 | |||||
| 2026-02-17 | 13F | Jones Financial Companies Lllp | 804 | 0,00 | 19 | 90,00 | ||||
| 2026-02-17 | 13F | Northern Trust Corp | 37.853 | 165,06 | 900 | 383,33 | ||||
| 2026-02-17 | 13F | Cape Investment Advisory, Inc. | 0 | -100,00 | 0 | |||||
| 2025-11-13 | 13F | Arkhouse Management Co. LP | 0 | -100,00 | 0 | |||||
| 2026-02-13 | 13F | Squarepoint Ops LLC | 29.960 | -18,64 | 712 | 48,33 | ||||
| 2026-02-17 | 13F | Greenland Capital Management LP | Put | 0 | -100,00 | 0 | ||||
| 2026-04-16 | 13F | SG Americas Securities, LLC | 61.210 | -37,19 | 1 | -100,00 | ||||
| 2026-01-21 | 13F | Crews Bank & Trust | 500 | 0,00 | 12 | 83,33 | ||||
| 2026-02-10 | 13F | Quantbot Technologies LP | 22.271 | -82,29 | 529 | -67,72 | ||||
| 2026-02-13 | 13F | Squarepoint Ops LLC | Call | 8.800 | 209 | |||||
| 2026-04-21 | 13F | Guinness Atkinson Asset Management Inc | 21.899 | 0,00 | 303 | -43,05 | ||||
| 2026-02-13 | 13F | Squarepoint Ops LLC | Put | 37.100 | -55,08 | 882 | -18,20 | |||
| 2026-04-02 | 13F | Byrne Asset Management LLC | 8.797 | -80,33 | 122 | -88,61 | ||||
| 2026-01-27 | 13F | Waterfront Wealth Inc. | 82.836 | -49,62 | 1.822 | -21,34 | ||||
| 2026-02-17 | 13F | Point72 Asset Management, L.P. | Put | 192.200 | 4.569 | |||||
| 2026-02-17 | 13F | Point72 Asset Management, L.P. | Call | 272.900 | 6.487 | |||||
| 2026-02-09 | 13F | Huntington National Bank | 100 | 0,00 | 2 | 100,00 | ||||
| 2026-02-12 | 13F | Bank Of Montreal /can/ | 21.407 | 75,34 | 509 | 219,50 | ||||
| 2026-02-13 | 13F | Umb Bank N A/mo | 100 | 2 | ||||||
| 2026-02-13 | 13F | National Bank Of Canada /fi/ | Call | 0 | -100,00 | 0 | -100,00 | |||
| 2026-02-17 | 13F | Cetera Investment Advisers | 16.399 | -56,26 | 390 | -20,29 | ||||
| 2026-02-17 | 13F | Nomura Holdings Inc | 264.784 | 6.294 | ||||||
| 2026-02-17 | 13F | Nomura Holdings Inc | Call | 376.000 | 8.938 | |||||
| 2026-02-13 | 13F | Caxton Associates Llp | 55.212 | 1.312 | ||||||
| 2026-02-12 | 13F | CoreCommodity Management, LLC | 28.001 | -61,91 | 666 | -30,58 | ||||
| 2026-02-18 | 13F/A | Robotti Robert | 342.570 | -28,07 | 8.143 | 31,11 | ||||
| 2026-02-13 | 13F | National Bank Of Canada /fi/ | Put | 0 | -100,00 | 0 | -100,00 | |||
| 2026-02-12 | 13F | Counterpoint Mutual Funds LLC | 0 | -100,00 | 0 | -100,00 | ||||
| 2026-02-17 | 13F | Advisor Group Holdings, Inc. | 245 | -35,19 | 6 | 66,67 | ||||
| 2026-02-17 | 13F | Point72 Asset Management, L.P. | 167.713 | 3.987 | ||||||
| 2026-02-17 | 13F | DZ BANK AG Deutsche Zentral Genossenschafts Bank, Frankfurt am Main | 2.473 | -63,50 | 61 | -28,24 | ||||
| 2026-02-11 | 13F | Cerity Partners LLC | 265.511 | -27,03 | 6.311 | 33,00 | ||||
| 2026-02-19 | 13F | Invesco Ltd. | 2.095.909 | -4,76 | 49.820 | 73,61 | ||||
| 2026-02-17 | 13F | Bank Of America Corp /de/ | 272.876 | 91,32 | 6.486 | 248,90 | ||||
| 2026-02-17 | 13F | D. E. Shaw & Co., Inc. | 2.678.941 | 409,13 | 63.678 | 828,12 | ||||
| 2026-02-13 | 13F | Marshall Wace, Llp | 112.094 | 433,07 | 2.664 | 872,26 | ||||
| 2026-02-17 | 13F | D. E. Shaw & Co., Inc. | Put | 81.600 | -8,52 | 1.940 | 66,72 | |||
| 2026-02-17 | 13F | Guggenheim Capital Llc | 47.487 | -48,71 | 1.129 | -6,55 | ||||
| 2026-02-13 | 13F | MAI Capital Management | 65 | 0,00 | 2 | |||||
| 2026-02-23 | 13F | Virtu Financial LLC | 17.245 | 0 | ||||||
| 2026-02-17 | 13F | D. E. Shaw & Co., Inc. | Call | 602.600 | 20,96 | 14.324 | 120,49 | |||
| 2026-02-13 | 13F | American Century Companies Inc | 21.291 | 0,63 | 506 | 84,00 | ||||
| 2025-11-14 | 13F | Tower Research Capital LLC (TRC) | 0 | -100,00 | 0 | -100,00 | ||||
| 2026-02-13 | 13F | Rhumbline Advisers | 758 | 658,00 | 18 | 1.700,00 | ||||
| 2026-02-17 | 13F | Css Llc/il | Put | 27.600 | 0,00 | 656 | 82,73 | |||
| 2026-02-17 | 13F | Css Llc/il | 25.437 | -5,92 | 605 | 71,59 | ||||
| 2026-02-11 | 13F | Simplex Trading, Llc | Call | 333.200 | -0,54 | 7.920 | 197.900,00 | |||
| 2026-02-10 | 13F | Ritter Daniher Financial Advisory LLC / DE | 1.110 | 26 | ||||||
| 2026-02-11 | 13F | Simplex Trading, Llc | Put | 199.800 | 98,02 | 4.749 | 474.800,00 | |||
| 2026-04-14 | 13F | Prospera Financial Services Inc | 26.535 | -3,43 | 367 | -43,80 | ||||
| 2026-01-27 | 13F | TD Waterhouse Canada Inc. | 0 | -100,00 | 0 | -100,00 | ||||
| 2026-02-03 | 13F/A | Bank Of America Corp /de/ | Put | 0 | -100,00 | 0 | -100,00 | |||
| 2026-02-17 | 13F | Two Sigma Investments, Lp | 1.133.276 | 28,02 | 26.938 | 133,36 | ||||
| 2025-11-07 | 13F | Shell Asset Management Co | 0 | -100,00 | 0 | |||||
| 2026-02-12 | 13F | Logan Capital Management Inc | 0 | -100,00 | 0 | |||||
| 2026-02-17 | 13F | Jain Global LLC | 37.234 | 179,53 | 885 | 411,56 | ||||
| 2026-02-17 | 13F | Two Sigma Advisers, Lp | 422.800 | 55,61 | 10.050 | 183,71 | ||||
| 2026-02-17 | 13F | Quadrature Capital Ltd | 36.320 | 863 | ||||||
| 2026-02-04 | 13F | Wsfs Capital Management, Llc | 24.650 | 0,00 | 586 | 82,24 | ||||
| 2026-02-03 | 13F | SBI Securities Co., Ltd. | 799 | 17,33 | 19 | 125,00 | ||||
| 2026-02-12 | 13F | BRYN MAWR TRUST Co | 50 | 0,00 | 1 | |||||
| 2026-02-05 | 13F | DnB Asset Management AS | 0 | -100,00 | 0 | |||||
| 2025-11-14 | 13F | Raymond James Financial Inc | 0 | -100,00 | 0 | -100,00 | ||||
| 2026-02-13 | 13F | Pinpoint Asset Management (Singapore) Pte. Ltd. | 54.005 | 619,78 | 1.284 | 1.222,68 | ||||
| 2026-02-11 | 13F | USCF Advisers LLC | 2.500 | 0,00 | 59 | 84,38 | ||||
| 2026-02-17 | 13F | Susquehanna Fundamental Investments, Llc | 84.279 | -20,48 | 2.003 | 45,04 | ||||
| 2026-02-17 | 13F | Prelude Capital Management, Llc | 16.252 | 386 | ||||||
| 2026-02-13 | 13F | Walleye Capital LLC | Put | 68.100 | 18,85 | 1.619 | 116,60 | |||
| 2026-02-13 | 13F | Pathstone Holdings, LLC | 24.172 | -0,92 | 575 | 80,50 | ||||
| 2026-02-13 | 13F | Walleye Capital LLC | 18 | -99,64 | 0 | -100,00 | ||||
| 2026-03-04 | 13F | Leonteq Securities AG | 0 | -100,00 | 0 | |||||
| 2026-02-13 | 13F | Walleye Capital LLC | Call | 123.300 | 37,46 | 2.931 | 150,64 | |||
| 2026-02-10 | 13F | Daiwa Securities Group Inc. | 22.400 | 21,08 | 1 | |||||
| 2026-02-13 | 13F | Charles Schwab Investment Management Inc | 217.400 | -14,15 | 5.168 | 56,48 | ||||
| 2026-03-12 | 13F/A | Peak6 Llc | Put | 552.000 | 57,71 | 13.121 | 187,49 | |||
| 2026-03-12 | 13F/A | Peak6 Llc | Call | 661.300 | 520,94 | 15.719 | 1.032,49 | |||
| 2026-02-13 | 13F | Bank Of Nova Scotia | 24.472 | -0,16 | 581 | 82,13 | ||||
| 2026-02-13 | 13F | Ubs Oconnor Llc | 47.962 | 1.140 | ||||||
| 2026-01-22 | 13F | Hager Investment Management Services, Llc | 50 | 0,00 | 1 | |||||
| 2026-02-12 | 13F | Hrt Financial Lp | 0 | -100,00 | 0 | |||||
| 2026-04-07 | 13F | CoreCap Advisors, LLC | 975 | 14 | ||||||
| 2026-01-26 | 13F | Cwm, Llc | 52 | 0 | ||||||
| 2026-02-13 | 13F | Wells Fargo & Company/mn | 4.609 | 8,37 | 110 | 98,18 | ||||
| 2026-02-17 | 13F | Caption Management, LLC | Call | 154.900 | 3.682 | |||||
| 2025-11-12 | 13F | IvyRock Asset Management (HK) Ltd | 0 | -100,00 | 0 | |||||
| 2026-02-03 | 13F | Winch Advisory Services, LLC | 30 | 0,00 | 1 | |||||
| 2026-01-27 | 13F | WealthCollab, LLC | 130 | 0,00 | 3 | 200,00 | ||||
| 2026-04-07 | 13F | Farther Finance Advisors, LLC | 105 | -88,46 | 1 | -95,24 | ||||
| 2025-11-10 | 13F | Greenwoods Asset Management Hong Kong Ltd. | 0 | -100,00 | 0 | |||||
| 2026-02-17 | 13F | Royal Bank Of Canada | 7.790 | -63,77 | 185 | -33,93 | ||||
| 2026-04-15 | 13F | Polunin Capital Partners Ltd | 2.001.869 | -0,39 | 26 | -41,86 | ||||
| 2025-11-14 | 13F | Sig Brokerage, Lp | Put | 0 | -100,00 | 0 | -100,00 | |||
| 2026-02-06 | 13F | GPS Wealth Strategies Group, LLC | 0 | -100,00 | 0 | |||||
| 2026-02-17 | 13F | Signature Equity Partners, LLC | 31 | 1 | ||||||
| 2026-04-22 | 13F | Stone House Investment Management, LLC | 30 | 0 | ||||||
| 2026-02-13 | 13F | Templeton & Phillips Capital Management, LLC | 0 | -100,00 | 0 | |||||
| 2026-02-10 | 13F/A | Northwestern Mutual Wealth Management Co | 1.560 | 0,00 | 37 | 85,00 | ||||
| 2026-02-13 | 13F | Quarry LP | 2.261 | 54 | ||||||
| 2026-02-17 | 13F | XTX Topco Ltd | 12.819 | -87,21 | 305 | -76,72 | ||||
| 2026-04-07 | 13F | Green Alpha Advisors, LLC | 37.998 | -2,02 | 526 | -42,89 | ||||
| 2026-02-06 | 13F | Larson Financial Group LLC | 204 | 5 | ||||||
| 2026-02-10 | 13F | IAG Wealth Partners, LLC | 167 | 0,00 | 4 | 50,00 | ||||
| 2025-11-14 | 13F | Cubist Systematic Strategies, LLC | Call | 0 | -100,00 | 0 | -100,00 | |||
| 2026-04-15 | 13F | Gf Fund Management Co. Ltd. | 0 | -100,00 | 0 | |||||
| 2026-04-24 | 13F | Shah Capital Management | 964.557 | -0,56 | 13.359 | -42,06 | ||||
| 2026-02-11 | 13F | Jpmorgan Chase & Co | 160.339 | -71,96 | 3.811 | -48,89 |