Grundlæggende statistik
| Institutionelle aktier (lange) | 24.005.739 - 14,95% (ex 13D/G) - change of -0,50MM shares -6,22% MRQ |
| Institutionel værdi (lang) | $ 618.819 USD ($1000) |
Institutionelt ejerskab og aktionærer
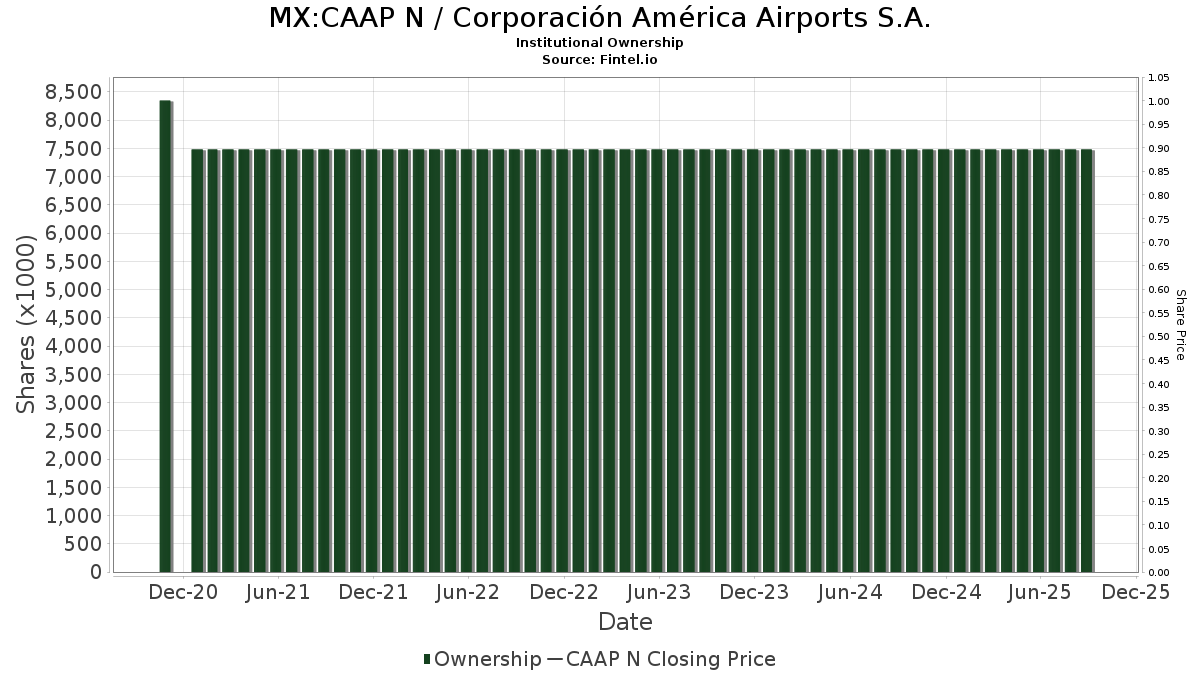
Corporación América Airports S.A. (MX:CAAP N) har 98 institutionelle ejere og aktionærer, der har indsendt 13D/G- eller 13F-formularer til Securities Exchange Commission (SEC). Disse institutioner har i alt 24,005,739 aktier. Største aktionærer omfatter Helikon Investments Ltd, BlackRock, Inc., Goldman Sachs Group Inc, Royal Bank Of Canada, Bnp Paribas Arbitrage, Sa, MIRAE ASSET GLOBAL ETFS HOLDINGS Ltd., Jpmorgan Chase & Co, Morgan Stanley, Standard Life Aberdeen plc, and State Street Corp .
Corporación América Airports S.A. (BMV:CAAP N) institutionel ejerskabsstruktur viser aktuelle positioner i virksomheden efter institutioner og fonde, samt seneste ændringer i positionsstørrelse. Større aktionærer kan omfatte individuelle investorer, investeringsforeninger, hedgefonde eller institutioner. Skema 13D angiver, at investoren besidder (eller besidder) mere end 5 % af virksomheden og har til hensigt (eller har til hensigt at) aktivt at forfølge en ændring i forretningsstrategi. Skema 13G indikerer en passiv investering på over 5%.
Fondens stemningsscore
Fund Sentiment Score (fka Ownership Accumulation Score) finder de aktier, der bliver mest købt af fonde. Det er resultatet af en sofistikeret, multi-faktor kvantitativ model, der identificerer virksomheder med de højeste niveauer af institutionel akkumulering. Scoringsmodellen bruger en kombination af den samlede stigning i oplyste ejere, ændringerne i porteføljeallokeringer i disse ejere og andre målinger. Tallet går fra 0 til 100, hvor højere tal indikerer et højere niveau af akkumulering for sine jævnaldrende, og 50 er gennemsnittet.
Opdateringsfrekvens: Dagligt
Se Ownership Explorer, som giver en liste over højest rangerende virksomheder.
AI+ Ask Fintel’s AI assistant about Corporación América Airports S.A..
Select a question to share a public post with an AI-crafted answer.
Thinking of good questions…
13F og NPORT arkivering
Detaljer om 13F-arkivering er gratis. Detaljer om NP-ansøgninger kræver et premium-medlemskab. Grønne rækker angiver nye positioner. Røde rækker angiver lukkede positioner. Klik på linket ikon for at se den fulde transaktionshistorik.
Opgrader
for at låse premium-data op og eksportere til Excel ![]() .
.
| Fil dato | Kilde | Investor | Type | Gennemsnitlig pris (Øst) |
Aktier | Δ Aktier (%) |
Rapporteret Værdi ($1000) |
Δ Værdi (%) |
Port Alloc (%) |
|
|---|---|---|---|---|---|---|---|---|---|---|
| 2026-02-06 | 13F | Larson Financial Group LLC | 182 | 5 | ||||||
| 2026-02-05 | 13F | Helikon Investments Ltd | 13.565.960 | 1,01 | 352.715 | 44,94 | ||||
| 2026-02-09 | 13F | Malaga Cove Capital, LLC | 71.427 | -5,36 | 1.857 | 35,84 | ||||
| 2026-02-13 | 13F | Wells Fargo & Company/mn | 460 | 38,14 | 12 | 83,33 | ||||
| 2026-04-23 | 13F | SJS Investment Consulting Inc. | 19 | 11,76 | 0 | |||||
| 2026-02-17 | 13F | State Of Wisconsin Investment Board | 16.370 | 426 | ||||||
| 2025-11-10 | 13F | Options Solutions, Llc | 0 | -100,00 | 0 | |||||
| 2025-11-14 | 13F | Point72 Europe (London) LLP | 164 | 3 | ||||||
| 2026-04-29 | 13F | Standard Life Aberdeen plc | 396.965 | -9,89 | 10.039 | -12,35 | ||||
| 2026-02-11 | 13F | Jpmorgan Chase & Co | 650.757 | 5,28 | 16.920 | 51,06 | ||||
| 2026-02-17 | 13F | Raymond James Financial Inc | 90.812 | 20,82 | 2.361 | 73,48 | ||||
| 2026-02-17 | 13F | Altrinsic Global Advisors Llc | 35.254 | -1,53 | 917 | 41,36 | ||||
| 2026-02-17 | 13F | Schonfeld Strategic Advisors LLC | 21.192 | 551 | ||||||
| 2026-04-27 | 13F | Fideuram - Intesa Sanpaolo Private Banking S.p.a. | 10.000 | 0,00 | 253 | -3,08 | ||||
| 2026-02-12 | 13F | BlackRock, Inc. | 1.531.906 | 6,27 | 39.830 | 52,48 | ||||
| 2025-11-14 | 13F | Wolverine Trading, Llc | Call | 11.200 | 206 | |||||
| 2026-02-18 | 13F | Mackenzie Financial Corp | 25.288 | 13,32 | 663 | 63,86 | ||||
| 2026-02-17 | 13F | Mirabella Financial Services Llp | 11.470 | 298 | ||||||
| 2025-11-14 | 13F | Point72 Asia (Singapore) Pte. Ltd. | 379 | 7 | ||||||
| 2025-11-14 | 13F | National Bank Of Canada /fi/ | 0 | -100,00 | 0 | |||||
| 2026-02-11 | 13F | Group One Trading, L.p. | 0 | -100,00 | 0 | -100,00 | ||||
| 2026-02-17 | 13F | Stokes Family Office, LLC | 222.325 | -0,04 | 5.780 | 43,42 | ||||
| 2026-04-15 | 13F | Merit Financial Group, LLC | 9.472 | 240 | ||||||
| 2026-02-17 | 13F | Jump Financial, LLC | 12.700 | -14,67 | 330 | 22,68 | ||||
| 2026-02-18 | 13F/A | Empowered Funds, LLC | 243.987 | 37,08 | 6.344 | 96,68 | ||||
| 2026-02-02 | 13F | Principal Financial Group Inc | 53.984 | 8,98 | 1.404 | 56,41 | ||||
| 2026-04-28 | 13F | Golden State Wealth Management, LLC | 0 | -100,00 | 0 | |||||
| 2026-02-06 | 13F | Pnc Financial Services Group, Inc. | 19 | -5,00 | 0 | |||||
| 2026-02-11 | 13F | Group One Trading, L.p. | Call | 10.000 | 0,00 | 260 | 43,65 | |||
| 2026-02-13 | 13F | Meixler Investment Management, Ltd. | 52.652 | -9,91 | 1.369 | 29,18 | ||||
| 2025-11-14 | 13F | Tower Research Capital LLC (TRC) | 0 | -100,00 | 0 | |||||
| 2026-02-10 | 13F | State of Wyoming | 3.661 | -79,49 | 95 | -70,59 | ||||
| 2026-04-27 | 13F | Rwc Asset Advisors (us) Llc | 82.327 | 0,00 | 2.082 | -2,71 | ||||
| 2025-11-13 | 13F | Invesco Ltd. | 0 | -100,00 | 0 | |||||
| 2026-04-17 | 13F | LMG Wealth Partners, LLC | 103.239 | 0,40 | 2.611 | -2,36 | ||||
| 2026-02-12 | 13F | Federation des caisses Desjardins du Quebec | 5.980 | 15,04 | 155 | 64,89 | ||||
| 2026-02-17 | 13F | Qube Research & Technologies Ltd | 120.427 | -12,08 | 3.131 | 26,20 | ||||
| 2026-02-17 | 13F | Two Sigma Investments, Lp | 8.674 | -54,94 | 226 | -35,34 | ||||
| 2026-02-06 | 13F | EverSource Wealth Advisors, LLC | 71 | 82,05 | 2 | |||||
| 2026-02-13 | 13F | Centiva Capital, LP | 0 | -100,00 | 0 | |||||
| 2026-02-13 | 13F | Toroso Investments, LLC | 0 | -100,00 | 0 | |||||
| 2026-02-13 | 13F | Morgan Stanley | 485.041 | 39,09 | 12.611 | 99,60 | ||||
| 2026-02-17 | 13F | Russell Investments Group, Ltd. | 43.080 | -27,17 | 1.120 | 4,58 | ||||
| 2026-02-12 | 13F | Bank Of Montreal /can/ | 8.674 | -15,88 | 226 | 20,97 | ||||
| 2025-11-14 | 13F | Susquehanna International Group, Llp | Put | 0 | -100,00 | 0 | -100,00 | |||
| 2026-02-13 | 13F | Rhumbline Advisers | 6.200 | -6,06 | 161 | 35,29 | ||||
| 2026-01-23 | 13F | Assetmark, Inc | 3 | 0,00 | 0 | |||||
| 2026-02-11 | 13F | Inceptionr Llc | 0 | -100,00 | 0 | |||||
| 2026-04-21 | 13F | PharVision Advisers, LLC | 0 | -100,00 | 0 | |||||
| 2026-02-14 | 13F | Militia Capital Partners, LP | 161.000 | 0,00 | 4.186 | 43,50 | ||||
| 2026-01-26 | 13F | Cwm, Llc | 0 | -100,00 | 0 | |||||
| 2026-02-13 | 13F | LRT Capital Management, LLC | 0 | -100,00 | 0 | |||||
| 2025-10-31 | 13F | BCJ Capital Management, LLC | 0 | -100,00 | 0 | |||||
| 2026-02-17 | 13F | Royal Bank Of Canada | 799.456 | -3,61 | 20.786 | 38,31 | ||||
| 2026-02-13 | 13F | Dynamic Technology Lab Private Ltd | 0 | -100,00 | 0 | |||||
| 2026-02-17 | 13F | Advisor Group Holdings, Inc. | 597 | 77,15 | 16 | 150,00 | ||||
| 2025-11-12 | 13F | Allianz Se | 0 | -100,00 | 0 | |||||
| 2026-02-05 | 13F | Baader Bank INC | 10.000 | 260 | ||||||
| 2026-02-13 | 13F | Walleye Capital LLC | 0 | -100,00 | 0 | |||||
| 2026-04-14 | 13F | Nbc Securities, Inc. | 11.212 | 0,80 | 284 | -2,08 | ||||
| 2026-02-12 | 13F | Jane Street Group, Llc | 13.812 | -91,09 | 359 | -87,22 | ||||
| 2026-02-06 | 13F | Gsa Capital Partners Llp | 23.766 | -57,11 | 1 | -100,00 | ||||
| 2026-02-17 | 13F | Tudor Investment Corp Et Al | 63.313 | -37,89 | 1.646 | -10,88 | ||||
| 2026-02-13 | 13F | Verition Fund Management LLC | 10.600 | -60,25 | 276 | -43,06 | ||||
| 2026-02-10 | 13F | Daiwa Securities Group Inc. | 2.057 | -24,07 | 0 | |||||
| 2026-02-10 | 13F | Bnp Paribas Arbitrage, Sa | 752.402 | 52,09 | 19.562 | 118,23 | ||||
| 2026-02-13 | 13F | State Street Corp | 380.707 | 3,61 | 9.898 | 48,69 | ||||
| 2026-01-16 | 13F | Formidable Asset Management, LLC | 0 | -100,00 | 0 | |||||
| 2026-02-11 | 13F | Simplex Trading, Llc | Call | 4.000 | 53,85 | 104 | ||||
| 2026-02-09 | 13F | HBK Sorce Advisory LLC | 22.000 | 0,00 | 636 | 59,55 | ||||
| 2026-04-27 | 13F | Ping Capital Management, Inc. | 74.000 | 59,14 | 1.871 | 54,76 | ||||
| 2026-02-11 | 13F | Simplex Trading, Llc | 2.379 | 74,16 | 62 | |||||
| 2026-04-07 | 13F | Farther Finance Advisors, LLC | 139 | 131,67 | 4 | 200,00 | ||||
| 2026-02-13 | 13F | Quarry LP | 1.382 | -76,80 | 36 | -67,29 | ||||
| 2026-02-13 | 13F | Mariner, LLC | 13.873 | 5,68 | 361 | 51,90 | ||||
| 2026-04-27 | 13F | RWC Asset Management LLP | 75.387 | 0,00 | 1.907 | -2,76 | ||||
| 2026-02-17 | 13F | Lazard Asset Management Llc | 70.962 | 1.845 | ||||||
| 2026-02-17 | 13F | MIRAE ASSET GLOBAL ETFS HOLDINGS Ltd. | 709.330 | 2,03 | 18.443 | 46,38 | ||||
| 2026-02-11 | 13F | Metis Global Partners, LLC | 36.738 | 28,98 | 955 | 85,08 | ||||
| 2026-02-17 | 13F | Engineers Gate Manager LP | 20.266 | -43,11 | 527 | -18,45 | ||||
| 2026-04-27 | 13F | Y-Intercept (Hong Kong) Ltd | 10.738 | -51,29 | 272 | -52,71 | ||||
| 2025-11-05 | 13F | Davy Global Fund Management Ltd | 0 | -100,00 | 0 | -100,00 | ||||
| 2025-11-14 | 13F | Cubist Systematic Strategies, LLC | 67.817 | 253,03 | 1.229 | 215,68 | ||||
| 2026-02-10 | 13F | Thoroughbred Financial Services, Llc | 46.964 | 0,98 | 1 | |||||
| 2026-02-17 | 13F | Bank Of America Corp /de/ | 28.463 | 47,62 | 740 | 112,03 | ||||
| 2026-02-17 | 13F | Susquehanna Fundamental Investments, Llc | 0 | -100,00 | 0 | |||||
| 2026-04-21 | 13F | Vise Technologies, Inc. | 14.598 | 0,00 | 380 | 0,00 | ||||
| 2026-02-17 | 13F | Apis Capital Advisors, LLC | 0 | -100,00 | 0 | |||||
| 2026-04-24 | 13F | Sage Investment Counsel LLC | 12.400 | 0,00 | 314 | -2,80 | ||||
| 2026-02-17 | 13F | Citadel Advisors Llc | Call | 28.500 | 37,02 | 741 | 97,07 | |||
| 2026-02-17 | 13F | Citadel Advisors Llc | 41.129 | -73,46 | 1.069 | -61,92 | ||||
| 2026-02-17 | 13F | Northern Trust Corp | 50.545 | -0,70 | 1.314 | 42,52 | ||||
| 2025-11-14 | 13F | Fourth Sail Capital LP | 0 | -100,00 | 0 | |||||
| 2026-02-04 | 13F | Independent Advisor Alliance | 11.269 | 293 | ||||||
| 2026-04-28 | 13F | Stratos Wealth Partners, LTD. | 93.174 | -0,34 | 2.356 | -3,05 | ||||
| 2026-02-13 | 13F | Citigroup Inc | 0 | -100,00 | 0 | |||||
| 2026-02-10 | 13F | Quantbot Technologies LP | 4.630 | -68,20 | 120 | -54,37 | ||||
| 2026-02-13 | 13F | Van Eck Associates Corp | 2.808 | 119,38 | 0 | |||||
| 2026-02-13 | 13F | Marshall Wace, Llp | 0 | -100,00 | 0 | -100,00 | ||||
| 2026-01-30 | 13F | Pekin Hardy Strauss, Inc. | 23.715 | 72,28 | 617 | 147,39 | ||||
| 2026-04-27 | 13F | Leonteq Securities AG | 0 | -100,00 | 0 | |||||
| 2026-02-17 | 13F | Aqr Capital Management Llc | 62.328 | -7,01 | 1.621 | 33,44 | ||||
| 2026-02-12 | 13F | Polen Capital Management Llc | 0 | -100,00 | 0 | |||||
| 2026-02-17 | 13F | Boothbay Fund Management, Llc | 9.188 | 239 | ||||||
| 2026-02-17 | 13F | Canada Pension Plan Investment Board | 63.613 | 0,00 | 1.654 | 43,49 | ||||
| 2026-02-11 | 13F | Deutsche Bank Ag\ | 46.084 | -18,90 | 1.198 | 16,42 | ||||
| 2026-02-17 | 13F | HighVista Strategies LLC | 37.145 | -47,98 | 966 | -25,37 | ||||
| 2026-02-17 | 13F | D. E. Shaw & Co., Inc. | 62.366 | -28,97 | 1.622 | 1,89 | ||||
| 2026-02-10 | 13F | Goldman Sachs Group Inc | 1.271.822 | 2,38 | 33.067 | 46,91 | ||||
| 2026-02-17 | 13F | Susquehanna International Group, Llp | 27.652 | -63,70 | 719 | -47,97 | ||||
| 2026-02-17 | 13F | Susquehanna International Group, Llp | Call | 10.500 | -29,53 | 273 | 1,49 | |||
| 2026-02-18 | 13F | GWM Advisors LLC | 15 | 0 | ||||||
| 2026-01-29 | 13F | UBS Group AG | 98.036 | 207,10 | 2.549 | 340,83 | ||||
| 2026-02-12 | 13F | Campbell & CO Investment Adviser LLC | 12.172 | 316 | ||||||
| 2026-02-03 | 13F | SBI Securities Co., Ltd. | 0 | -100,00 | 0 | |||||
| 2026-02-13 | 13F | Vontobel Holding Ltd. | 0 | -100,00 | 0 | |||||
| 2026-04-20 | 13F | Assenagon Asset Management S.A. | 105.613 | 2.671 | ||||||
| 2026-02-17 | 13F | Aquatic Capital Management LLC | 0 | -100,00 | 0 | |||||
| 2026-02-17 | 13F | Millennium Management Llc | 75.743 | -59,08 | 1.969 | -41,28 | ||||
| 2026-02-12 | 13F | Empirical Finance, LLC | 243.987 | 37,08 | 6.344 | 96,68 | ||||
| 2026-02-17 | 13F | PDT Partners, LLC | 46.503 | -1,06 | 1.209 | 42,07 | ||||
| 2026-02-17 | 13F | Fred Alger Management, Llc | 19.266 | 501 | ||||||
| 2026-02-10 | 13F | Acadian Asset Management Llc | 1.617 | 0 | ||||||
| 2026-02-12 | 13F | Hrt Financial Lp | 80.140 | 18,81 | 2 | 100,00 | ||||
| 2026-02-13 | 13F | Smartleaf Asset Management LLC | 229 | 6 | ||||||
| 2026-02-11 | 13F | Invst, LLC | 27.788 | -6,61 | 722 | 33,95 | ||||
| 2026-04-20 | 13F | Kestra Private Wealth Services, Llc | 25.234 | 87,99 | 638 | 83,33 | ||||
| 2026-02-09 | 13F | Blue Bell Private Wealth Management, Llc | 52 | -49,51 | 1 | 0,00 | ||||
| 2026-02-17 | 13F | Point72 Asset Management, L.P. | 120.797 | 3.141 | ||||||
| 2026-04-20 | 13F | Yorktown Management & Research Co Inc | 13.600 | 0,00 | 344 | -2,83 |
Other Listings
| US:CAAP | 25,02 $ |