Grundlæggende statistik
| Institutionelle ejere | 73 total, 68 long only, 1 short only, 4 long/short - change of -16,22% MRQ |
| Gennemsnitlig porteføljeallokering | 0.0706 % - change of -29,49% MRQ |
| Institutionelle aktier (lange) | 16.944.426 (ex 13D/G) - change of -1,61MM shares -17,03% MRQ |
| Institutionel værdi (lang) | $ 301.805 USD ($1000) |
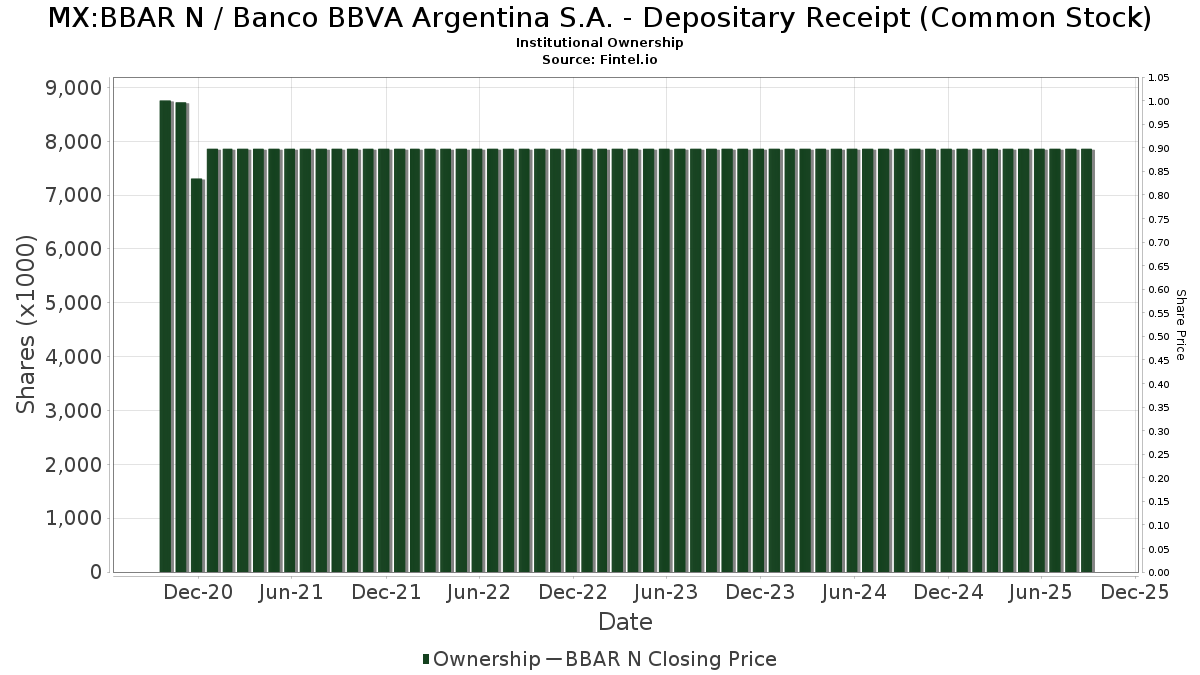
Institutionelt ejerskab og aktionærer
Banco BBVA Argentina S.A. - Depositary Receipt (Common Stock) (MX:BBAR N) har 73 institutionelle ejere og aktionærer, der har indsendt 13D/G- eller 13F-formularer til Securities Exchange Commission (SEC). Disse institutioner har i alt 16,944,426 aktier. Største aktionærer omfatter Fourth Sail Capital LP, PointState Capital LP, Morgan Stanley, MIRAE ASSET GLOBAL ETFS HOLDINGS Ltd., Samlyn Capital, Llc, Aquamarine Financial (Cayman) Ltd, Ping Capital Management, Inc., Susquehanna International Group, Llp, Westwood Global Investments, LLC, and Millennium Management Llc .
Banco BBVA Argentina S.A. - Depositary Receipt (Common Stock) (BMV:BBAR N) institutionel ejerskabsstruktur viser aktuelle positioner i virksomheden efter institutioner og fonde, samt seneste ændringer i positionsstørrelse. Større aktionærer kan omfatte individuelle investorer, investeringsforeninger, hedgefonde eller institutioner. Skema 13D angiver, at investoren besidder (eller besidder) mere end 5 % af virksomheden og har til hensigt (eller har til hensigt at) aktivt at forfølge en ændring i forretningsstrategi. Skema 13G indikerer en passiv investering på over 5%.
Fondens stemningsscore
Fund Sentiment Score (fka Ownership Accumulation Score) finder de aktier, der bliver mest købt af fonde. Det er resultatet af en sofistikeret, multi-faktor kvantitativ model, der identificerer virksomheder med de højeste niveauer af institutionel akkumulering. Scoringsmodellen bruger en kombination af den samlede stigning i oplyste ejere, ændringerne i porteføljeallokeringer i disse ejere og andre målinger. Tallet går fra 0 til 100, hvor højere tal indikerer et højere niveau af akkumulering for sine jævnaldrende, og 50 er gennemsnittet.
Opdateringsfrekvens: Dagligt
Se Ownership Explorer, som giver en liste over højest rangerende virksomheder.
AI+ Ask Fintel’s AI assistant about Banco BBVA Argentina S.A. - Depositary Receipt (Common Stock).
Select a question to share a public post with an AI-crafted answer.
Thinking of good questions…
13F og NPORT arkivering
Detaljer om 13F-arkivering er gratis. Detaljer om NP-ansøgninger kræver et premium-medlemskab. Grønne rækker angiver nye positioner. Røde rækker angiver lukkede positioner. Klik på linket ikon for at se den fulde transaktionshistorik.
Opgrader
for at låse premium-data op og eksportere til Excel ![]() .
.
| Fil dato | Kilde | Investor | Type | Gennemsnitlig pris (Øst) |
Aktier | Δ Aktier (%) |
Rapporteret Værdi ($1000) |
Δ Værdi (%) |
Port Alloc (%) |
|
|---|---|---|---|---|---|---|---|---|---|---|
| 2026-02-17 | 13F | State Of Wisconsin Investment Board | 74.184 | 1.341 | ||||||
| 2026-02-02 | 13F | Ping Capital Management, Inc. | 780.900 | -25,66 | 14.111 | 61,44 | ||||
| 2026-02-05 | 13F | Northwestern Mutual Wealth Management Co | 2.171 | 54.175,00 | 95 | |||||
| 2026-02-17 | 13F | Bank Of America Corp /de/ | 43.615 | -39,24 | 788 | 31,99 | ||||
| 2026-01-27 | 13F | WealthCollab, LLC | 1.909 | 0,00 | 34 | 126,67 | ||||
| 2026-04-07 | 13F | Farther Finance Advisors, LLC | 109 | 0,00 | 2 | 0,00 | ||||
| 2026-01-28 | 13F | Kapitalo Investimentos Ltda | 0 | -100,00 | 0 | |||||
| 2026-04-15 | 13F | Activest Wealth Management | 55.787 | 38,89 | 896 | 23,45 | ||||
| 2025-11-13 | 13F | Arrowstreet Capital, Limited Partnership | 0 | -100,00 | 0 | |||||
| 2026-01-30 | 13F | Glenorchy Capital Ltd | 248.865 | -4,91 | 4.497 | 106,57 | ||||
| 2025-11-19 | 13F | Caitong International Asset Management Co., Ltd | 0 | -100,00 | 0 | |||||
| 2026-02-17 | 13F | Tower Research Capital LLC (TRC) | 473 | -88,45 | 9 | -76,47 | ||||
| 2026-02-13 | 13F | Van Eck Associates Corp | 8.304 | 0 | ||||||
| 2026-02-17 | 13F | Schonfeld Strategic Advisors LLC | 12.374 | 224 | ||||||
| 2026-04-22 | 13F | Stone House Investment Management, LLC | 9 | 0 | ||||||
| 2026-02-13 | 13F | Morgan Stanley | 1.742.164 | 10,09 | 31.481 | 139,10 | ||||
| 2026-02-17 | 13F | Susquehanna International Group, Llp | Call | 655.000 | 42,33 | 11.836 | 209,17 | |||
| 2026-02-17 | 13F | Price T Rowe Associates Inc /md/ | 39.830 | 26,24 | 1 | |||||
| 2026-02-11 | 13F | Fox Run Management, L.l.c. | 25.272 | 457 | ||||||
| 2026-02-17 | 13F | Susquehanna International Group, Llp | Put | 224.500 | -16,36 | 4.057 | 81,64 | |||
| 2026-02-13 | 13F | Citigroup Inc | 148.082 | 2.676 | ||||||
| 2025-11-12 | 13F | Gemsstock Ltd. | 0 | -100,00 | 0 | |||||
| 2025-11-14 | 13F | Wolverine Trading, Llc | Put | 21.000 | 187 | |||||
| 2026-02-13 | 13F | Peak6 Llc | Call | 0 | -100,00 | 0 | ||||
| 2026-02-06 | 13F | EverSource Wealth Advisors, LLC | 481 | -0,21 | 9 | 100,00 | ||||
| 2026-02-17 | 13F | MIRAE ASSET GLOBAL ETFS HOLDINGS Ltd. | 1.507.642 | -0,48 | 27.243 | 116,16 | ||||
| 2025-11-12 | 13F | Itau Unibanco Holding S.A. | 0 | -100,00 | 0 | |||||
| 2026-02-10 | 13F | Goldman Sachs Group Inc | 488.439 | 41,86 | 8.826 | 208,17 | ||||
| 2025-11-14 | 13F | Centiva Capital, LP | 0 | -100,00 | 0 | |||||
| 2026-02-13 | 13F | Smartleaf Asset Management LLC | 39 | 1 | ||||||
| 2026-02-17 | 13F | Millennium Management Llc | 613.832 | 3.633,77 | 11.092 | 8.055,15 | ||||
| 2026-02-12 | 13F | Federation des caisses Desjardins du Quebec | 0 | -100,00 | 0 | |||||
| 2026-02-17 | 13F | Samlyn Capital, Llc | 1.284.869 | -33,92 | 23.218 | 43,52 | ||||
| 2026-02-17 | 13F | Voleon Capital Management Lp | 65.226 | 64,13 | 1.179 | 256,97 | ||||
| 2026-01-29 | 13F | UBS Group AG | Put | 3.200 | -93,98 | 58 | -87,10 | |||
| 2026-01-29 | 13F | UBS Group AG | 245.096 | 7,35 | 4.429 | 133,18 | ||||
| 2026-02-17 | 13F | Mirabella Financial Services Llp | 22.595 | 408 | ||||||
| 2026-02-13 | 13F | Wells Fargo & Company/mn | 16.826 | 263,73 | 304 | 700,00 | ||||
| 2026-02-13 | 13F | Y-Intercept (Hong Kong) Ltd | 0 | -100,00 | 0 | |||||
| 2025-11-12 | 13F | 10Elms LLP | 0 | -100,00 | 0 | -100,00 | ||||
| 2026-02-13 | 13F | Verition Fund Management LLC | 98.474 | -58,89 | 1.779 | -10,69 | ||||
| 2026-02-11 | 13F | Simplex Trading, Llc | 38.322 | 172,81 | 692 | |||||
| 2026-02-13 | 13F | Fourth Sail Capital LP | 2.847.061 | 6,66 | 51.446 | 131,66 | ||||
| 2026-02-10 | 13F | Bnp Paribas Arbitrage, Sa | 23.648 | -58,85 | 427 | -10,67 | ||||
| 2026-02-17 | 13F | Point72 Asset Management, L.P. | 0 | -100,00 | 0 | |||||
| 2026-02-17 | 13F | Jump Financial, LLC | 0 | -100,00 | 0 | |||||
| 2026-01-26 | 13F | JGP Global Gestao de Recursos Ltda. | 12.800 | 231 | ||||||
| 2026-04-07 | 13F | Signaturefd, Llc | 113 | 0,00 | 2 | -50,00 | ||||
| 2025-11-14 | 13F | Two Sigma Investments, Lp | 0 | -100,00 | 0 | |||||
| 2026-04-06 | 13F | GAMMA Investing LLC | 1.636 | -33,74 | 26 | -40,91 | ||||
| 2025-10-27 | 13F | Belvedere Trading LLC | Call | 0 | -100,00 | 0 | -100,00 | |||
| 2025-11-12 | 13F | TCG Advisory Services, LLC | 0 | -100,00 | 0 | |||||
| 2026-02-12 | 13F | Jane Street Group, Llc | Put | 13.800 | -83,00 | 249 | -63,11 | |||
| 2026-02-12 | 13F | Jane Street Group, Llc | Call | 17.900 | -89,28 | 323 | -76,73 | |||
| 2026-02-02 | 13F | Truist Financial Corp | 0 | -100,00 | 0 | |||||
| 2026-02-17 | 13F | Citadel Advisors Llc | Put | 166.700 | -35,86 | 3.012 | 39,32 | |||
| 2026-02-12 | 13F | Jane Street Group, Llc | 15.909 | 287 | ||||||
| 2026-02-17 | 13F | Citadel Advisors Llc | Call | 144.000 | -14,54 | 2.602 | 85,72 | |||
| 2026-02-17 | 13F | Advisor Group Holdings, Inc. | 379 | 23,86 | 7 | 200,00 | ||||
| 2026-02-10 | 13F | Quantbot Technologies LP | 1.756 | 32 | ||||||
| 2025-11-17 | 13F | GWM Advisors LLC | 0 | -100,00 | 0 | |||||
| 2026-02-17 | 13F | PointState Capital LP | 2.668.038 | 60,53 | 48.211 | 248,65 | ||||
| 2026-02-12 | 13F | Banco BTG Pactual S.A. | 14.724 | 266 | ||||||
| 2026-02-17 | 13F | D. E. Shaw & Co., Inc. | 73.324 | -80,61 | 1.325 | -57,91 | ||||
| 2026-02-06 | 13F | Larson Financial Group LLC | 126 | 2 | ||||||
| 2026-02-17 | 13F | Graham Capital Management, L.P. | 0 | -100,00 | 0 | |||||
| 2026-04-20 | 13F | Ronald Blue Trust, Inc. | 2.268 | 0,00 | 36 | -10,00 | ||||
| 2026-02-12 | 13F | Commonwealth Equity Services, Llc | 11.436 | -11,09 | 207 | |||||
| 2026-03-06 | 13F | Hsbc Holdings Plc | 11.977 | -80,41 | 216 | -58,25 | ||||
| 2026-04-20 | 13F | North of South Capital LLP | 30.000 | 0,00 | 482 | -11,25 | ||||
| 2026-02-13 | 13F | Ubs Oconnor Llc | 0 | -100,00 | 0 | |||||
| 2026-04-24 | 13F | TT International Asset Management LTD | 118.702 | -34,62 | 1.906 | 63.433,33 | ||||
| 2026-02-26 | 13F/A | Alpine Global Management, LLC | 223.697 | 4.042 | ||||||
| 2026-02-17 | 13F | Brevan Howard Capital Management LP | 204.133 | 137,97 | 3.696 | 411,07 | ||||
| 2025-11-14 | 13F | Sofos Investments, Inc. | 0 | -100,00 | 0 | |||||
| 2026-02-13 | 13F | Marshall Wace, Llp | 0 | -100,00 | 0 | |||||
| 2026-01-09 | 13F | SG Americas Securities, LLC | 0 | -100,00 | 0 | |||||
| 2026-02-17 | 13F | NorthRock Partners, LLC | 34.998 | 0,00 | 632 | 117,18 | ||||
| 2026-02-11 | 13F | Jpmorgan Chase & Co | 12.692 | -95,59 | 229 | -90,43 | ||||
| 2026-01-21 | 13F/A | Steadtrust LLC | 0 | -100,00 | 0 | |||||
| 2026-02-02 | 13F | Benjamin Edwards Inc | 24.330 | -6,68 | 440 | 103,24 | ||||
| 2026-02-17 | 13F | Aquatic Capital Management LLC | 0 | -100,00 | 0 | |||||
| 2026-02-17 | 13F | Advisory Services Network, LLC | 0 | -100,00 | 0 | |||||
| 2026-02-03 | 13F | SBI Securities Co., Ltd. | 1.227 | -13,89 | 22 | 100,00 | ||||
| 2026-02-05 | 13F | Baader Bank INC | 19.000 | 35,71 | 343 | 195,69 | ||||
| 2026-02-10 | 13F | Westwood Global Investments, LLC | 618.642 | 11.179 | ||||||
| 2026-02-17 | 13F | Qube Research & Technologies Ltd | 0 | -100,00 | 0 | |||||
| 2026-02-17 | 13F | Engineers Gate Manager LP | 0 | -100,00 | 0 | |||||
| 2026-02-17 | 13F | GAM Holding AG | 49.361 | 70,45 | 892 | 271,25 | ||||
| 2026-04-09 | 13F | Crocodile Capital Partners GmbH | 40.000 | 0,00 | 723 | 0,00 | ||||
| 2026-02-11 | 13F | Group One Trading, L.p. | 0 | -100,00 | 0 | |||||
| 2026-02-17 | 13F | Nwi Management Lp | 63.000 | 0,00 | 1 | |||||
| 2026-01-28 | 13F | Aquamarine Financial (Cayman) Ltd | 1.141.305 | 103,80 | 20.623 | 342,65 | ||||
| 2026-04-24 | 13F | Deltec Asset Management Llc | 72.500 | -5,23 | 1.164 | -15,77 | ||||
| 2026-02-12 | 13F | BlackRock, Inc. | 2 | 0,00 | 0 | |||||
| 2025-11-13 | 13F | Private Advisor Group, LLC | 0 | -100,00 | 0 | |||||
| 2026-02-23 | 13F | Virtu Financial LLC | 0 | -100,00 | 0 | |||||
| 2026-01-08 | 13F | Chesapeake Asset Management Llc | 67.900 | 0,00 | 1.227 | 117,38 | ||||
| 2025-11-14 | 13F | Vident Advisory, LLC | 0 | -100,00 | 0 | |||||
| 2026-02-17 | 13F | XTX Topco Ltd | 14.494 | -7,55 | 262 | 100,77 | ||||
| 2025-11-12 | 13F | William Blair Investment Management, Llc | 0 | -100,00 | 0 | |||||
| 2026-02-12 | 13F | Hrt Financial Lp | 20.720 | 82,72 | 0 | |||||
| 2025-11-14 | 13F | Cubist Systematic Strategies, LLC | 140.195 | -3,40 | 1.166 | -51,17 | ||||
| 2026-02-10 | 13F | Channing Global Advisors, Llc | 28.045 | 507 | ||||||
| 2026-04-22 | 13F | Clear Creek Financial Management, LLC | 46.666 | 15,46 | 749 | 2,60 | ||||
| 2026-02-17 | 13F | Voloridge Investment Management, Llc | 257.666 | -44,40 | 4.656 | 20,75 | ||||
| 2025-11-14 | 13F | Public Employees Retirement System Of Ohio | 0 | -100,00 | 0 | -100,00 | ||||
| 2026-02-17 | 13F | Citadel Advisors Llc | 0 | -100,00 | 0 | |||||
| 2026-02-17 | 13F | Royal Bank Of Canada | 3.994 | 8,15 | 72 | 132,26 | ||||
| 2025-11-14 | 13F | Susquehanna International Group, Llp | 0 | -100,00 | 0 | -100,00 | ||||
| 2026-02-12 | 13F | Insigneo Advisory Services, Llc | 0 | -100,00 | 0 | |||||
| 2026-02-17 | 13F | Discovery Capital Management, Llc / Ct | 448.100 | 8.097 | ||||||
| 2026-02-17 | 13F | Two Sigma Advisers, Lp | 0 | -100,00 | 0 | |||||
| 2026-04-23 | 13F | North Star Investment Management Corp. | 1.000 | 0,00 | 16 | -11,11 | ||||
| 2026-02-13 | 13F | Barclays Plc | 10.973 | 77,99 | 198 | 288,24 | ||||
| 2026-01-12 | 13F | Systrade AG | 0 | -100,00 | 0 |