Grundlæggende statistik
| Institutionelle aktier (lange) | 15.413.923 - 16,48% (ex 13D/G) - change of 0,04MM shares 0,27% MRQ |
| Institutionel værdi (lang) | $ 27.987 USD ($1000) |
Institutionelt ejerskab og aktionærer
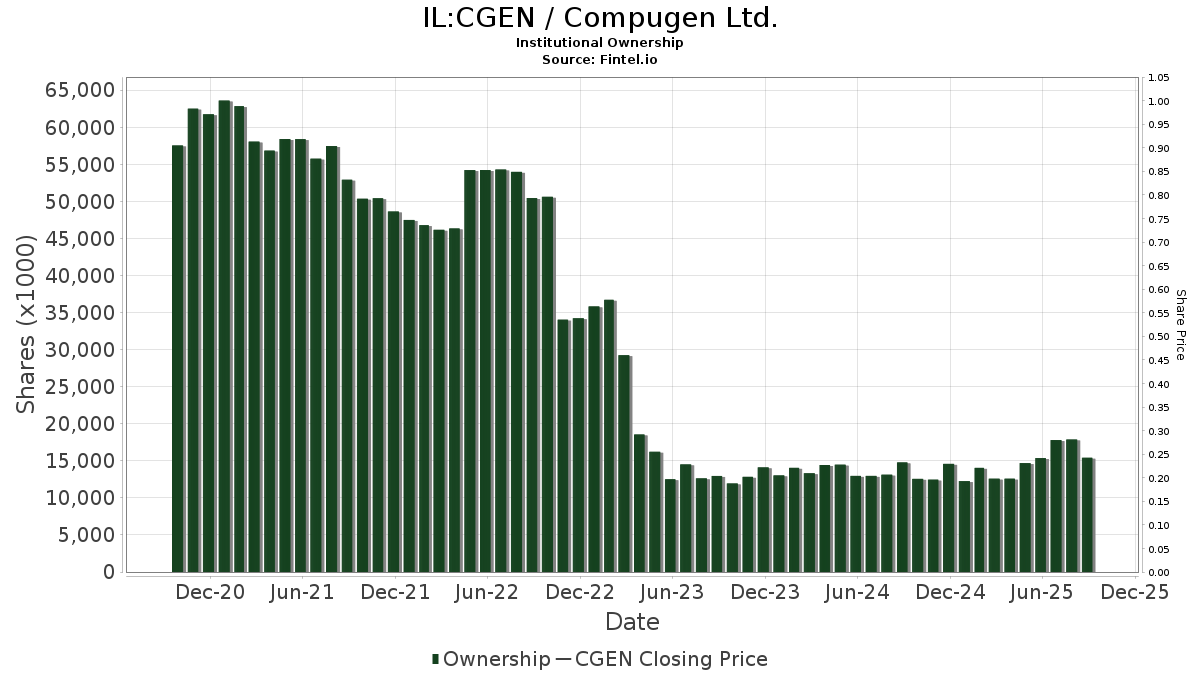
Compugen Ltd. (IL:CGEN) har 74 institutionelle ejere og aktionærer, der har indsendt 13D/G- eller 13F-formularer til Securities Exchange Commission (SEC). Disse institutioner har i alt 15,413,923 aktier. Største aktionærer omfatter Silverarc Capital Management, Llc, Renaissance Technologies Llc, Morgan Stanley, ARK Investment Management LLC, Macquarie Group Ltd, Taylor Frigon Capital Management LLC, Rock Springs Capital Management LP, Northern Trust Corp, Millennium Management Llc, and Jane Street Group, Llc .
Compugen Ltd. (TASE:CGEN) institutionel ejerskabsstruktur viser aktuelle positioner i virksomheden efter institutioner og fonde, samt seneste ændringer i positionsstørrelse. Større aktionærer kan omfatte individuelle investorer, investeringsforeninger, hedgefonde eller institutioner. Skema 13D angiver, at investoren besidder (eller besidder) mere end 5 % af virksomheden og har til hensigt (eller har til hensigt at) aktivt at forfølge en ændring i forretningsstrategi. Skema 13G indikerer en passiv investering på over 5%.
Fondens stemningsscore
Fund Sentiment Score (fka Ownership Accumulation Score) finder de aktier, der bliver mest købt af fonde. Det er resultatet af en sofistikeret, multi-faktor kvantitativ model, der identificerer virksomheder med de højeste niveauer af institutionel akkumulering. Scoringsmodellen bruger en kombination af den samlede stigning i oplyste ejere, ændringerne i porteføljeallokeringer i disse ejere og andre målinger. Tallet går fra 0 til 100, hvor højere tal indikerer et højere niveau af akkumulering for sine jævnaldrende, og 50 er gennemsnittet.
Opdateringsfrekvens: Dagligt
Se Ownership Explorer, som giver en liste over højest rangerende virksomheder.
13F og NPORT arkivering
Detaljer om 13F-arkivering er gratis. Detaljer om NP-ansøgninger kræver et premium-medlemskab. Grønne rækker angiver nye positioner. Røde rækker angiver lukkede positioner. Klik på linket ikon for at se den fulde transaktionshistorik.
Opgrader
for at låse premium-data op og eksportere til Excel ![]() .
.
| Fil dato | Kilde | Investor | Type | Gennemsnitlig pris (Øst) |
Aktier | Δ Aktier (%) |
Rapporteret Værdi ($1000) |
Δ Værdi (%) |
Port Alloc (%) |
|
|---|---|---|---|---|---|---|---|---|---|---|
| 2025-08-13 | 13F | Philadelphia Trust Co | 15.000 | 0,00 | 0 | |||||
| 2025-08-14 | 13F | Citadel Advisors Llc | Put | 32.100 | -33,54 | 57 | -18,57 | |||
| 2025-08-14 | 13F | Glenmede Investment Management, LP | 12.000 | 21 | ||||||
| 2025-04-29 | 13F | Envestnet Asset Management Inc | 0 | -100,00 | 0 | |||||
| 2025-08-07 | 13F | Allworth Financial LP | 270 | 0,00 | 0 | |||||
| 2025-08-14 | 13F | Stifel Financial Corp | 53.455 | 2,36 | 95 | 25,00 | ||||
| 2025-08-14 | 13F | Citadel Advisors Llc | 235.654 | -31,78 | 419 | -16,87 | ||||
| 2025-08-14 | 13F | Citadel Advisors Llc | Call | 57.800 | 112,50 | 103 | 161,54 | |||
| 2025-08-14 | 13F | Group One Trading, L.p. | Put | 17.600 | -73,41 | 31 | -67,71 | |||
| 2025-08-13 | 13F | Marshall Wace, Llp | 0 | -100,00 | 0 | |||||
| 2025-08-14 | 13F | Group One Trading, L.p. | Call | 24.300 | 0,00 | 43 | 22,86 | |||
| 2025-05-15 | 13F | Tower Research Capital LLC (TRC) | 0 | -100,00 | 0 | |||||
| 2025-08-14 | 13F | Goldman Sachs Group Inc | 87.511 | 50,19 | 156 | 82,35 | ||||
| 2025-07-23 | 13F | Eagle Rock Investment Company, Llc | 71.212 | 0,00 | 127 | 22,33 | ||||
| 2025-07-17 | 13F | Stockman Wealth Management, Inc. | 16.000 | 0,00 | 28 | 21,74 | ||||
| 2025-08-06 | 13F | Commonwealth Equity Services, Llc | 22.706 | 0,00 | 0 | |||||
| 2025-08-18 | 13F | N.E.W. Advisory Services LLC | 400 | 0,00 | 1 | |||||
| 2025-07-17 | 13F | Sound Income Strategies, LLC | 500 | 0,00 | 1 | |||||
| 2025-08-06 | 13F | Yelin Lapidot Holdings Management Ltd. | 318.852 | 0,00 | 568 | 21,94 | ||||
| 2025-07-31 | 13F | Caitong International Asset Management Co., Ltd | 91 | 0 | ||||||
| 2025-08-07 | 13F | Connor, Clark & Lunn Investment Management Ltd. | 0 | -100,00 | 0 | -100,00 | ||||
| 2025-08-27 | 13F/A | Squarepoint Ops LLC | 199.000 | -33,67 | 354 | -19,18 | ||||
| 2025-07-29 | NP | JISAX - International Small Company Fund Class NAV | 8.996 | 0,00 | 13 | -23,53 | ||||
| 2025-07-31 | 13F | Cambridge Investment Research Advisors, Inc. | 11.250 | -2,39 | 0 | |||||
| 2025-07-23 | 13F | Joel Isaacson & Co., LLC | 12.000 | 0,00 | 21 | 23,53 | ||||
| 2025-07-24 | 13F | Jfs Wealth Advisors, Llc | 0 | -100,00 | 0 | |||||
| 2025-08-14 | 13F | Bank Of America Corp /de/ | 43.658 | -6,20 | 78 | 14,93 | ||||
| 2025-08-14 | 13F | DAFNA Capital Management LLC | 272.402 | 0,00 | 485 | 21,91 | ||||
| 2025-07-18 | 13F | Ewa, Llc | 60.688 | -6,98 | 108 | 13,68 | ||||
| 2025-05-15 | 13F | Glenmede Trust Co Na | 12.000 | -56,36 | 18 | -59,52 | ||||
| 2025-07-08 | NP | TFCGX - Taylor Frigon Core Growth Fund | 242.969 | 0,00 | 357 | -23,39 | ||||
| 2025-08-14 | 13F | Millennium Management Llc | 395.748 | 0,33 | 704 | 22,43 | ||||
| 2025-08-14 | 13F | UBS Group AG | 290.425 | -0,05 | 517 | 21,70 | ||||
| 2025-08-08 | 13F | Pnc Financial Services Group, Inc. | 2.800 | 0,00 | 5 | 0,00 | ||||
| 2025-08-12 | 13F | Jpmorgan Chase & Co | 1.346 | -71,31 | 2 | -66,67 | ||||
| 2025-08-08 | 13F | SBI Securities Co., Ltd. | 338 | 0,00 | 1 | |||||
| 2025-07-29 | 13F | Calamos Wealth Management LLC | 29.500 | 0,00 | 53 | 20,93 | ||||
| 2025-05-15 | 13F | Barclays Plc | 0 | -100,00 | 0 | |||||
| 2025-08-14 | 13F | Susquehanna International Group, Llp | 19.839 | 28,04 | 35 | 59,09 | ||||
| 2025-08-13 | 13F | Northern Trust Corp | 889.716 | 0,96 | 1.584 | 23,09 | ||||
| 2025-08-12 | 13F | Franklin Resources Inc | 31.726 | 56 | ||||||
| 2025-07-24 | 13F | Eastern Bank | 2.000 | 0,00 | 4 | 50,00 | ||||
| 2025-08-08 | 13F | Geode Capital Management, Llc | 50.395 | 0,00 | 90 | 21,92 | ||||
| 2025-08-15 | 13F | Koesten, Hirschmann & Crabtree, INC. | 100 | 0,00 | 0 | |||||
| 2025-08-14 | 13F | Two Sigma Advisers, Lp | 163.484 | 53,96 | 291 | 87,74 | ||||
| 2025-08-15 | 13F | Morgan Stanley | 1.314.116 | -5,27 | 2.339 | 15,51 | ||||
| 2025-08-12 | 13F | Proequities, Inc. | Put | 0 | 0 | |||||
| 2025-08-12 | 13F | Proequities, Inc. | Call | 0 | 0 | |||||
| 2025-08-12 | 13F | Proequities, Inc. | 0 | 0 | ||||||
| 2025-08-15 | 13F | Kestra Advisory Services, LLC | 21.559 | -48,05 | 38 | -36,67 | ||||
| 2025-08-11 | 13F | Rothschild Investment Llc | 181.400 | -5,22 | 302 | 8,24 | ||||
| 2025-08-12 | 13F | LPL Financial LLC | 12.378 | -7,47 | 22 | 15,79 | ||||
| 2025-08-11 | 13F | TD Waterhouse Canada Inc. | 2.000 | 0,00 | 3 | 50,00 | ||||
| 2025-08-14 | 13F | State Street Corp | 351.179 | 2,05 | 625 | 24,50 | ||||
| 2025-08-14 | 13F | C M Bidwell & Associates Ltd | 358 | 0,00 | 1 | |||||
| 2025-08-14 | 13F | Ieq Capital, Llc | 30.000 | 50,00 | 53 | 82,76 | ||||
| 2025-08-08 | 13F | Kingsview Wealth Management, LLC | 83.179 | 0,00 | 148 | 22,31 | ||||
| 2025-08-13 | 13F | Renaissance Technologies Llc | 1.327.100 | -4,89 | 2.362 | 15,95 | ||||
| 2025-07-17 | 13F | Janney Montgomery Scott LLC | 28.200 | -3,42 | 0 | |||||
| 2025-08-14 | 13F | Raymond James Financial Inc | 67.041 | 0,00 | 119 | 22,68 | ||||
| 2025-07-25 | 13F | JustInvest LLC | 11.690 | 0,00 | 21 | 17,65 | ||||
| 2025-08-14 | 13F | Mariner, LLC | 11.690 | 0,00 | 21 | 17,65 | ||||
| 2025-08-14 | 13F | Cubist Systematic Strategies, LLC | 10.154 | -36,78 | 18 | -21,74 | ||||
| 2025-08-14 | 13F | Group One Trading, L.p. | 0 | -100,00 | 0 | -100,00 | ||||
| 2025-08-05 | 13F | Simplex Trading, Llc | Put | 16.500 | -78,37 | 0 | ||||
| 2025-08-05 | 13F | Simplex Trading, Llc | 6.591 | -89,99 | 0 | |||||
| 2025-08-05 | 13F | Simplex Trading, Llc | Call | 15.600 | 51,46 | 0 | ||||
| 2025-08-14 | 13F | Royal Bank Of Canada | 14.600 | 26 | ||||||
| 2025-05-15 | 13F | Hrt Financial Lp | 0 | -100,00 | 0 | |||||
| 2025-07-10 | 13F | Secure Asset Management, LLC | 41.345 | 0,00 | 74 | 21,67 | ||||
| 2025-07-09 | 13F | GSG Advisors LLC | 10.245 | 0,00 | 18 | 38,46 | ||||
| 2025-04-01 | 13F | Modus Advisors, LLC | 0 | -100,00 | 0 | |||||
| 2025-08-14 | 13F | Two Sigma Investments, Lp | 178.946 | -23,46 | 319 | -6,74 | ||||
| 2025-05-12 | 13F | Citigroup Inc | 0 | -100,00 | 0 | |||||
| 2025-07-30 | 13F | ARK Investment Management LLC | 1.072.776 | 20,58 | 1.785 | 34,95 | ||||
| 2025-04-11 | 13F | City State Bank | 0 | -100,00 | 0 | |||||
| 2025-08-14 | 13F | Jane Street Group, Llc | 393.191 | 1.077,01 | 700 | 1.356,25 | ||||
| 2025-08-14 | 13F | Rock Springs Capital Management LP | 989.990 | 0,00 | 1.762 | 21,94 | ||||
| 2025-08-14 | 13F | Silverarc Capital Management, Llc | 3.033.879 | 4,78 | 5.400 | 27,75 | ||||
| 2025-08-12 | 13F | Steward Partners Investment Advisory, Llc | 5.202 | 0,00 | 9 | 28,57 | ||||
| 2025-07-17 | 13F | Taylor Frigon Capital Management LLC | 994.647 | -5,21 | 1.770 | 15,61 | ||||
| 2025-08-14 | 13F | Vident Advisory, LLC | 0 | -100,00 | 0 | |||||
| 2025-07-24 | 13F | Us Bancorp \de\ | 0 | -100,00 | 0 | |||||
| 2025-07-31 | 13F | Oppenheimer & Co Inc | 17.050 | -69,88 | 30 | -63,41 | ||||
| 2025-08-07 | 13F | Addison Advisors LLC | 267 | 0,00 | 0 | |||||
| 2025-08-14 | 13F | Bnp Paribas Arbitrage, Sa | 3 | 0,00 | 0 | |||||
| 2025-05-15 | 13F | Sphera Funds Management Ltd. | 0 | -100,00 | 0 | -100,00 | ||||
| 2025-07-30 | 13F | Schnieders Capital Management Llc | 90.000 | 0,00 | 150 | 13,74 | ||||
| 2025-09-04 | 13F/A | Advisor Group Holdings, Inc. | 43.885 | 345,99 | 78 | 450,00 | ||||
| 2025-08-14 | 13F | Atom Investors LP | 329.519 | 0,04 | 587 | 22,08 | ||||
| 2025-08-05 | 13F | Harel Insurance Investments & Financial Services Ltd. | 1.598 | 0,00 | 0 | |||||
| 2025-05-29 | NP | JAJDX - International Small Company Trust NAV | 4.373 | 0,00 | 7 | 0,00 | ||||
| 2025-08-13 | 13F/A | Matrix Asset Advisors Inc/ny | 93.833 | 0,00 | 167 | 22,79 | ||||
| 2025-05-14 | 13F | Susquehanna International Group, Llp | Call | 0 | -100,00 | 0 | -100,00 | |||
| 2025-08-14 | 13F | Wells Fargo & Company/mn | 5.900 | -66,09 | 981 | 3.820,00 | ||||
| 2025-07-31 | 13F | R Squared Ltd | 40.008 | 71 | ||||||
| 2025-08-14 | 13F | Macquarie Group Ltd | 1.020.000 | 0,00 | 1.816 | 21,96 |
Other Listings
| US:CGEN | 1,40 $ |