Grundlæggende statistik
| Institutionelle aktier (lange) | 17.857.580 - 50,59% (ex 13D/G) - change of 1,87MM shares 11,73% MRQ |
| Institutionel værdi (lang) | $ 105.965 USD ($1000) |
Institutionelt ejerskab og aktionærer
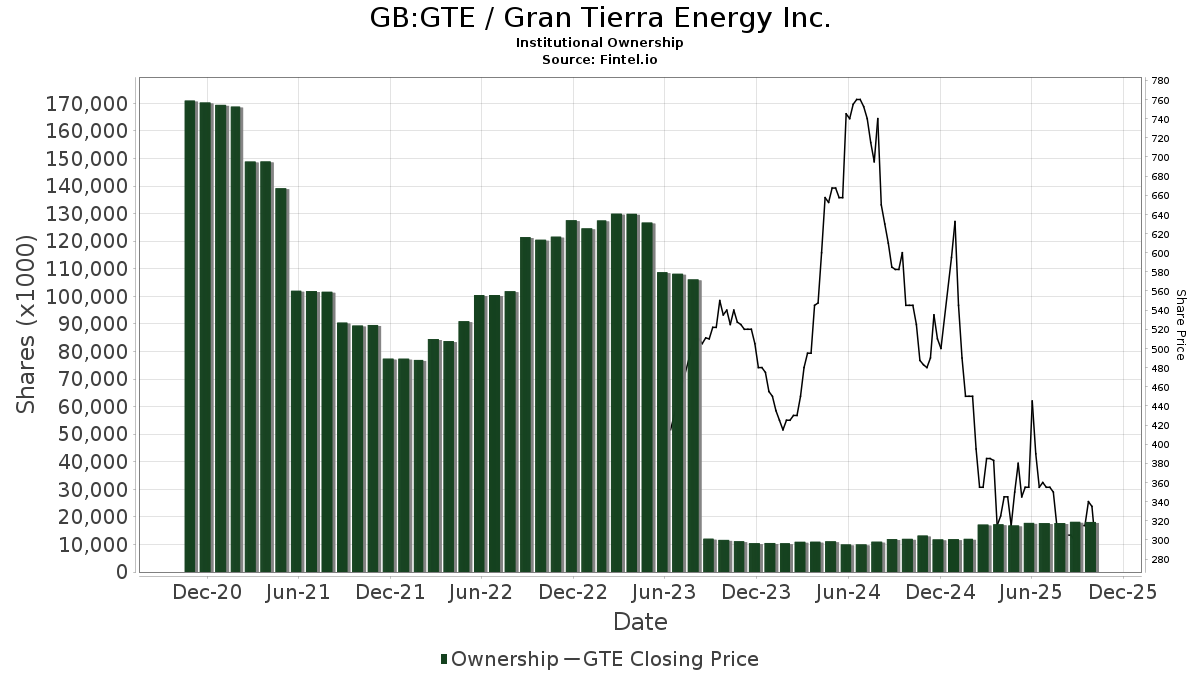
Gran Tierra Energy Inc. (GB:GTE) har 64 institutionelle ejere og aktionærer, der har indsendt 13D/G- eller 13F-formularer til Securities Exchange Commission (SEC). Disse institutioner har i alt 17,857,580 aktier. Største aktionærer omfatter Mason Hill Advisors Llc, LM Asset (IM) Inc., American Century Companies Inc, Renaissance Technologies Llc, Bridgeway Capital Management Inc, D. E. Shaw & Co., Inc., BlackRock, Inc., Connor, Clark & Lunn Investment Management Ltd., Point72 Asset Management, L.P., and Empowered Funds, LLC .
Gran Tierra Energy Inc. (LSE:GTE) institutionel ejerskabsstruktur viser aktuelle positioner i virksomheden efter institutioner og fonde, samt seneste ændringer i positionsstørrelse. Større aktionærer kan omfatte individuelle investorer, investeringsforeninger, hedgefonde eller institutioner. Skema 13D angiver, at investoren besidder (eller besidder) mere end 5 % af virksomheden og har til hensigt (eller har til hensigt at) aktivt at forfølge en ændring i forretningsstrategi. Skema 13G indikerer en passiv investering på over 5%.
The share price as of May 1, 2026 is 650,00 / share. Previously, on May 6, 2025, the share price was 325,00 / share. This represents an increase of 100,00% over that period.
Fondens stemningsscore
Fund Sentiment Score (fka Ownership Accumulation Score) finder de aktier, der bliver mest købt af fonde. Det er resultatet af en sofistikeret, multi-faktor kvantitativ model, der identificerer virksomheder med de højeste niveauer af institutionel akkumulering. Scoringsmodellen bruger en kombination af den samlede stigning i oplyste ejere, ændringerne i porteføljeallokeringer i disse ejere og andre målinger. Tallet går fra 0 til 100, hvor højere tal indikerer et højere niveau af akkumulering for sine jævnaldrende, og 50 er gennemsnittet.
Opdateringsfrekvens: Dagligt
Se Ownership Explorer, som giver en liste over højest rangerende virksomheder.
AI+ Ask Fintel’s AI assistant about Gran Tierra Energy Inc..
Select a question to share a public post with an AI-crafted answer.
Thinking of good questions…
13F og NPORT arkivering
Detaljer om 13F-arkivering er gratis. Detaljer om NP-ansøgninger kræver et premium-medlemskab. Grønne rækker angiver nye positioner. Røde rækker angiver lukkede positioner. Klik på linket ikon for at se den fulde transaktionshistorik.
Opgrader
for at låse premium-data op og eksportere til Excel ![]() .
.
| Fil dato | Kilde | Investor | Type | Gennemsnitlig pris (Øst) |
Aktier | Δ Aktier (%) |
Rapporteret Værdi ($1000) |
Δ Værdi (%) |
Port Alloc (%) |
|
|---|---|---|---|---|---|---|---|---|---|---|
| 2026-02-10 | 13F | Bnp Paribas Arbitrage, Sa | 29.510 | -43,22 | 125 | -44,69 | ||||
| 2026-01-29 | 13F | UBS Group AG | 117.116 | -4,19 | 497 | -6,59 | ||||
| 2026-02-10 | 13F | Connor, Clark & Lunn Investment Management Ltd. | 296.697 | -20,94 | 1.266 | -21,46 | ||||
| 2026-02-17 | 13F | Jones Financial Companies Lllp | 1.091 | -21,57 | 5 | -33,33 | ||||
| 2026-04-07 | 13F | Signaturefd, Llc | 924 | 8 | ||||||
| 2026-02-13 | 13F | American Century Companies Inc | 1.542.956 | 1,69 | 6.542 | -0,88 | ||||
| 2026-01-08 | 13F | Sanders Morris Harris Llc | 0 | -100,00 | 0 | |||||
| 2026-02-17 | 13F | Advisor Group Holdings, Inc. | 120 | -83,22 | 1 | -100,00 | ||||
| 2025-11-14 | 13F | Citadel Advisors Llc | Call | 0 | -100,00 | 0 | -100,00 | |||
| 2026-02-13 | 13F | Marshall Wace, Llp | 0 | -100,00 | 0 | |||||
| 2025-11-14 | 13F | Citadel Advisors Llc | Put | 0 | -100,00 | 0 | -100,00 | |||
| 2026-04-27 | 13F | Victory Financial Group, Llc | 0 | -100,00 | 0 | |||||
| 2026-02-12 | 13F | Renaissance Technologies Llc | 760.380 | -4,94 | 3.224 | -7,33 | ||||
| 2026-02-13 | 13F | Centiva Capital, LP | 23.909 | 0,91 | 101 | -1,94 | ||||
| 2026-02-06 | 13F | Gsa Capital Partners Llp | 0 | -100,00 | 0 | |||||
| 2026-02-17 | 13F | Citadel Advisors Llc | 238.735 | 769,74 | 1.012 | 750,42 | ||||
| 2026-04-24 | 13F | Mason Hill Advisors Llc | 6.381.471 | 0,00 | 57.242 | 111,56 | ||||
| 2026-02-17 | 13F | Two Sigma Investments, Lp | 209.164 | 103,23 | 887 | 98,21 | ||||
| 2026-02-17 | 13F | XTX Topco Ltd | 50.394 | 214 | ||||||
| 2026-04-29 | 13F | R Squared Ltd | 0 | -100,00 | 0 | |||||
| 2025-11-14 | 13F | Walleye Capital LLC | Call | 0 | -100,00 | 0 | ||||
| 2026-02-13 | 13F | Verition Fund Management LLC | 23.799 | 101 | ||||||
| 2026-02-17 | 13F | nVerses Capital, LLC | 19.882 | 84 | ||||||
| 2025-11-14 | 13F | Walleye Capital LLC | 0 | -100,00 | 0 | |||||
| 2026-02-11 | 13F | Group One Trading, L.p. | 24.813 | 3.597,91 | 105 | 5.150,00 | ||||
| 2025-11-14 | 13F | Walleye Capital LLC | Put | 0 | -100,00 | 0 | ||||
| 2026-04-15 | 13F | Exchange Traded Concepts, Llc | 26.356 | 236 | ||||||
| 2026-02-13 | 13F | Evelyn Partners Investment Management (Europe) Ltd | 1 | 0,00 | 0 | |||||
| 2026-02-17 | 13F | PDT Partners, LLC | 27.364 | 0,00 | 116 | -2,52 | ||||
| 2026-02-24 | 13F | DGS Capital Management, LLC | 0 | -100,00 | 0 | |||||
| 2026-02-10 | 13F | Goldman Sachs Group Inc | 147.221 | -21,64 | 624 | -23,62 | ||||
| 2026-02-17 | 13F | Two Sigma Advisers, Lp | 78.352 | 42,40 | 332 | 38,91 | ||||
| 2026-02-12 | 13F | Jane Street Group, Llc | Call | 0 | -100,00 | 0 | -100,00 | |||
| 2026-04-16 | 13F | SG Americas Securities, LLC | 17.159 | 0 | ||||||
| 2026-02-17 | 13F | Point72 Asset Management, L.P. | 246.326 | 1.044 | ||||||
| 2026-02-12 | 13F | Bank Of Montreal /can/ | 27.644 | 0,04 | 117 | -2,50 | ||||
| 2026-02-17 | 13F | Millennium Management Llc | 171.702 | 202,06 | 728 | 194,74 | ||||
| 2026-02-17 | 13F | Bank Of America Corp /de/ | 4.192 | -29,24 | 18 | -32,00 | ||||
| 2025-11-14 | 13F | Susquehanna International Group, Llp | Put | 0 | -100,00 | 0 | -100,00 | |||
| 2026-02-13 | 13F | LM Asset (IM) Inc. | 3.691.420 | 32,22 | 15.652 | 28,88 | ||||
| 2026-02-17 | 13F | Royal Bank Of Canada | 41.236 | -25,64 | 175 | -27,39 | ||||
| 2026-02-11 | 13F | Simplex Trading, Llc | 11.163 | 122,55 | 47 | |||||
| 2026-02-13 | 13F | National Bank Of Canada /fi/ | 3.210 | 11,61 | 19 | 5,88 | ||||
| 2026-02-17 | 13F | Rwc Asset Advisors (us) Llc | 0 | -100,00 | 0 | |||||
| 2026-04-15 | 13F | Activest Wealth Management | 61 | 0,00 | 1 | |||||
| 2025-11-12 | 13F | Steward Partners Investment Advisory, Llc | 0 | -100,00 | 0 | -100,00 | ||||
| 2026-02-17 | 13F | Cetera Investment Advisers | 50.787 | -4,13 | 215 | -6,52 | ||||
| 2026-04-24 | 13F | Medallion Wealth Advisors, LLC | 2 | 0,00 | 0 | |||||
| 2026-04-28 | 13F | Bogart Wealth, LLC | 7 | 0 | ||||||
| 2026-02-06 | 13F | Motco | 0 | -100,00 | 0 | |||||
| 2026-02-11 | 13F | Brandes Investment Partners, Lp | 63.869 | 0,00 | 271 | -2,53 | ||||
| 2025-11-14 | 13F | Tower Research Capital LLC (TRC) | 0 | -100,00 | 0 | -100,00 | ||||
| 2025-11-14 | 13F | Raymond James Financial Inc | 0 | -100,00 | 0 | -100,00 | ||||
| 2026-02-17 | 13F | D. E. Shaw & Co., Inc. | 472.021 | 351,87 | 2.001 | 340,75 | ||||
| 2026-02-17 | 13F | Prelude Capital Management, Llc | 202.534 | 859 | ||||||
| 2026-02-12 | 13F | Federation des caisses Desjardins du Quebec | 79 | -94,27 | 0 | -100,00 | ||||
| 2026-02-13 | 13F | Dynamic Technology Lab Private Ltd | 19.102 | 81 | ||||||
| 2026-02-12 | 13F | Hrt Financial Lp | 28.980 | 0 | ||||||
| 2026-04-28 | 13F | SBI Securities Co., Ltd. | 107 | 2.040,00 | 1 | |||||
| 2026-02-17 | 13F | Susquehanna Portfolio Strategies, LLC | 62.461 | 41,64 | 265 | 38,22 | ||||
| 2026-02-17 | 13F | Northern Trust Corp | 18.640 | 0,00 | 79 | -2,47 | ||||
| 2025-11-14 | 13F | Gmt Capital Corp | 0 | -100,00 | 0 | -100,00 | ||||
| 2026-02-13 | 13F | Citigroup Inc | 990 | -23,37 | 4 | -20,00 | ||||
| 2026-01-29 | 13F | Sanctuary Advisors, LLC | 0 | -100,00 | 0 | -100,00 | ||||
| 2026-02-12 | 13F | Jane Street Group, Llc | 214.231 | 468,12 | 908 | 453,66 | ||||
| 2025-11-14 | 13F | Engineers Gate Manager LP | 0 | -100,00 | 0 | |||||
| 2026-02-10 | 13F | CIBC World Markets Inc. | 31.336 | -1,00 | 133 | -3,65 | ||||
| 2026-02-13 | 13F | Arrowstreet Capital, Limited Partnership | 25.980 | 110 | ||||||
| 2026-02-17 | 13F | Cresset Asset Management, LLC | 65.850 | 0,00 | 279 | -2,45 | ||||
| 2026-02-17 | 13F | Bridgeway Capital Management Inc | 559.360 | 0,92 | 2.372 | -1,66 | ||||
| 2026-02-12 | 13F | Dimensional Fund Advisors Lp | 217.505 | 148,49 | 922 | 142,63 | ||||
| 2026-02-11 | 13F | Empowered Funds, LLC | 242.057 | -13,29 | 1.026 | -15,49 | ||||
| 2026-02-17 | 13F | Susquehanna International Group, Llp | 114.120 | 14,52 | 484 | 11,55 | ||||
| 2026-02-12 | 13F | BlackRock, Inc. | 334.153 | -5,19 | 1.417 | -7,63 | ||||
| 2026-02-17 | 13F | Jump Financial, LLC | 173.161 | 94,81 | 734 | 90,16 | ||||
| 2026-02-11 | 13F | RWC Asset Management LLP | 0 | -100,00 | 0 | |||||
| 2026-02-19 | 13F | Invesco Ltd. | 0 | -100,00 | 0 | |||||
| 2025-11-14 | 13F | Creative Planning | 0 | -100,00 | 0 | |||||
| 2026-02-17 | 13F | Janus Henderson Group Plc | 168.883 | 0,00 | 704 | -1,68 | ||||
| 2025-11-14 | 13F | Skopos Labs, Inc. | 0 | -100,00 | 0 | |||||
| 2025-11-14 | 13F | Cubist Systematic Strategies, LLC | 134.953 | 80,45 | 587 | 64,89 | ||||
| 2026-02-17 | 13F | Graham Capital Management, L.P. | 53.431 | 227 | ||||||
| 2026-04-30 | 13F | Hsbc Holdings Plc | 26.783 | -26,39 | 247 | 58,71 | ||||
| 2026-02-13 | 13F | Wells Fargo & Company/mn | 65 | 0,00 | 0 | |||||
| 2026-02-17 | 13F | Optiver Holding B.V. | 10 | 0,00 | 0 | |||||
| 2025-11-19 | 13F | Caitong International Asset Management Co., Ltd | 0 | -100,00 | 0 | |||||
| 2026-02-13 | 13F | Barclays Plc | 55.239 | 0,00 | 234 | -2,50 | ||||
| 2025-11-14 | 13F | Encompass Capital Advisors LLC | 0 | -100,00 | 0 | -100,00 | ||||
| 2026-02-17 | 13F | Quadrature Capital Ltd | 170.631 | 80,17 | 729 | 78,00 | ||||
| 2025-11-14 | 13F | Wolverine Trading, Llc | Call | 0 | -100,00 | 0 | ||||
| 2026-02-13 | 13F | Morgan Stanley | 124.885 | 2,83 | 530 | 0,19 | ||||
| 2026-02-18 | 13F | GWM Advisors LLC | 11.000 | 10,00 | 47 | 6,98 |