Grundlæggende statistik
| Institutionelle aktier (lange) | 32.682.734 - 11,26% (ex 13D/G) - change of 4,37MM shares 15,46% MRQ |
| Institutionel værdi (lang) | $ 319.980 USD ($1000) |
Institutionelt ejerskab og aktionærer
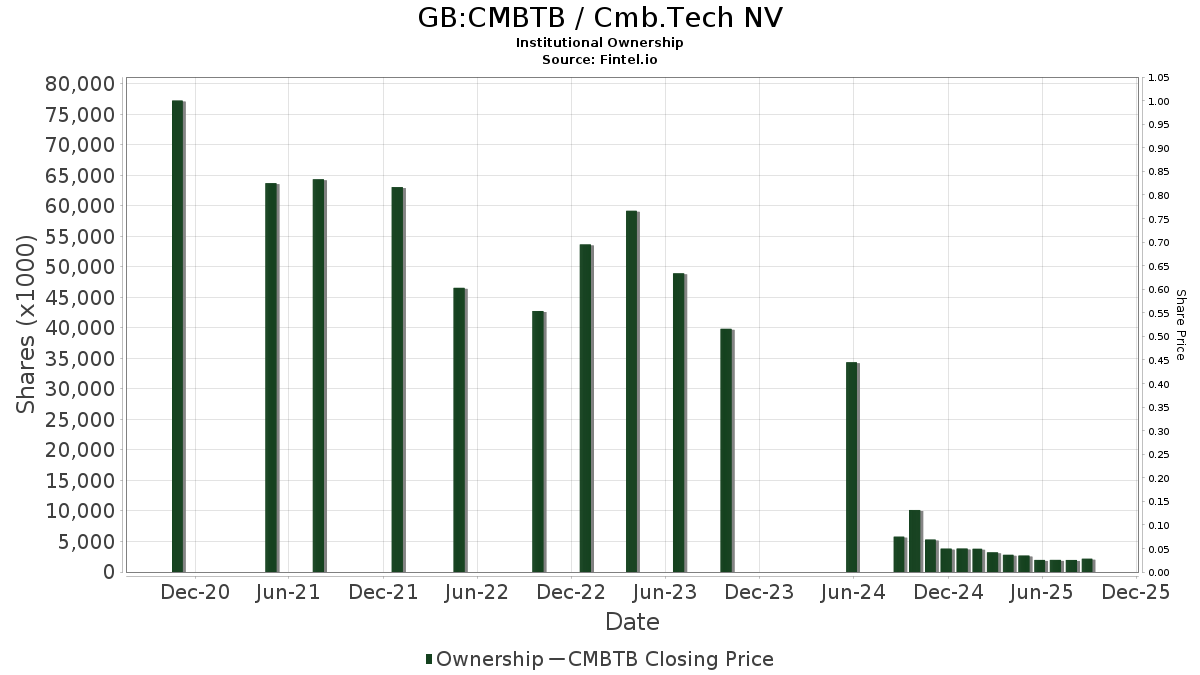
Cmb.Tech NV (GB:CMBTB) har 152 institutionelle ejere og aktionærer, der har indsendt 13D/G- eller 13F-formularer til Securities Exchange Commission (SEC). Disse institutioner har i alt 32,682,734 aktier. Største aktionærer omfatter Vanguard Group Inc, Goldman Sachs Group Inc, Folketrygdfondet, Encompass Capital Advisors LLC, Norges Bank, Millennium Management Llc, Sagil Capital Llp, Jane Street Group, Llc, Royal Bank Of Canada, and Morgan Stanley .
Cmb.Tech NV (BATS-CHIXE:CMBTB) institutionel ejerskabsstruktur viser aktuelle positioner i virksomheden efter institutioner og fonde, samt seneste ændringer i positionsstørrelse. Større aktionærer kan omfatte individuelle investorer, investeringsforeninger, hedgefonde eller institutioner. Skema 13D angiver, at investoren besidder (eller besidder) mere end 5 % af virksomheden og har til hensigt (eller har til hensigt at) aktivt at forfølge en ændring i forretningsstrategi. Skema 13G indikerer en passiv investering på over 5%.
Fondens stemningsscore
Fund Sentiment Score (fka Ownership Accumulation Score) finder de aktier, der bliver mest købt af fonde. Det er resultatet af en sofistikeret, multi-faktor kvantitativ model, der identificerer virksomheder med de højeste niveauer af institutionel akkumulering. Scoringsmodellen bruger en kombination af den samlede stigning i oplyste ejere, ændringerne i porteføljeallokeringer i disse ejere og andre målinger. Tallet går fra 0 til 100, hvor højere tal indikerer et højere niveau af akkumulering for sine jævnaldrende, og 50 er gennemsnittet.
Opdateringsfrekvens: Dagligt
Se Ownership Explorer, som giver en liste over højest rangerende virksomheder.
AI+ Ask Fintel’s AI assistant about Cmb.Tech NV.
Select a question to share a public post with an AI-crafted answer.
Thinking of good questions…
13F og NPORT arkivering
Detaljer om 13F-arkivering er gratis. Detaljer om NP-ansøgninger kræver et premium-medlemskab. Grønne rækker angiver nye positioner. Røde rækker angiver lukkede positioner. Klik på linket ikon for at se den fulde transaktionshistorik.
Opgrader
for at låse premium-data op og eksportere til Excel ![]() .
.
| Fil dato | Kilde | Investor | Type | Gennemsnitlig pris (Øst) |
Aktier | Δ Aktier (%) |
Rapporteret Værdi ($1000) |
Δ Værdi (%) |
Port Alloc (%) |
|
|---|---|---|---|---|---|---|---|---|---|---|
| 2026-02-12 | 13F | Commonwealth Equity Services, Llc | 14.857 | 3,40 | 143 | |||||
| 2026-02-17 | 13F | Advisory Services Network, LLC | 0 | -100,00 | 0 | |||||
| 2026-02-13 | 13F | JustInvest LLC | 25.343 | 9,42 | 245 | 12,44 | ||||
| 2026-02-17 | 13F | Alliancebernstein L.p. | 23.922 | 0,09 | 231 | 2,68 | ||||
| 2026-02-17 | 13F | Boothbay Fund Management, Llc | 362.500 | 100,51 | 3.502 | 106,31 | ||||
| 2026-03-02 | 13F | Sankala Group LLC | 148 | 2 | ||||||
| 2026-03-03 | 13F | NWF Advisory Services Inc. | 15.764 | -16,67 | 152 | -14,12 | ||||
| 2026-02-17 | 13F | Russell Investments Group, Ltd. | 0 | -100,00 | 0 | |||||
| 2026-02-12 | 13F | State Board Of Administration Of Florida Retirement System | 33.391 | 0,00 | 322 | 2,88 | ||||
| 2026-02-13 | 13F | Ubs Asset Management Americas Inc | 645 | -97,40 | 6 | -97,41 | ||||
| 2026-01-23 | 13F | Inlight Wealth Management, LLC | 190 | 0,00 | 2 | 0,00 | ||||
| 2026-02-17 | 13F | Harvey Capital Management Inc | 15.000 | 145 | ||||||
| 2026-02-04 | 13F | Fourth Dimension Wealth, LLC | 285 | 0,00 | 3 | 0,00 | ||||
| 2026-02-13 | 13F | Centiva Capital, LP | 0 | -100,00 | 0 | |||||
| 2026-01-30 | 13F | Sigma Planning Corp | 40.257 | 119,53 | 388 | 125,58 | ||||
| 2026-02-11 | 13F | Parallel Advisors, LLC | 22 | 0,00 | 0 | |||||
| 2026-02-13 | 13F | Arrowstreet Capital, Limited Partnership | 0 | -100,00 | 0 | |||||
| 2026-01-28 | 13F | WIT Partners Advisory Pte. Ltd. | 51.735 | 0,00 | 474 | 17,91 | ||||
| 2026-02-17 | 13F/A | RBF Capital, LLC | 0 | -100,00 | 0 | |||||
| 2025-09-25 | NP | DFAI - Dimensional International Core Equity Market ETF | 99.042 | -26,83 | 873 | -32,25 | ||||
| 2026-02-17 | 13F | Bank Of America Corp /de/ | 171.134 | -77,15 | 1.651 | -76,52 | ||||
| 2026-02-13 | 13F | Citigroup Inc | 407.790 | -15,50 | 3.884 | -16,26 | ||||
| 2026-02-17 | 13F | Point72 Asset Management, L.P. | 101.943 | 984 | ||||||
| 2026-02-10 | 13F | Quantbot Technologies LP | 258.563 | 391,03 | 2.495 | 405,06 | ||||
| 2026-02-12 | 13F | Steward Partners Investment Advisory, Llc | 5.348 | -12,34 | 52 | -10,53 | ||||
| 2026-02-13 | 13F | SRS Capital Advisors, Inc. | 4 | -97,39 | 0 | -100,00 | ||||
| 2026-02-02 | 13F | Highland Capital Management, Llc | 36.850 | -11,10 | 356 | -8,74 | ||||
| 2026-01-27 | 13F | Zurcher Kantonalbank (Zurich Cantonalbank) | 32.827 | 42,58 | 313 | 41,18 | ||||
| 2026-02-04 | 13F | Atlantic Union Bankshares Corp | 190 | 0,00 | 2 | 0,00 | ||||
| 2026-02-11 | 13F | Allianz Asset Management GmbH | 398.262 | 3.793 | ||||||
| 2026-02-17 | 13F | Tower Research Capital LLC (TRC) | 4.878 | 1,16 | 47 | 4,44 | ||||
| 2026-01-28 | 13F | Geneos Wealth Management Inc. | 190 | 0,00 | 2 | 0,00 | ||||
| 2026-01-05 | 13F | GAMMA Investing LLC | 1.041 | -7,38 | 10 | 0,00 | ||||
| 2026-02-17 | 13F | Fearnley Asset Management As | 238.618 | 10.284 | ||||||
| 2026-01-12 | 13F | CVA Family Office, LLC | 126 | 0,00 | 1 | 0,00 | ||||
| 2026-02-11 | 13F | Deutsche Bank Ag\ | 361.569 | 14,43 | 3.489 | 17,59 | ||||
| 2026-02-13 | 13F | Caitong International Asset Management Co., Ltd | 1.947 | 19 | ||||||
| 2026-02-12 | 13F | Quadrant Capital Group Llc | 3.481 | 0,00 | 34 | 3,13 | ||||
| 2026-02-09 | 13F | Legal & General Group Plc | 224.289 | 82,56 | 2.141 | 82,06 | ||||
| 2026-02-10 | 13F | Bnp Paribas Arbitrage, Sa | 184 | -99,77 | 2 | -99,87 | ||||
| 2026-02-11 | 13F | Simplex Trading, Llc | 74.993 | -41,63 | 724 | 72.200,00 | ||||
| 2026-02-17 | 13F | Jump Financial, LLC | 204.893 | -52,80 | 1.977 | -51,48 | ||||
| 2026-02-18 | 13F | Vident Advisory, LLC | 43.710 | -32,35 | 422 | -30,53 | ||||
| 2025-11-14 | 13F | Cubist Systematic Strategies, LLC | 102.096 | 959 | ||||||
| 2026-02-12 | 13F | Johnson Financial Group, Inc. | 129 | 0,00 | 1 | 0,00 | ||||
| 2026-02-12 | 13F | CIBC Private Wealth Group, LLC | 0 | -100,00 | 0 | |||||
| 2026-01-23 | 13F | Brown, Lisle/cummings, Inc. | 1.425 | 0,00 | 14 | 0,00 | ||||
| 2026-02-13 | 13F | Headlands Technologies LLC | 67.058 | 3,01 | 647 | 5,89 | ||||
| 2026-02-24 | 13F | Bell Investment Advisors, Inc | 293 | 0,00 | 3 | 0,00 | ||||
| 2026-02-13 | 13F | Commerce Bank | 11.157 | 0,00 | 108 | 2,88 | ||||
| 2026-02-17 | 13F | Voloridge Investment Management, Llc | 363.465 | 3.507 | ||||||
| 2026-02-12 | 13F | Summit Financial, LLC | 50.000 | 482 | ||||||
| 2026-02-11 | 13F | Cerity Partners LLC | 17.968 | -2,37 | 173 | 0,58 | ||||
| 2025-11-14 | 13F | Raymond James Financial Inc | 0 | -100,00 | 0 | |||||
| 2026-02-17 | 13F | Advisor Group Holdings, Inc. | 25.817 | -29,32 | 249 | -26,76 | ||||
| 2026-02-13 | 13F | Walleye Capital LLC | Call | 33.300 | 321 | |||||
| 2026-01-30 | 13F | Torren Management, LLC | 399 | 4 | ||||||
| 2026-02-13 | 13F | MAI Capital Management | 3.785 | 304,81 | 37 | 350,00 | ||||
| 2026-02-13 | 13F | Wells Fargo & Company/mn | 5.933 | -23,32 | 56 | -24,32 | ||||
| 2026-02-13 | 13F | Cornerstone Financial Management LLC | 77 | 1 | ||||||
| 2026-02-17 | 13F | Susquehanna International Group, Llp | 913.586 | 38,61 | 8.816 | 42,45 | ||||
| 2026-02-17 | 13F | Two Sigma Investments, Lp | 168.837 | -49,31 | 1.629 | -47,91 | ||||
| 2026-02-03 | 13F | SBI Securities Co., Ltd. | 14.057 | -11,37 | 136 | -8,78 | ||||
| 2025-09-25 | NP | DFAX - Dimensional World ex U.S. Core Equity 2 ETF | 82.303 | -10,54 | 725 | -17,05 | ||||
| 2026-01-29 | 13F | UBS Group AG | 355.485 | 114,99 | 3.430 | 121,01 | ||||
| 2026-02-13 | 13F | Walleye Capital LLC | Put | 300 | 3 | |||||
| 2026-02-17 | 13F | Susquehanna International Group, Llp | Put | 547.600 | -19,78 | 5.284 | -17,55 | |||
| 2026-02-17 | 13F | Balyasny Asset Management Llc | 0 | -100,00 | 0 | |||||
| 2026-02-17 | 13F | Susquehanna International Group, Llp | Call | 236.200 | 124,95 | 2.279 | 131,37 | |||
| 2026-01-29 | 13F | IMC-Chicago, LLC | 65.386 | 631 | ||||||
| 2026-02-06 | 13F | Larson Financial Group LLC | 2.111 | 22,16 | 20 | 25,00 | ||||
| 2026-02-17 | 13F | Citadel Advisors Llc | Put | 367.440 | 425,70 | 3.546 | 440,40 | |||
| 2025-09-25 | NP | DFIS - Dimensional International Small Cap ETF | 25.562 | -37,99 | 225 | -42,60 | ||||
| 2026-02-17 | 13F | Cetera Investment Advisers | 11.442 | -19,81 | 110 | -17,29 | ||||
| 2026-02-17 | 13F | Citadel Advisors Llc | Call | 110.165 | 1,66 | 1.063 | 4,52 | |||
| 2026-02-17 | 13F | Citadel Advisors Llc | 817.407 | 325,16 | 7.888 | 336,95 | ||||
| 2025-11-14 | 13F | Credit Agricole S A | 0 | -100,00 | 0 | |||||
| 2025-10-28 | 13F | BRYN MAWR TRUST Co | 168 | 0,00 | 2 | 0,00 | ||||
| 2026-02-11 | 13F | Group One Trading, L.p. | 175.417 | 4,36 | 1.693 | 7,22 | ||||
| 2026-02-13 | 13F | Marshall Wace, Llp | 435.784 | 4.205 | ||||||
| 2026-02-17 | 13F | Persistent Asset Partners Ltd | 55.000 | 531 | ||||||
| 2026-02-17 | 13F | Encompass Capital Advisors LLC | 2.499.307 | 66,29 | 24.118 | 70,89 | ||||
| 2026-01-23 | 13F | Farther Finance Advisors, LLC | 637 | 20,64 | 6 | 50,00 | ||||
| 2026-02-17 | 13F | Optiver Holding B.V. | 5.076 | 49 | ||||||
| 2026-02-17 | 13F | D. E. Shaw & Co., Inc. | 356.722 | -30,88 | 3.442 | -28,97 | ||||
| 2026-01-29 | 13F | Pictet Asset Management Holding SA | 22.774 | 33,29 | 217 | 32,52 | ||||
| 2026-02-17 | 13F | Creative Planning | 18.064 | 10,72 | 174 | 13,73 | ||||
| 2026-02-12 | 13F | Rossby Financial, LCC | 31.890 | 10.896,55 | 308 | 15.250,00 | ||||
| 2026-01-16 | 13F | Ronald Blue Trust, Inc. | 3.147 | -74,30 | 30 | -73,68 | ||||
| 2025-09-25 | NP | DISV - Dimensional International Small Cap Value ETF | 23.571 | -19,37 | 208 | -25,54 | ||||
| 2026-02-17 | 13F | Fmr Llc | 35.758 | -1,72 | 341 | -2,58 | ||||
| 2026-02-17 | 13F | Mirabella Financial Services Llp | 0 | -100,00 | 0 | |||||
| 2026-01-26 | 13F | Svenska Handelsbanken AB (publ) | 0 | -100,00 | 0 | |||||
| 2026-02-11 | 13F | Jpmorgan Chase & Co | 41.170 | -5,25 | 397 | -2,46 | ||||
| 2026-02-12 | 13F | Folketrygdfondet | 2.829.165 | -48,57 | 27.301 | -47,14 | ||||
| 2026-01-26 | 13F | Cwm, Llc | 131 | -58,15 | 0 | |||||
| 2026-01-27 | 13F | TD Waterhouse Canada Inc. | 152 | 0,00 | 1 | 0,00 | ||||
| 2026-01-15 | 13F | Nisa Investment Advisors, Llc | 623 | -69,58 | 6 | -68,42 | ||||
| 2026-02-13 | 13F | Kestra Advisory Services, LLC | 6.977 | 67 | ||||||
| 2026-02-10 | 13F | AdvisorShares Investments LLC | 0 | -100,00 | 0 | |||||
| 2026-02-10 | 13F | Norges Bank | 2.282.809 | 21.956 | ||||||
| 2026-02-02 | 13F | Fifth Third Bancorp | 0 | -100,00 | 0 | |||||
| 2026-02-17 | 13F | Royal Bank Of Canada | 1.086.122 | -3,58 | 10.481 | -0,91 | ||||
| 2026-02-10 | 13F/A | Northwestern Mutual Wealth Management Co | 175 | -85,42 | 2 | -90,91 | ||||
| 2026-02-06 | 13F | IFP Advisors, Inc | 0 | -100,00 | 0 | |||||
| 2026-02-02 | 13F | Wolverine Asset Management Llc | 0 | -100,00 | 0 | |||||
| 2026-02-11 | 13F | Vise Technologies, Inc. | 0 | -100,00 | 0 | -100,00 | ||||
| 2026-02-17 | 13F | Quadrature Capital Ltd | 0 | -100,00 | 0 | |||||
| 2026-02-12 | 13F | Kovack Advisors, Inc. | 64.194 | 15 | ||||||
| 2026-02-13 | 13F | Oceanic Investment Management LTD | 998.052 | 234,16 | 9.631 | 270,71 | ||||
| 2026-02-17 | 13F | Schonfeld Strategic Advisors LLC | 72.458 | 504,98 | 699 | 524,11 | ||||
| 2026-01-08 | 13F | Armstrong Advisory Group, Inc | 1.045 | 0,00 | 10 | 11,11 | ||||
| 2026-01-30 | 13F | Bogart Wealth, LLC | 1.710 | 0,00 | 17 | 0,00 | ||||
| 2026-02-17 | 13F | Css Llc/il | Put | 32.500 | -13,33 | 314 | -11,08 | |||
| 2026-02-17 | 13F | Css Llc/il | Call | 4.000 | 0,00 | 39 | 2,70 | |||
| 2026-02-17 | 13F | Css Llc/il | 20.040 | -21,53 | 193 | -19,25 | ||||
| 2026-02-17 | 13F | Public Employees Retirement System Of Ohio | 22.206 | 377,24 | 211 | 379,55 | ||||
| 2026-01-28 | 13F | City State Bank | 100 | 0,00 | 1 | |||||
| 2026-02-09 | 13F | Jefferies Financial Group Inc. | Put | 70.000 | 676 | |||||
| 2026-02-05 | 13F | Td Private Client Wealth Llc | 0 | -100,00 | 0 | -100,00 | ||||
| 2026-02-09 | 13F | Jefferies Financial Group Inc. | 128.905 | -81,51 | 1.250 | -80,96 | ||||
| 2025-09-25 | NP | DFIC - Dimensional International Core Equity 2 ETF | 61.823 | -12,92 | 545 | -19,41 | ||||
| 2026-02-10 | 13F | Envestnet Asset Management Inc | 0 | -100,00 | 0 | -100,00 | ||||
| 2026-02-12 | 13F | Sagil Capital Llp | 1.397.397 | 133,46 | 13.485 | 139,93 | ||||
| 2026-02-06 | 13F | Gsa Capital Partners Llp | 0 | -100,00 | 0 | |||||
| 2026-02-13 | 13F | National Bank Of Canada /fi/ | 707 | 0,00 | 7 | 0,00 | ||||
| 2026-02-17 | 13F | Jones Financial Companies Lllp | 2.070 | -10,54 | 20 | -13,64 | ||||
| 2026-01-30 | 13F | Us Bancorp \de\ | 87 | 0,00 | 1 | |||||
| 2026-02-06 | 13F | Pnc Financial Services Group, Inc. | 412 | -59,73 | 4 | -66,67 | ||||
| 2026-02-17 | 13F | Northern Trust Corp | 12.132 | -80,90 | 117 | -80,37 | ||||
| 2026-02-13 | 13F | Verition Fund Management LLC | 0 | -100,00 | 0 | |||||
| 2026-02-06 | 13F | Global Retirement Partners, LLC | 213 | -3,18 | 2 | 0,00 | ||||
| 2026-01-09 | 13F | SG Americas Securities, LLC | 117.510 | -25,69 | 1 | 0,00 | ||||
| 2026-02-17 | 13F | TCG Advisory Services, LLC | 12.500 | 0,00 | 121 | 2,56 | ||||
| 2026-02-17 | 13F | Prelude Capital Management, Llc | 134.792 | 70,86 | 1.302 | 75,71 | ||||
| 2025-11-17 | 13F | Triumph Capital Management | 300 | 3 | ||||||
| 2026-02-12 | 13F | Jane Street Group, Llc | Call | 38.900 | 375 | |||||
| 2026-01-23 | 13F | Sage Investment Counsel LLC | 10.000 | 96 | ||||||
| 2026-02-12 | 13F | Jane Street Group, Llc | 1.172.755 | 121,37 | 11.317 | 127,52 | ||||
| 2026-02-12 | 13F | Callan Family Office, LLC | 10.316 | 100 | ||||||
| 2026-02-11 | 13F | LPL Financial LLC | 244.184 | 583,76 | 2.356 | 603,28 | ||||
| 2026-02-12 | 13F | Jane Street Group, Llc | Put | 36.500 | -35,11 | 352 | -33,33 | |||
| 2026-02-12 | 13F | Counterpoint Mutual Funds LLC | 52.764 | 509 | ||||||
| 2026-02-13 | 13F | Squarepoint Ops LLC | 0 | -100,00 | 0 | |||||
| 2026-02-13 | 13F | Ieq Capital, Llc | 0 | -100,00 | 0 | |||||
| 2026-02-11 | 13F | J.w. Cole Advisors, Inc. | 10.240 | -21,14 | 97 | -20,66 | ||||
| 2026-02-13 | 13F | Smartleaf Asset Management LLC | 757 | 43,64 | 7 | 40,00 | ||||
| 2026-02-13 | 13F | Luminist Capital LLC | 300 | 3 | ||||||
| 2026-02-12 | 13F | Renaissance Technologies Llc | 362.500 | -20,71 | 3.498 | -18,52 | ||||
| 2026-02-13 | 13F | Morgan Stanley | 1.040.573 | 296,52 | 10.042 | 307,51 | ||||
| 2026-02-14 | 13F | Militia Capital Partners, LP | 15.000 | 145 | ||||||
| 2026-02-06 | 13F | GPS Wealth Strategies Group, LLC | 0 | -100,00 | 0 | |||||
| 2026-02-17 | 13F/A | Uniplan Investment Counsel, Inc. | 0 | -100,00 | 0 | |||||
| 2026-02-17 | 13F | XTX Topco Ltd | 133.723 | 252,03 | 1.290 | 262,36 | ||||
| 2026-01-23 | 13F | Lester Murray Antman dba SimplyRich | 34.206 | 0,00 | 0 | |||||
| 2026-02-05 | 13F | Allworth Financial LP | 1.018 | 0,00 | 10 | 0,00 | ||||
| 2026-02-17 | 13F | Susquehanna Fundamental Investments, Llc | 51.269 | 0,00 | 495 | 2,70 | ||||
| 2026-02-17 | 13F | Millennium Management Llc | 1.636.435 | 15.792 | ||||||
| 2026-01-15 | 13F | Lodestone Wealth Management LLC | 643 | 6 | ||||||
| 2026-02-06 | 13F | EverSource Wealth Advisors, LLC | 1.632 | -39,44 | 16 | -40,00 | ||||
| 2026-02-17 | 13F | SIH Partners, LLLP | 0 | -100,00 | 0 | |||||
| 2026-01-21 | 13F | Graham Capital Wealth Management, Llc | 437.222 | 36,32 | 4.219 | 40,12 | ||||
| 2026-01-22 | 13F | Bfsg, Llc | 19.000 | 0,00 | 183 | 2,81 | ||||
| 2026-02-12 | 13F | BlackRock, Inc. | 68.178 | 2,60 | 658 | 5,46 | ||||
| 2026-01-21 | 13F | Sound Income Strategies, LLC | 997 | 0,00 | 11 | 22,22 | ||||
| 2026-01-22 | 13F | Financial Consulate, Inc | 167 | 0,00 | 2 | 0,00 | ||||
| 2026-02-12 | 13F | Brinker Capital Investments, LLC | 18.546 | 179 | ||||||
| 2026-02-13 | 13F | Mariner, LLC | 63.372 | 4,00 | 612 | 6,82 | ||||
| 2026-02-13 | 13F | WealthTrust Axiom LLC | 0 | -100,00 | 0 | |||||
| 2026-02-10 | 13F | Goldman Sachs Group Inc | 2.849.002 | 21,08 | 27.493 | 24,44 | ||||
| 2026-02-19 | 13F | CI Private Wealth, LLC | 0 | -100,00 | 0 | |||||
| 2026-01-29 | 13F | Vanguard Group Inc | 4.216.371 | -0,62 | 40.001 | -1,72 | ||||
| 2026-02-06 | 13F | Leonteq Securities AG | 422 | 4 | ||||||
| 2026-02-10 | 13F | Bank of New York Mellon Corp | 0 | -100,00 | 0 | |||||
| 2026-02-12 | 13F | Swiss National Bank | 248.913 | 1,69 | 2.368 | 0,77 | ||||
| 2026-02-13 | 13F | Barclays Plc | 124.917 | 275,18 | 1.205 | 286,22 | ||||
| 2026-02-17 | 13F | FourWorld Capital Management LLC | 0 | -100,00 | 0 | |||||
| 2026-02-20 | 13F | Sunbelt Securities, Inc. | 5.998 | 0,38 | 58 | 1,79 | ||||
| 2026-02-05 | 13F | Mesirow Financial Investment Management, Inc. | 0 | -100,00 | 0 | -100,00 | ||||
| 2026-02-10 | 13F/A | MJT & Associates Financial Advisory Group, Inc. | 100 | 0,00 | 1 | |||||
| 2026-02-19 | 13F | Mcguire Capital Advisors Inc | 2.700 | 26 | ||||||
| 2026-01-20 | 13F | Signaturefd, Llc | 4.866 | 0,00 | 47 | 2,22 | ||||
| 2026-02-12 | 13F | Hrt Financial Lp | 0 | -100,00 | 0 | |||||
| 2026-02-17 | 13F | Quantinno Capital Management LP | 56.795 | -13,93 | 548 | -11,47 | ||||
| 2026-02-13 | 13F | Marnell Management LLC | Call | 51.200 | 494 | |||||
| 2026-02-13 | 13F | Marnell Management LLC | 184.253 | 1.778 | ||||||
| 2026-02-14 | 13F | Rockefeller Capital Management L.P. | 22 | 0,00 | 0 | |||||
| 2026-02-13 | 13F | State Street Corp | 49.869 | -0,77 | 481 | 2,12 | ||||
| 2026-01-27 | 13F | WealthCollab, LLC | 1.227 | 19,94 | 12 | 22,22 | ||||
| 2026-02-09 | 13F | Key FInancial Inc | 0 | -100,00 | 0 | |||||
| 2026-02-03 | 13F | Mitsubishi UFJ Kokusai Asset Management Co., Ltd. | 65.026 | 615 | ||||||
| 2026-02-13 | 13F | Walleye Trading LLC | 12.194 | 118 | ||||||
| 2026-01-22 | 13F | Vision Financial Markets Llc | 97 | 0,00 | 1 | |||||
| 2026-02-12 | 13F | Nuveen, LLC | 91.122 | -46,61 | 868 | -46,61 | ||||
| 2025-11-14 | 13F | Point72 (DIFC) Ltd | 12.088 | 114 | ||||||
| 2026-02-17 | 13F | Engineers Gate Manager LP | 49.954 | 482 |