Grundlæggende statistik
| Institutionelle aktier (lange) | 61.761.603 - 14,91% (ex 13D/G) - change of -2,14MM shares -3,36% MRQ |
| Institutionel værdi (lang) | $ 25.634 USD ($1000) |
Institutionelt ejerskab og aktionærer
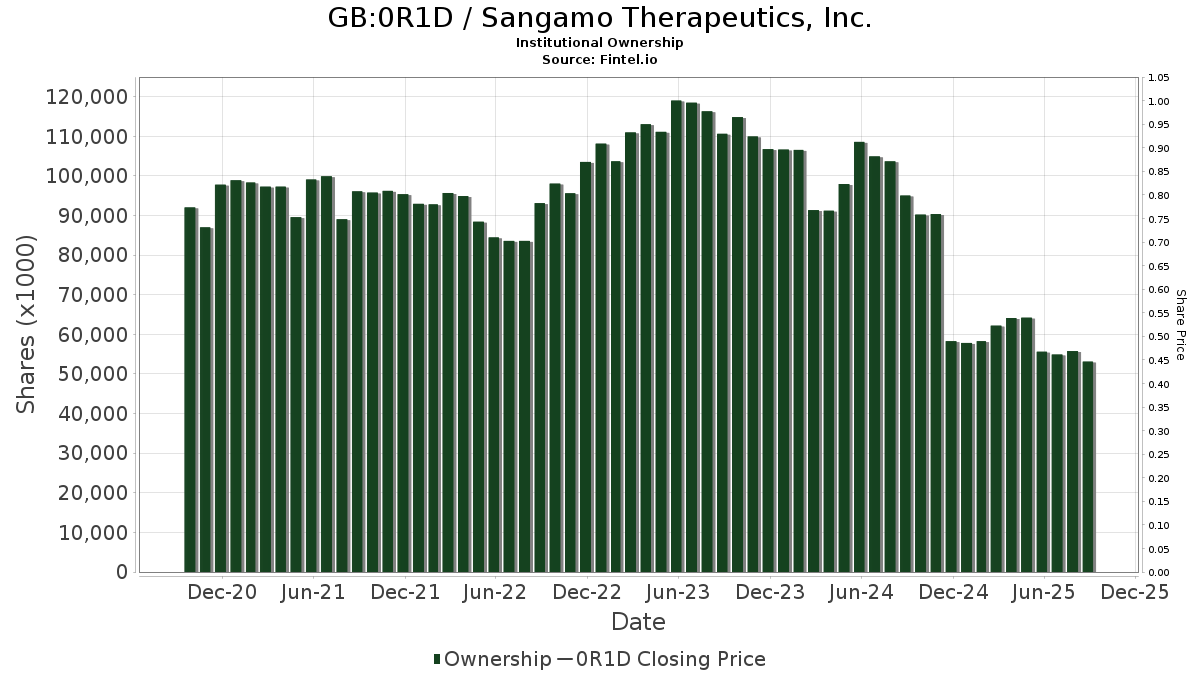
Sangamo Therapeutics, Inc. (GB:0R1D) har 114 institutionelle ejere og aktionærer, der har indsendt 13D/G- eller 13F-formularer til Securities Exchange Commission (SEC). Disse institutioner har i alt 61,761,603 aktier. Største aktionærer omfatter Vanguard Group Inc, Renaissance Technologies Llc, Two Sigma Investments, Lp, BlackRock, Inc., Two Sigma Advisers, Lp, Geode Capital Management, Llc, Jane Street Group, Llc, Susquehanna International Group, Llp, Charles Schwab Investment Management Inc, and State Street Corp .
Sangamo Therapeutics, Inc. (LSE:0R1D) institutionel ejerskabsstruktur viser aktuelle positioner i virksomheden efter institutioner og fonde, samt seneste ændringer i positionsstørrelse. Større aktionærer kan omfatte individuelle investorer, investeringsforeninger, hedgefonde eller institutioner. Skema 13D angiver, at investoren besidder (eller besidder) mere end 5 % af virksomheden og har til hensigt (eller har til hensigt at) aktivt at forfølge en ændring i forretningsstrategi. Skema 13G indikerer en passiv investering på over 5%.
The share price as of April 24, 2026 is 0,18 / share. Previously, on December 2, 2025, the share price was 0,44 / share. This represents a decline of 59,61% over that period.
Fondens stemningsscore
Fund Sentiment Score (fka Ownership Accumulation Score) finder de aktier, der bliver mest købt af fonde. Det er resultatet af en sofistikeret, multi-faktor kvantitativ model, der identificerer virksomheder med de højeste niveauer af institutionel akkumulering. Scoringsmodellen bruger en kombination af den samlede stigning i oplyste ejere, ændringerne i porteføljeallokeringer i disse ejere og andre målinger. Tallet går fra 0 til 100, hvor højere tal indikerer et højere niveau af akkumulering for sine jævnaldrende, og 50 er gennemsnittet.
Opdateringsfrekvens: Dagligt
Se Ownership Explorer, som giver en liste over højest rangerende virksomheder.
AI+ Ask Fintel’s AI assistant about Sangamo Therapeutics, Inc..
Select a question to share a public post with an AI-crafted answer.
Thinking of good questions…
13F og NPORT arkivering
Detaljer om 13F-arkivering er gratis. Detaljer om NP-ansøgninger kræver et premium-medlemskab. Grønne rækker angiver nye positioner. Røde rækker angiver lukkede positioner. Klik på linket ikon for at se den fulde transaktionshistorik.
Opgrader
for at låse premium-data op og eksportere til Excel ![]() .
.
| Fil dato | Kilde | Investor | Type | Gennemsnitlig pris (Øst) |
Aktier | Δ Aktier (%) |
Rapporteret Værdi ($1000) |
Δ Værdi (%) |
Port Alloc (%) |
|
|---|---|---|---|---|---|---|---|---|---|---|
| 2026-02-04 | 13F | Dynamic Wealth Strategies, LLC | 5.600 | 0,00 | 2 | -33,33 | ||||
| 2026-02-10 | 13F | Bnp Paribas Arbitrage, Sa | 266 | -40,36 | 0 | |||||
| 2026-02-13 | 13F | Wells Fargo & Company/mn | 37.918 | -4,98 | 16 | -42,31 | ||||
| 2026-02-17 | 13F | XTX Topco Ltd | 183.531 | 77 | ||||||
| 2026-04-17 | 13F | AdvisorNet Financial, Inc | 206 | 0,00 | 0 | |||||
| 2026-04-24 | 13F | Cannon Advisors, Inc. | 11.750 | 0,00 | 3 | -60,00 | ||||
| 2026-02-13 | 13F | Prudential Financial Inc | 0 | -100,00 | 0 | -100,00 | ||||
| 2026-02-13 | 13F | Macquarie Group Ltd | 0 | -100,00 | 0 | -100,00 | ||||
| 2025-11-18 | 13F | Yorkville Advisors Global, LP | 0 | -100,00 | 0 | -100,00 | ||||
| 2026-02-17 | 13F | IHT Wealth Management, LLC | 12.000 | 0,00 | 5 | -37,50 | ||||
| 2026-02-11 | 13F | Cerity Partners LLC | 163.943 | -8,75 | 69 | -43,33 | ||||
| 2026-02-13 | 13F | Colony Group, LLC | 11.000 | -32,52 | 5 | -60,00 | ||||
| 2025-11-14 | 13F | Point72 Asia (Singapore) Pte. Ltd. | 35 | 0,00 | 0 | |||||
| 2026-02-12 | 13F | BlackRock, Inc. | 4.571.786 | 0,34 | 1.920 | -37,42 | ||||
| 2025-11-14 | 13F | Kestra Advisory Services, LLC | 0 | -100,00 | 0 | -100,00 | ||||
| 2026-04-17 | 13F | Signal Advisors Wealth, LLC | 14.600 | 4 | ||||||
| 2026-04-23 | 13F | BXM Wealth LLC | 12.350 | -0,80 | 3 | -40,00 | ||||
| 2026-02-17 | 13F | Bank Of America Corp /de/ | 93.984 | -6,46 | 39 | -41,79 | ||||
| 2026-02-17 | 13F | Russell Investments Group, Ltd. | 50.357 | -0,58 | 21 | -38,24 | ||||
| 2026-02-13 | 13F | National Bank Of Canada /fi/ | 200 | 0,00 | 0 | |||||
| 2026-02-12 | 13F | Renaissance Technologies Llc | 8.430.323 | -17,21 | 3.541 | -48,37 | ||||
| 2026-04-15 | 13F | Fortitude Family Office, LLC | 0 | -100,00 | 0 | |||||
| 2026-01-29 | 13F | Golden State Equity Partners | 395.943 | -5,49 | 166 | -41,13 | ||||
| 2026-02-10 | 13F | Goldman Sachs Group Inc | 190.645 | -57,34 | 80 | -73,33 | ||||
| 2026-02-13 | 13F | Jacobs Levy Equity Management, Inc | 1.050.714 | 24,12 | 441 | -22,63 | ||||
| 2026-02-13 | 13F | Barclays Plc | 1 | 0,00 | 0 | |||||
| 2026-02-17 | 13F | Two Sigma Investments, Lp | 4.755.995 | 91,84 | 1.998 | 19,65 | ||||
| 2026-02-06 | 13F | Gsa Capital Partners Llp | 78.148 | -97,87 | 0 | -100,00 | ||||
| 2026-02-13 | 13F | Morgan Stanley | 423.752 | -28,44 | 178 | -55,53 | ||||
| 2026-01-27 | 13F | Hedges Asset Management LLC | 125.000 | 52 | ||||||
| 2025-11-13 | 13F | Fort Sheridan Advisors Llc | 0 | -100,00 | 0 | -100,00 | ||||
| 2026-02-13 | 13F | Smartleaf Asset Management LLC | 200 | 0 | ||||||
| 2026-02-06 | 13F | Global Retirement Partners, LLC | 10.490 | 2.040,82 | 4 | |||||
| 2026-01-16 | 13F | Crewe Advisors LLC | 100 | 0,00 | 0 | |||||
| 2026-04-17 | 13F | Brown, Lisle/cummings, Inc. | 1.525 | 0,00 | 0 | |||||
| 2026-02-05 | 13F | Cambridge Investment Research Advisors, Inc. | 33.817 | -2,80 | 0 | |||||
| 2026-02-17 | 13F | Canada Pension Plan Investment Board | 251.900 | 16.693,33 | 106 | 288,89 | ||||
| 2026-02-11 | 13F | Simplex Trading, Llc | Put | 284.300 | -16,87 | 119 | ||||
| 2026-02-12 | 13F | CIBC Private Wealth Group, LLC | 1.000 | 0,00 | 0 | |||||
| 2026-02-11 | 13F | Simplex Trading, Llc | Call | 432.500 | 5,15 | 182 | ||||
| 2026-02-03 | 13F | International Assets Investment Management, Llc | 28.000 | 12 | ||||||
| 2026-02-17 | 13F | Creative Planning | 12.850 | 0,39 | 5 | -37,50 | ||||
| 2026-02-17 | 13F | Advisor Group Holdings, Inc. | 7.130 | -12,30 | 3 | -50,00 | ||||
| 2026-02-11 | 13F | Prestige Wealth Management Group LLC | 300 | 0 | ||||||
| 2026-02-17 | 13F | Two Sigma Securities, Llc | 17.622 | -73,02 | 7 | -83,72 | ||||
| 2025-11-14 | 13F | Cubist Systematic Strategies, LLC | 54.246 | 14,81 | 37 | 44,00 | ||||
| 2026-02-11 | 13F | Group One Trading, L.p. | Put | 218.100 | -28,02 | 92 | -55,39 | |||
| 2026-01-20 | 13F | Wealth Management Associates, Inc. | 315.800 | -5,96 | 133 | -41,59 | ||||
| 2026-02-11 | 13F | Group One Trading, L.p. | 500.179 | -0,36 | 210 | -37,87 | ||||
| 2026-02-17 | 13F | Engineers Gate Manager LP | 56.554 | -76,68 | 24 | -85,89 | ||||
| 2026-02-11 | 13F | Group One Trading, L.p. | Call | 27.500 | -73,38 | 12 | -84,06 | |||
| 2026-03-13 | 13F/A | Pensionmark Financial Group, Llc | 0 | -100,00 | 0 | -100,00 | ||||
| 2025-11-14 | 13F | Northwestern Mutual Wealth Management Co | 0 | -100,00 | 0 | |||||
| 2026-01-27 | 13F | Meritage Portfolio Management | 227.000 | 28,25 | 95 | -20,17 | ||||
| 2026-04-09 | 13F | Sanders Morris Harris Llc | 668.000 | 165 | ||||||
| 2026-02-06 | 13F | Pnc Financial Services Group, Inc. | 150.000 | 328,57 | 63 | 173,91 | ||||
| 2026-02-17 | 13F | Delaware Management Holdings, Inc. | 400.000 | 168 | ||||||
| 2026-02-06 | 13F | Leonteq Securities AG | 2.262 | 0,00 | 1 | -100,00 | ||||
| 2026-02-17 | 13F | Cetera Investment Advisers | 73.300 | 31 | ||||||
| 2026-02-13 | 13F | Victory Capital Management Inc | 37.884 | 12,93 | 16 | -31,82 | ||||
| 2026-02-17 | 13F | Private Advisor Group, LLC | 28.000 | 0,00 | 12 | -38,89 | ||||
| 2026-02-02 | 13F | Sachetta, LLC | 0 | -100,00 | 0 | |||||
| 2026-04-15 | 13F | Activest Wealth Management | 1.000 | 0,00 | 0 | |||||
| 2026-02-10 | 13F | Bank of New York Mellon Corp | 22.267 | 0,00 | 9 | -35,71 | ||||
| 2026-03-04 | 13F | SHP Wealth Management | 125 | 0 | ||||||
| 2025-10-27 | 13F | First Horizon Corp | 0 | -100,00 | 0 | |||||
| 2026-02-11 | 13F | Simplex Trading, Llc | 0 | -100,00 | 0 | |||||
| 2026-02-17 | 13F | Optiver Holding B.V. | 3.200 | 0,00 | 1 | -50,00 | ||||
| 2026-04-22 | 13F | Pasadena Private Wealth, LLC | 22.093 | 5 | ||||||
| 2026-02-13 | 13F | JustInvest LLC | 28.043 | -21,03 | 12 | -52,17 | ||||
| 2026-01-29 | 13F | Vanguard Group Inc | 12.000.383 | 3,32 | 5.040 | -35,52 | ||||
| 2025-11-14 | 13F | Hrt Financial Lp | 0 | -100,00 | 0 | |||||
| 2025-11-14 | 13F | Squarepoint Ops LLC | 0 | -100,00 | 0 | -100,00 | ||||
| 2026-01-27 | 13F | Zurcher Kantonalbank (Zurich Cantonalbank) | 0 | -100,00 | 0 | |||||
| 2026-02-13 | 13F | Citigroup Inc | 0 | -100,00 | 0 | |||||
| 2026-02-17 | 13F | Citadel Advisors Llc | 0 | -100,00 | 0 | -100,00 | ||||
| 2026-04-23 | 13F | Kohmann Bosshard Financial Services, LLC | 155 | 0,00 | 0 | |||||
| 2026-02-13 | 13F | State Street Corp | 1.355.583 | 0,00 | 569 | -37,61 | ||||
| 2026-02-17 | 13F | Luminus Management Llc | 1.158.761 | 363,50 | 487 | 189,29 | ||||
| 2026-02-17 | 13F | Advisory Services Network, LLC | 0 | -100,00 | 0 | |||||
| 2026-02-13 | 13F | SRS Capital Advisors, Inc. | 0 | -100,00 | 0 | |||||
| 2026-02-13 | 13F | Charles Schwab Investment Management Inc | 1.713.331 | 11,33 | 720 | -30,60 | ||||
| 2026-04-08 | 13F | Miracle Mile Advisors, LLC | 41.400 | 0,00 | 10 | -41,18 | ||||
| 2026-04-21 | 13F | Wasatch Advisors Inc | 0 | -100,00 | 0 | -100,00 | ||||
| 2026-02-17 | 13F | Millennium Management Llc | 37.703 | -90,10 | 16 | -94,14 | ||||
| 2026-02-12 | 13F | Jane Street Group, Llc | Call | 85.600 | 77,59 | 36 | 9,38 | |||
| 2026-02-11 | 13F | Rise Advisors, LLC | 0 | -100,00 | 0 | |||||
| 2026-02-12 | 13F | Jane Street Group, Llc | 2.918.127 | 32,60 | 1.226 | -17,29 | ||||
| 2026-02-13 | 13F | Vontobel Holding Ltd. | 70.000 | -32,24 | 29 | -57,97 | ||||
| 2026-02-03 | 13F | SBI Securities Co., Ltd. | 24.541 | -0,01 | 10 | -37,50 | ||||
| 2026-02-12 | 13F | Jane Street Group, Llc | Put | 42.100 | 18 | |||||
| 2026-04-21 | 13F | Founders Capital Management | 6.000 | -57,14 | 1 | -80,00 | ||||
| 2026-02-10 | 13F | State of Wyoming | 111.527 | 47 | ||||||
| 2026-02-17 | 13F | Blair William & Co/il | 0 | -100,00 | 0 | -100,00 | ||||
| 2025-11-19 | 13F | Caitong International Asset Management Co., Ltd | 0 | -100,00 | 0 | |||||
| 2026-02-13 | 13F | Vontobel Holding Ltd. | Call | 35.800 | -46,88 | 15 | -66,67 | |||
| 2026-01-09 | 13F | SG Americas Securities, LLC | 0 | -100,00 | 0 | |||||
| 2026-02-17 | 13F | Fmr Llc | 265.408 | 4,95 | 111 | -34,71 | ||||
| 2026-02-17 | 13F | Jones Financial Companies Lllp | 1.388 | 0,00 | 1 | |||||
| 2026-02-17 | 13F | Prelude Capital Management, Llc | 63.275 | -36,29 | 27 | -60,61 | ||||
| 2026-02-06 | 13F | Larson Financial Group LLC | 100 | 0 | ||||||
| 2026-02-11 | 13F | Atlantic Private Wealth, LLC | 1.000 | 0,00 | 0 | |||||
| 2026-04-08 | 13F | Sandbox Financial Partners, LLC | 24.833 | 0,00 | 6 | -40,00 | ||||
| 2026-04-10 | 13F | Linden Thomas Advisory Services, LLC | 0 | -100,00 | 0 | -100,00 | ||||
| 2026-01-23 | 13F | TFC Financial Management | 0 | -100,00 | 0 | -100,00 | ||||
| 2026-02-13 | 13F | Diametric Capital, LP | 395.332 | 10,12 | 166 | -31,12 | ||||
| 2026-01-29 | 13F | Concurrent Investment Advisors, LLC | 15.000 | 0,00 | 6 | -40,00 | ||||
| 2026-02-05 | 13F | Mesirow Financial Investment Management, Inc. | 0 | -100,00 | 0 | -100,00 | ||||
| 2026-01-23 | 13F | Kelsey Financial, LLC | 35.000 | 15 | ||||||
| 2026-02-19 | 13F | Invesco Ltd. | 1.000.292 | 23,69 | 420 | -22,79 | ||||
| 2026-04-10 | 13F | Magnus Financial Group LLC | 10.000 | 0,00 | 2 | -50,00 | ||||
| 2026-02-04 | 13F | Atlantic Union Bankshares Corp | 400 | 0,00 | 0 | |||||
| 2026-02-17 | 13F | LaSalle St. Investment Advisors, LLC | 0 | -100,00 | 0 | |||||
| 2026-04-15 | 13F | Redhawk Wealth Advisors, Inc. | 119.400 | 29 | ||||||
| 2026-04-16 | 13F | Quotient Wealth Partners, LLC | 34.999 | 0,00 | 9 | -42,86 | ||||
| 2026-02-13 | 13F | Mariner, LLC | 56.732 | -6,66 | 24 | -42,50 | ||||
| 2026-02-11 | 13F | LPL Financial LLC | 34.009 | -3,11 | 14 | -39,13 | ||||
| 2026-02-17 | 13F | Graham Capital Management, L.P. | 321.837 | 21,37 | 135 | -24,16 | ||||
| 2025-11-14 | 13F | Point72 (DIFC) Ltd | 871 | -27,05 | 1 | |||||
| 2025-11-14 | 13F | Wolverine Trading, Llc | 23.799 | 17 | ||||||
| 2025-11-14 | 13F | Wolverine Trading, Llc | Call | 121.400 | 33,85 | 85 | 71,43 | |||
| 2025-11-14 | 13F | Wolverine Trading, Llc | Put | 13.600 | -15,53 | 10 | 12,50 | |||
| 2026-04-13 | 13F | IFP Advisors, Inc | 13.509 | 3 | ||||||
| 2026-01-30 | 13F | R Squared Ltd | 147.191 | 22,19 | 62 | -24,69 | ||||
| 2026-02-05 | 13F | Allworth Financial LP | 1.000 | 0,00 | 0 | |||||
| 2026-02-13 | 13F | MAI Capital Management | 100 | 0,00 | 0 | |||||
| 2026-02-18 | 13F | Oracle Investment Management Inc | 1.035.742 | 3,09 | 435 | -35,65 | ||||
| 2026-01-30 | 13F | Us Bancorp \de\ | 11 | 0,00 | 0 | |||||
| 2026-01-29 | 13F | UBS Group AG | 1.024.475 | -22,44 | 430 | -51,58 | ||||
| 2026-02-05 | 13F | Baader Bank INC | 0 | -100,00 | 0 | -100,00 | ||||
| 2026-04-08 | 13F | Wealth Enhancement Advisory Services, Llc | 72.000 | 58,94 | 22 | 5,00 | ||||
| 2026-02-11 | 13F | Jpmorgan Chase & Co | 489 | 0 | ||||||
| 2026-02-17 | 13F | Boothbay Fund Management, Llc | 277.311 | -21,51 | 116 | -51,05 | ||||
| 2026-02-17 | 13F | Susquehanna International Group, Llp | Put | 548.000 | -35,16 | 230 | -59,36 | |||
| 2026-03-16 | 13F/A | Rockefeller Capital Management L.P. | 2.900 | 0,00 | 1 | 0,00 | ||||
| 2026-02-17 | 13F | Susquehanna International Group, Llp | Call | 470.400 | -2,73 | 198 | -39,20 | |||
| 2026-02-17 | 13F | Two Sigma Advisers, Lp | 4.343.255 | 106,00 | 1.824 | 28,54 | ||||
| 2026-02-17 | 13F | Royal Bank Of Canada | 4.105 | -99,22 | 1 | -99,72 | ||||
| 2025-11-13 | 13F | Franklin Resources Inc | 0 | -100,00 | 0 | -100,00 | ||||
| 2025-11-14 | 13F | Raymond James Financial Inc | 0 | -100,00 | 0 | -100,00 | ||||
| 2026-02-09 | 13F | Geode Capital Management, Llc | 3.866.026 | 17,63 | 1.624 | -26,62 | ||||
| 2026-02-06 | 13F | HighTower Advisors, LLC | 704.456 | -5,33 | 296 | -41,12 | ||||
| 2025-11-04 | 13F | UMA Financial Services, Inc. | 0 | -100,00 | 0 | |||||
| 2026-02-03 | 13F | LJI Wealth Management, LLC | 19.460 | 0,00 | 8 | -38,46 | ||||
| 2025-11-12 | 13F | Transce3nd, LLC | 0 | -100,00 | 0 | |||||
| 2026-02-12 | 13F | Commonwealth Equity Services, Llc | 157.811 | 15,76 | 66 | |||||
| 2026-02-17 | 13F | Northern Trust Corp | 737.867 | 15,35 | 310 | -28,14 | ||||
| 2026-01-20 | 13F | Stratos Wealth Partners, LTD. | 18.040 | -38,93 | 8 | -63,16 | ||||
| 2025-11-14 | 13F | Point72 Europe (London) LLP | 695 | 0 | ||||||
| 2026-02-17 | 13F | Scientech Research LLC | 0 | -100,00 | 0 | -100,00 | ||||
| 2026-02-17 | 13F | Citadel Advisors Llc | Put | 225.900 | -8,76 | 95 | -43,37 | |||
| 2026-02-23 | 13F | Virtu Financial LLC | 132.356 | 0 | ||||||
| 2026-02-17 | 13F | Citadel Advisors Llc | Call | 222.100 | -4,47 | 93 | -40,38 | |||
| 2026-02-17 | 13F | Ikarian Capital, LLC | 1.218.671 | -5,87 | 512 | -41,33 | ||||
| 2026-02-17 | 13F | Woodline Partners LP | 0 | -100,00 | 0 | -100,00 | ||||
| 2026-02-09 | 13F | Jefferies Financial Group Inc. | 53.600 | 0,00 | 23 | -38,89 | ||||
| 2026-02-17 | 13F | MIRAE ASSET GLOBAL ETFS HOLDINGS Ltd. | 348.038 | 74,10 | 146 | 8,96 | ||||
| 2025-11-14 | 13F | Tower Research Capital LLC (TRC) | 0 | -100,00 | 0 | -100,00 | ||||
| 2025-10-30 | 13F | Twin Peaks Wealth Advisors, LLC | 0 | -100,00 | 0 | |||||
| 2026-02-17 | 13F | Susquehanna International Group, Llp | 2.137.120 | -11,70 | 898 | -44,94 | ||||
| 2026-02-17 | 13F | Captrust Financial Advisors | 29.255 | 0,00 | 12 | -36,84 |