Grundlæggende statistik
| Institutionelle aktier (lange) | 11.712.027 - 84,53% (ex 13D/G) - change of -1,02MM shares -8,03% MRQ |
| Institutionel værdi (lang) | $ 606.565 USD ($1000) |
Institutionelt ejerskab og aktionærer
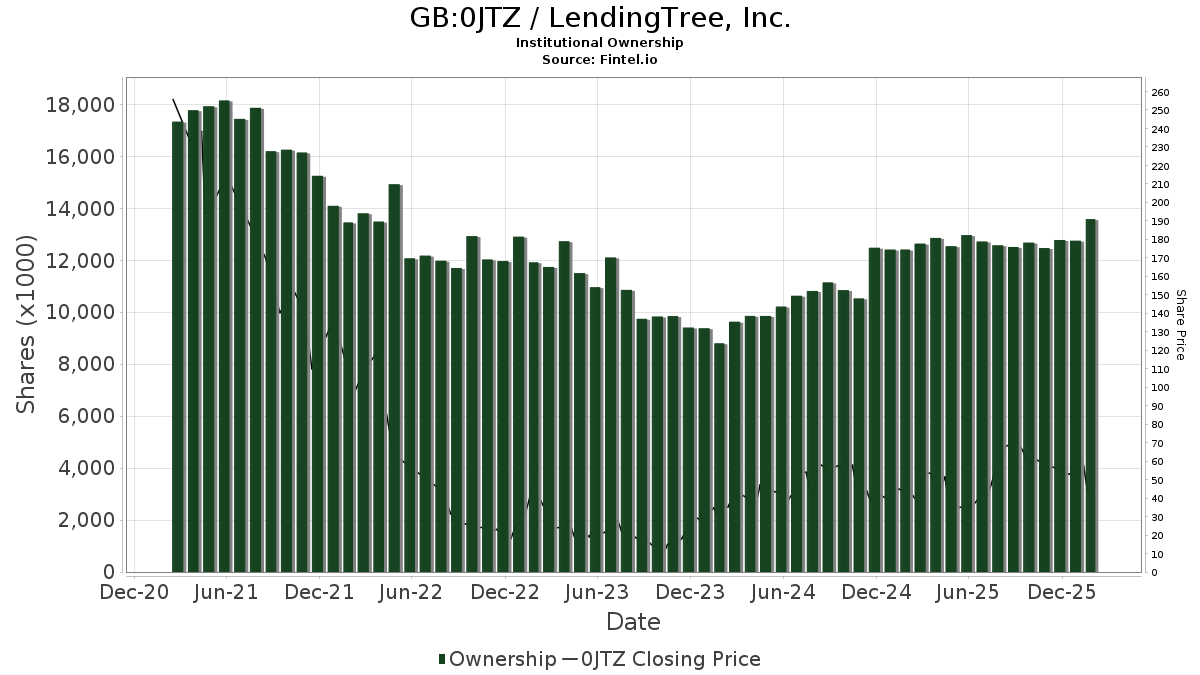
LendingTree, Inc. (GB:0JTZ) har 192 institutionelle ejere og aktionærer, der har indsendt 13D/G- eller 13F-formularer til Securities Exchange Commission (SEC). Disse institutioner har i alt 11,712,027 aktier. Største aktionærer omfatter Mariner, LLC, BlackRock, Inc., Vanguard Group Inc, Jennison Associates Llc, Blue Grotto Capital, LLC, Ameriprise Financial Inc, Punch & Associates Investment Management, Inc., Emerald Advisers, Llc, Jacobs Levy Equity Management, Inc, and Renaissance Technologies Llc .
LendingTree, Inc. (LSE:0JTZ) institutionel ejerskabsstruktur viser aktuelle positioner i virksomheden efter institutioner og fonde, samt seneste ændringer i positionsstørrelse. Større aktionærer kan omfatte individuelle investorer, investeringsforeninger, hedgefonde eller institutioner. Skema 13D angiver, at investoren besidder (eller besidder) mere end 5 % af virksomheden og har til hensigt (eller har til hensigt at) aktivt at forfølge en ændring i forretningsstrategi. Skema 13G indikerer en passiv investering på over 5%.
The share price as of April 10, 2026 is 41,20 / share. Previously, on April 15, 2025, the share price was 45,67 / share. This represents a decline of 9,79% over that period.
Fondens stemningsscore
Fund Sentiment Score (fka Ownership Accumulation Score) finder de aktier, der bliver mest købt af fonde. Det er resultatet af en sofistikeret, multi-faktor kvantitativ model, der identificerer virksomheder med de højeste niveauer af institutionel akkumulering. Scoringsmodellen bruger en kombination af den samlede stigning i oplyste ejere, ændringerne i porteføljeallokeringer i disse ejere og andre målinger. Tallet går fra 0 til 100, hvor højere tal indikerer et højere niveau af akkumulering for sine jævnaldrende, og 50 er gennemsnittet.
Opdateringsfrekvens: Dagligt
Se Ownership Explorer, som giver en liste over højest rangerende virksomheder.
AI+ Ask Fintel’s AI assistant about LendingTree, Inc..
Select a question to share a public post with an AI-crafted answer.
Thinking of good questions…
13F og NPORT arkivering
Detaljer om 13F-arkivering er gratis. Detaljer om NP-ansøgninger kræver et premium-medlemskab. Grønne rækker angiver nye positioner. Røde rækker angiver lukkede positioner. Klik på linket ikon for at se den fulde transaktionshistorik.
Opgrader
for at låse premium-data op og eksportere til Excel ![]() .
.
| Fil dato | Kilde | Investor | Type | Gennemsnitlig pris (Øst) |
Aktier | Δ Aktier (%) |
Rapporteret Værdi ($1000) |
Δ Værdi (%) |
Port Alloc (%) |
|
|---|---|---|---|---|---|---|---|---|---|---|
| 2026-02-10 | 13F | Intech Investment Management Llc | 4.282 | -11,07 | 227 | -27,01 | ||||
| 2026-02-12 | 13F | Jane Street Group, Llc | Put | 54.600 | -23,21 | 2.899 | -37,03 | |||
| 2026-02-17 | 13F | XTX Topco Ltd | 0 | -100,00 | 0 | -100,00 | ||||
| 2026-02-12 | 13F | Jane Street Group, Llc | Call | 75.700 | -28,11 | 4.019 | -41,05 | |||
| 2026-02-11 | 13F | Simplex Trading, Llc | Put | 300 | -99,10 | 16 | 650,00 | |||
| 2026-02-11 | 13F | Simplex Trading, Llc | Call | 2.800 | -53,33 | 149 | ||||
| 2026-02-17 | 13F | Raymond James Financial Inc | 37.334 | 2,79 | 1.982 | -15,70 | ||||
| 2026-02-09 | 13F | Legal & General Group Plc | 9.226 | -23,31 | 490 | -37,15 | ||||
| 2026-02-12 | 13F | State Board Of Administration Of Florida Retirement System | 0 | -100,00 | 0 | |||||
| 2026-02-17 | 13F | Two Sigma Advisers, Lp | 39.700 | -11,58 | 2.108 | -27,49 | ||||
| 2026-02-14 | 13F | Rockefeller Capital Management L.P. | 39 | 2 | ||||||
| 2026-04-07 | 13F | Farther Finance Advisors, LLC | 277 | -50,62 | 12 | -62,07 | ||||
| 2026-02-19 | 13F | Invesco Ltd. | 35.209 | -21,46 | 1.869 | -35,57 | ||||
| 2026-02-11 | 13F | Simplex Trading, Llc | 0 | -100,00 | 0 | |||||
| 2026-04-09 | 13F | Moody National Bank Trust Division | 7.000 | 300 | ||||||
| 2026-02-12 | 13F | Scotia Capital Inc. | 0 | -100,00 | 0 | |||||
| 2026-01-26 | 13F | Cwm, Llc | 1.864 | 4,25 | 0 | |||||
| 2026-02-17 | 13F | Quadrature Capital Ltd | 0 | -100,00 | 0 | |||||
| 2026-02-17 | 13F | Balyasny Asset Management Llc | 29.394 | 1.561 | ||||||
| 2026-02-17 | 13F | G2 Investment Partners Management LLC | 92.467 | -50,41 | 4.909 | -59,33 | ||||
| 2026-02-17 | 13F | Creative Planning | 7.178 | 11,29 | 381 | -8,63 | ||||
| 2026-01-23 | 13F | Private Wealth Management Group, LLC | 104 | 0,00 | 6 | -16,67 | ||||
| 2026-02-11 | 13F | Los Angeles Capital Management Llc | 33.348 | 6,84 | 2.142 | 5,99 | ||||
| 2026-02-13 | 13F | Citigroup Inc | 8.060 | 69,15 | 428 | 38,64 | ||||
| 2026-02-17 | 13F | Janus Henderson Group Plc | 4.600 | 0,00 | 244 | -18,12 | ||||
| 2026-01-30 | 13F | Us Bancorp \de\ | 14 | 0,00 | 1 | |||||
| 2026-02-17 | 13F | Jones Financial Companies Lllp | 655 | -5,76 | 35 | -30,61 | ||||
| 2026-02-13 | 13F | Jacobs Levy Equity Management, Inc | 308.114 | -2,44 | 16.358 | -19,99 | ||||
| 2026-01-29 | 13F | Vanguard Group Inc | 704.686 | 3,53 | 37.412 | -15,09 | ||||
| 2026-02-12 | 13F | Federated Hermes, Inc. | 169.982 | 17,03 | 9.024 | -4,01 | ||||
| 2026-02-13 | 13F | Quinn Opportunity Partners LLC | 6.263 | -19,72 | 333 | -34,13 | ||||
| 2026-02-04 | 13F | Clark Wealth Partners | 0 | -100,00 | 0 | |||||
| 2026-02-06 | 13F | Legato Capital Management LLC | 8.587 | 456 | ||||||
| 2026-01-26 | 13F | Whittier Trust Co Of Nevada Inc | 1 | 0,00 | 0 | |||||
| 2026-02-13 | 13F | MAI Capital Management | 2 | 0 | ||||||
| 2026-02-10 | 13F | Rothschild Investment Llc | 10 | 0,00 | 1 | |||||
| 2026-02-10 | 13F | Connor, Clark & Lunn Investment Management Ltd. | 0 | -100,00 | 0 | |||||
| 2026-02-17 | 13F | EFG International AG | 17.180 | 911 | ||||||
| 2026-02-17 | 13F | Canada Pension Plan Investment Board | 3.800 | 202 | ||||||
| 2026-02-13 | 13F | Arrowstreet Capital, Limited Partnership | 205.900 | -21,96 | 10.931 | -35,99 | ||||
| 2026-02-17 | 13F | Polymer Capital Management (US) LLC | 0 | -100,00 | 0 | |||||
| 2026-02-12 | 13F | RPg Family Wealth Advisory, LLC | 90.757 | -0,40 | 4.818 | -18,31 | ||||
| 2026-01-27 | 13F | Asset Management One Co., Ltd. | 1.610 | -5,01 | 87 | -20,18 | ||||
| 2026-02-17 | 13F | Millennium Management Llc | 16.419 | -94,53 | 872 | -95,51 | ||||
| 2026-01-16 | 13F | Trust Co Of Vermont | 171 | 0,00 | 9 | -18,18 | ||||
| 2026-02-05 | 13F | Bessemer Group Inc | 75 | 0,00 | 0 | |||||
| 2026-02-10 | 13F | Bnp Paribas Arbitrage, Sa | 20.324 | -3,82 | 1.079 | -21,07 | ||||
| 2025-11-13 | 13F | Empowered Funds, LLC | 0 | -100,00 | 0 | |||||
| 2026-02-09 | 13F | Geode Capital Management, Llc | 268.833 | -0,18 | 14.275 | -18,13 | ||||
| 2026-01-28 | 13F | Klp Kapitalforvaltning As | 2.600 | 0,00 | 138 | -17,86 | ||||
| 2025-11-12 | 13F | Headlands Technologies LLC | 0 | -100,00 | 0 | -100,00 | ||||
| 2026-01-23 | 13F | Assetmark, Inc | 4 | 0,00 | 0 | |||||
| 2026-01-20 | 13F | Harbor Capital Advisors, Inc. | 51.913 | -8,67 | 3 | -33,33 | ||||
| 2025-11-10 | 13F | Shenkman Capital Management Inc | 0 | -100,00 | 0 | -100,00 | ||||
| 2026-02-17 | 13F | Symmetry Peak Management Llc | Call | 0 | -100,00 | 0 | ||||
| 2026-02-17 | 13F | Ameriprise Financial Inc | 504.234 | -4,78 | 26.770 | -21,91 | ||||
| 2026-02-17 | 13F | Zacks Investment Management | 29.878 | -8,59 | 1.586 | -25,01 | ||||
| 2026-02-17 | 13F | Royal Bank Of Canada | 55.665 | -22,38 | 2.955 | -36,34 | ||||
| 2026-02-17 | 13F | State Of Wisconsin Investment Board | 148.484 | 9,24 | 7.883 | -10,40 | ||||
| 2026-02-03 | 13F | Farmers & Merchants Investments Inc | 7 | 0,00 | 0 | |||||
| 2026-02-10 | 13F/A | Northwestern Mutual Wealth Management Co | 295 | 16 | ||||||
| 2026-02-17 | 13F | Advisor Group Holdings, Inc. | 82.242 | -8,22 | 4.366 | -28,27 | ||||
| 2026-02-13 | 13F | Manufacturers Life Insurance Company, The | 0 | -100,00 | 0 | |||||
| 2026-03-06 | 13F | Hsbc Holdings Plc | 14.113 | 49,76 | 750 | 22,95 | ||||
| 2026-02-06 | 13F | Tortoise Investment Management, LLC | 0 | -100,00 | 0 | |||||
| 2026-02-17 | 13F | Qube Research & Technologies Ltd | 99.880 | 4,85 | 5.303 | -14,01 | ||||
| 2026-02-17 | 13F | Tudor Investment Corp Et Al | 0 | -100,00 | 0 | -100,00 | ||||
| 2026-01-30 | 13F | Torren Management, LLC | 1.350 | 72 | ||||||
| 2026-02-17 | 13F | VARCOV Co. | 10.256 | 544 | ||||||
| 2026-02-09 | 13F | Huntington National Bank | 1 | 0,00 | 0 | |||||
| 2026-02-13 | 13F | Caitong International Asset Management Co., Ltd | 0 | -100,00 | 0 | |||||
| 2026-02-17 | 13F | Man Group plc | 19.376 | 1.029 | ||||||
| 2026-02-17 | 13F | Dark Forest Capital Management Lp | 0 | -100,00 | 0 | |||||
| 2026-02-13 | 13F | SRS Capital Advisors, Inc. | 27 | -98,72 | 1 | -99,26 | ||||
| 2026-02-17 | 13F | Nomura Holdings Inc | 28.574 | 1.517 | ||||||
| 2026-02-10 | 13F | Envestnet Asset Management Inc | 0 | -100,00 | 0 | |||||
| 2026-01-28 | 13F | Arizona State Retirement System | 0 | -100,00 | 0 | -100,00 | ||||
| 2026-02-06 | 13F | Cullen/frost Bankers, Inc. | 326 | 3,16 | 17 | -15,00 | ||||
| 2026-02-13 | 13F | State Street Corp | 244.954 | 4,39 | 13.005 | -14,38 | ||||
| 2026-02-10 | 13F | Goldman Sachs Group Inc | 111.987 | 16,99 | 5.945 | -4,05 | ||||
| 2026-02-13 | 13F | Dynamic Technology Lab Private Ltd | 11.560 | 80,62 | 614 | 48,31 | ||||
| 2026-02-03 | 13F | SBI Securities Co., Ltd. | 36 | 0,00 | 2 | -50,00 | ||||
| 2025-10-27 | 13F | First Horizon Corp | 0 | -100,00 | 0 | |||||
| 2026-04-06 | 13F | GAMMA Investing LLC | 203 | 395,12 | 9 | 300,00 | ||||
| 2026-01-21 | 13F | Signature Resources Capital Management, LLC | 3 | 0,00 | 0 | |||||
| 2026-02-17 | 13F | Bridgeway Capital Management Inc | 5.000 | 0,00 | 265 | -17,96 | ||||
| 2026-02-17 | 13F | Cetera Investment Advisers | 27.110 | 48,16 | 1.439 | 21,54 | ||||
| 2026-02-17 | 13F | Philadelphia Financial Management of San Francisco, LLC | 251.459 | 13.350 | ||||||
| 2026-02-13 | 13F | Walleye Trading LLC | 33 | 2 | ||||||
| 2026-02-13 | 13F | Walleye Trading LLC | Put | 5.400 | -69,32 | 287 | -74,89 | |||
| 2026-02-17 | 13F | Trexquant Investment LP | 26.835 | -82,52 | 1.425 | -85,67 | ||||
| 2026-02-13 | 13F | Walleye Trading LLC | Call | 11.500 | -3,36 | 611 | -20,78 | |||
| 2026-04-13 | 13F | True Wealth Design, LLC | 61 | 916,67 | 3 | |||||
| 2026-02-09 | 13F | Emerald Mutual Fund Advisers Trust | 218.269 | -1,12 | 11.588 | -18,90 | ||||
| 2026-01-27 | 13F | TD Waterhouse Canada Inc. | 0 | -100,00 | 0 | -100,00 | ||||
| 2026-02-17 | 13F | Northern Trust Corp | 90.165 | -6,03 | 4.787 | -22,93 | ||||
| 2026-02-06 | 13F | Gsa Capital Partners Llp | 0 | -100,00 | 0 | |||||
| 2026-02-17 | 13F | Fmr Llc | 170.101 | 27,29 | 9.031 | 4,39 | ||||
| 2026-02-17 | 13F | Mangrove Partners | 4.955 | 263 | ||||||
| 2026-02-11 | 13F | Group One Trading, L.p. | Put | 2.100 | -88,40 | 111 | -90,52 | |||
| 2026-02-12 | 13F | Steward Partners Investment Advisory, Llc | 31 | -97,64 | 2 | -98,82 | ||||
| 2026-02-11 | 13F | Group One Trading, L.p. | 1.041 | -89,06 | 55 | -91,06 | ||||
| 2026-03-12 | 13F/A | Peak6 Llc | Put | 16.100 | 31,97 | 855 | 8,24 | |||
| 2026-02-11 | 13F | Group One Trading, L.p. | Call | 6.800 | -28,42 | 361 | -41,21 | |||
| 2026-02-13 | 13F | Victory Capital Management Inc | 103.250 | -1,87 | 5.482 | -19,52 | ||||
| 2026-03-12 | 13F/A | Peak6 Llc | Call | 11.200 | -69,15 | 595 | -74,71 | |||
| 2025-11-14 | 13F | Cubist Systematic Strategies, LLC | 0 | -100,00 | 0 | -100,00 | ||||
| 2026-02-12 | 13F | Alps Advisors Inc | 15.166 | 25,37 | 805 | 2,81 | ||||
| 2026-02-17 | 13F | Aquatic Capital Management LLC | 0 | -100,00 | 0 | |||||
| 2026-03-12 | 13F/A | Peak6 Llc | 3.864 | 205 | ||||||
| 2026-02-13 | 13F | Blue Grotto Capital, LLC | 584.931 | 64,27 | 31.054 | 34,73 | ||||
| 2026-02-17 | 13F | Graham Capital Management, L.P. | 4.195 | 223 | ||||||
| 2026-02-10 | 13F | Root Financial Partners, LLC | 10 | 1 | ||||||
| 2026-02-13 | 13F | National Bank Of Canada /fi/ | 0 | -100,00 | 0 | |||||
| 2026-02-17 | 13F | Nomura Holdings Inc | Call | 0 | -100,00 | 0 | ||||
| 2026-02-10 | 13F | Quantbot Technologies LP | 0 | -100,00 | 0 | |||||
| 2026-02-11 | 13F | Janney Montgomery Scott LLC | 0 | -100,00 | 0 | |||||
| 2026-02-12 | 13F | Principal Securities, Inc. | 0 | -100,00 | 0 | |||||
| 2026-02-05 | 13F | Cornerstone Wealth Management, LLC | 7.618 | -6,73 | 404 | -23,48 | ||||
| 2026-02-04 | 13F | Ameritas Advisory Services, LLC | 0 | -100,00 | 0 | |||||
| 2026-04-02 | 13F | Byrne Asset Management LLC | 2.634 | 113 | ||||||
| 2026-02-09 | 13F | Connors Investor Services Inc | 3.814 | 0,00 | 202 | -17,89 | ||||
| 2026-02-13 | 13F | Morgan Stanley | 82.749 | -27,85 | 4.393 | -40,83 | ||||
| 2026-02-17 | 13F | Public Employees Retirement System Of Ohio | 1.891 | 100 | ||||||
| 2025-11-13 | 13F | Jacobs Asset Management, Llc | 0 | -100,00 | 0 | |||||
| 2026-04-06 | 13F | Versant Capital Management, Inc | 675 | 4.118,75 | 29 | |||||
| 2026-02-13 | 13F | Barclays Plc | 26.025 | 39,69 | 1.382 | 14,61 | ||||
| 2026-01-23 | 13F | State of Alaska, Department of Revenue | 4.998 | 820,44 | 0 | |||||
| 2026-02-18 | 13F | Mackenzie Financial Corp | 12.385 | 659 | ||||||
| 2026-02-13 | 13F | Pinnacle Wealth Planning Services, Inc. | 186 | 10 | ||||||
| 2026-01-30 | 13F | Jennison Associates Llc | 586.173 | 31.120 | ||||||
| 2026-02-12 | 13F | MetLife Investment Management, LLC | 6.532 | 0,00 | 347 | -18,01 | ||||
| 2026-02-13 | 13F | Parkside Financial Bank & Trust | 6 | 0,00 | 0 | |||||
| 2026-02-11 | 13F | Meeder Asset Management Inc | 1.780 | 94 | ||||||
| 2026-01-09 | 13F | SG Americas Securities, LLC | 12.485 | 107,74 | 1 | |||||
| 2026-02-06 | 13F | EverSource Wealth Advisors, LLC | 243 | -8,99 | 13 | -29,41 | ||||
| 2026-02-12 | 13F | Renaissance Technologies Llc | 272.500 | -30,13 | 14.467 | -42,69 | ||||
| 2026-02-13 | 13F | American Century Companies Inc | 31.165 | 2,86 | 1.655 | -15,66 | ||||
| 2026-02-17 | 13F | Bank Of America Corp /de/ | 53.213 | -57,66 | 2.825 | -65,27 | ||||
| 2026-02-17 | 13F | Price T Rowe Associates Inc /md/ | 11.398 | 5,67 | 1 | |||||
| 2026-02-17 | 13F | Susquehanna International Group, Llp | Call | 54.600 | -57,28 | 2.899 | -64,97 | |||
| 2026-01-27 | 13F | Zurcher Kantonalbank (Zurich Cantonalbank) | 5.940 | 0,00 | 315 | -17,97 | ||||
| 2026-02-13 | 13F | Walleye Capital LLC | 0 | -100,00 | 0 | -100,00 | ||||
| 2026-02-17 | 13F | Susquehanna International Group, Llp | 16.924 | -43,39 | 898 | -53,59 | ||||
| 2026-02-17 | 13F | Susquehanna International Group, Llp | Put | 38.900 | -61,06 | 2.065 | -68,06 | |||
| 2026-01-15 | 13F | Allspring Global Investments Holdings, LLC | 8.280 | 440 | ||||||
| 2026-02-11 | 13F | Parallel Advisors, LLC | 0 | -100,00 | 0 | |||||
| 2026-02-17 | 13F | Citadel Advisors Llc | 45.708 | -83,70 | 2.427 | -86,64 | ||||
| 2025-11-14 | 13F | Wolverine Trading, Llc | 19.737 | 1.336 | ||||||
| 2026-04-10 | 13F | Intellectus Partners, LLC | 32.800 | -0,61 | 1.406 | -19,70 | ||||
| 2026-02-17 | 13F | Citadel Advisors Llc | Put | 19.300 | -22,49 | 1.025 | -36,44 | |||
| 2025-11-14 | 13F | Wolverine Trading, Llc | Call | 18.400 | 1.245 | |||||
| 2026-02-17 | 13F | Citadel Advisors Llc | Call | 32.300 | -15,67 | 1.715 | -30,86 | |||
| 2025-11-14 | 13F | Wolverine Trading, Llc | Put | 14.300 | 968 | |||||
| 2026-01-28 | 13F | Universal- Beteiligungs- und Servicegesellschaft mbH | 7.844 | 416 | ||||||
| 2026-02-13 | 13F | Smartleaf Asset Management LLC | 280 | 4.566,67 | 15 | |||||
| 2026-02-06 | 13F | Covestor Ltd | 42 | 4.100,00 | 0 | |||||
| 2026-02-13 | 13F | Charles Schwab Investment Management Inc | 98.704 | -2,64 | 5.240 | -20,15 | ||||
| 2026-04-10 | 13F | Armstrong Advisory Group, Inc | 3 | 0,00 | 0 | |||||
| 2026-02-13 | 13F | Marshall Wace, Llp | 67.206 | 3.568 | ||||||
| 2026-02-17 | 13F | Tudor Investment Corp Et Al | Call | 4.200 | -4,55 | 223 | -21,83 | |||
| 2026-02-12 | 13F | Swiss National Bank | 22.800 | 2,24 | 1.210 | -16,15 | ||||
| 2026-02-12 | 13F | SWAN Capital LLC | 7 | 0,00 | 0 | |||||
| 2026-02-20 | 13F | Sunbelt Securities, Inc. | 11.996 | -2,08 | 637 | -19,80 | ||||
| 2026-02-12 | 13F | Counterpoint Mutual Funds LLC | 7.708 | -12,13 | 387 | 14,16 | ||||
| 2026-02-02 | 13F | Fifth Third Bancorp | 600 | 32 | ||||||
| 2026-02-17 | 13F | Punch & Associates Investment Management, Inc. | 469.647 | 35,09 | 24.934 | 10,80 | ||||
| 2026-02-17 | 13F | Lazard Asset Management Llc | 4.040 | 0,00 | 214 | -18,01 | ||||
| 2026-02-13 | 13F | Cullen Capital Management, LLC | 24.636 | -0,67 | 1.308 | -18,57 | ||||
| 2026-01-30 | 13F | New York State Teachers Retirement System | 1.017 | 0 | ||||||
| 2026-02-13 | 13F | Panagora Asset Management Inc | 45.057 | 447,41 | 2.392 | 349,62 | ||||
| 2026-02-17 | 13F | Aqr Capital Management Llc | 42.904 | 6,13 | 2.252 | -13,91 | ||||
| 2025-10-15 | 13F | Stephens Consulting, LLC | 0 | -100,00 | 0 | |||||
| 2026-02-12 | 13F | Hrt Financial Lp | 0 | -100,00 | 0 | |||||
| 2026-01-29 | 13F | Comerica Bank | 304 | -0,98 | 16 | -15,79 | ||||
| 2026-02-13 | 13F | Squarepoint Ops LLC | 0 | -100,00 | 0 | |||||
| 2026-02-17 | 13F | Engineers Gate Manager LP | 27.154 | -7,54 | 1.442 | -24,20 | ||||
| 2026-02-17 | 13F | Susquehanna Portfolio Strategies, LLC | 33.847 | -13,72 | 1.797 | -29,26 | ||||
| 2026-02-23 | 13F | Leonteq Securities AG | 0 | -100,00 | 0 | |||||
| 2026-02-17 | 13F | Quantinno Capital Management LP | 6.096 | 16,60 | 324 | -4,44 | ||||
| 2026-02-13 | 13F | Rhumbline Advisers | 14.857 | -11,53 | 789 | -27,44 | ||||
| 2026-02-13 | 13F | Verition Fund Management LLC | 5.700 | -8,01 | 303 | -24,69 | ||||
| 2026-02-05 | 13F | Amalgamated Bank | 351 | -12,47 | 0 | |||||
| 2026-02-17 | 13F | Advisory Services Network, LLC | 0 | -100,00 | 0 | |||||
| 2026-02-17 | 13F | D. E. Shaw & Co., Inc. | 0 | -100,00 | 0 | |||||
| 2026-02-17 | 13F | California State Teachers Retirement System | 11.572 | 10,27 | 614 | -9,57 | ||||
| 2026-01-15 | 13F | Nisa Investment Advisors, Llc | 24 | 0,00 | 1 | 0,00 | ||||
| 2026-02-12 | 13F | Jane Street Group, Llc | 0 | -100,00 | 0 | -100,00 | ||||
| 2025-11-04 | 13F | Thrivent Financial For Lutherans | 0 | -100,00 | 0 | |||||
| 2026-02-09 | 13F | Emerald Advisers, Llc | 361.945 | -1,35 | 19.216 | -19,09 | ||||
| 2026-02-11 | 13F | Deutsche Bank Ag\ | 8.980 | -0,39 | 477 | -18,35 | ||||
| 2026-02-17 | 13F | Alliancebernstein L.p. | 10.423 | 0,00 | 553 | -17,95 | ||||
| 2026-02-13 | 13F | Great West Life Assurance Co /can/ | 1.456 | 0,00 | 0 | |||||
| 2026-04-08 | 13F | Wealth Enhancement Advisory Services, Llc | 5.150 | 210 | ||||||
| 2026-01-29 | 13F | UBS Group AG | 143.924 | 374,21 | 7.641 | 289,00 | ||||
| 2026-02-11 | 13F | Ameritas Investment Partners, Inc. | 934 | 50 | ||||||
| 2026-02-13 | 13F | Kestra Advisory Services, LLC | 393 | 21 | ||||||
| 2026-02-17 | 13F | Two Sigma Investments, Lp | 27.566 | -71,00 | 1.463 | -76,22 | ||||
| 2026-02-17 | 13F | Signature Equity Partners, LLC | 25 | 1 | ||||||
| 2026-02-17 | 13F | Shay Capital LLC | 5.000 | 265 | ||||||
| 2026-02-06 | 13F | Pnc Financial Services Group, Inc. | 85 | 6,25 | 5 | -20,00 | ||||
| 2026-01-09 | 13F | Assenagon Asset Management S.A. | 158.951 | 2,49 | 8.439 | -15,94 | ||||
| 2026-02-13 | 13F | Walleye Capital LLC | Call | 8.000 | -44,06 | 425 | -54,16 | |||
| 2026-02-13 | 13F | Walleye Capital LLC | Put | 3.300 | -71,05 | 175 | -76,26 | |||
| 2026-02-13 | 13F | Police & Firemen's Retirement System of New Jersey | 3.073 | 0,00 | 163 | -17,68 | ||||
| 2026-02-06 | 13F | Larson Financial Group LLC | 335 | 33,47 | 18 | 6,25 | ||||
| 2026-02-13 | 13F | Y-Intercept (Hong Kong) Ltd | 42.525 | 51,11 | 2.258 | 23,94 | ||||
| 2026-02-09 | 13F | Hartland & Co., LLC | 0 | -100,00 | 0 | |||||
| 2026-02-12 | 13F | Dimensional Fund Advisors Lp | 254.557 | 1,31 | 13.515 | -16,92 | ||||
| 2026-01-29 | 13F | IMC-Chicago, LLC | Call | 18.700 | -52,42 | 993 | -60,99 | |||
| 2026-02-10 | 13F | Acadian Asset Management Llc | 201.611 | 4,39 | 11 | -16,67 | ||||
| 2026-02-17 | 13F | Polar Asset Management Partners Inc. | 0 | -100,00 | 0 | |||||
| 2026-02-09 | 13F | New Age Alpha Advisors, LLC | 0 | -100,00 | 0 | |||||
| 2026-02-09 | 13F | Quest Partners LLC | 1.577 | -57,12 | 84 | -65,13 | ||||
| 2026-01-21 | 13F | SJS Investment Consulting Inc. | 59 | -42,16 | 3 | -50,00 | ||||
| 2026-02-17 | 13F | Boothbay Fund Management, Llc | 21.690 | -50,91 | 1.152 | -59,74 | ||||
| 2026-02-18 | 13F | GWM Advisors LLC | 3.750 | 861,54 | 199 | 696,00 | ||||
| 2026-02-05 | 13F | Allworth Financial LP | 19 | -5,00 | 1 | 0,00 | ||||
| 2026-01-09 | 13F | Congress Asset Management Co /ma | 0 | -100,00 | 0 | -100,00 | ||||
| 2026-02-03 | 13F | McIlrath & Eck, LLC | 1.117 | 59 | ||||||
| 2026-02-17 | 13F | Optiver Holding B.V. | 137 | 107,58 | 7 | 75,00 | ||||
| 2026-01-15 | 13F | Range Financial Group LLC | 0 | -100,00 | 0 | -100,00 | ||||
| 2026-01-29 | 13F | RMG Wealth Management LLC | 1 | 0,00 | 0 | |||||
| 2025-11-14 | 13F | Point72 (DIFC) Ltd | 0 | -100,00 | 0 | |||||
| 2026-02-05 | 13F | Plante Moran Financial Advisors, LLC | 160 | 8 | ||||||
| 2026-02-10 | 13F | State of Wyoming | 2.095 | -18,51 | 111 | -33,13 | ||||
| 2026-01-26 | 13F | Whittier Trust Co | 4 | 0,00 | 0 | |||||
| 2026-01-27 | 13F | Financial Management Professionals, Inc. | 465 | 25 | ||||||
| 2026-04-13 | 13F | Mather Group, Llc. | 9 | 0 | ||||||
| 2026-02-17 | 13F | Brevan Howard Capital Management LP | 16.182 | 141,52 | 859 | 98,38 | ||||
| 2026-02-17 | 13F | Russell Investments Group, Ltd. | 23.542 | -0,32 | 1.250 | -18,26 | ||||
| 2026-02-03 | 13F | Acorn Financial Advisory Services Inc /adv | 6.314 | 14,67 | 335 | -5,90 | ||||
| 2026-02-17 | 13F | Private Capital Management, LLC | 0 | -100,00 | 0 | |||||
| 2026-02-13 | 13F | BNP Paribas Asset Management Holding S.A. | 152 | 0 | ||||||
| 2026-04-10 | 13F/A | OP Asset Management Ltd | 799 | 34 | ||||||
| 2026-02-10 | 13F | CIBC World Markets Inc. | 0 | -100,00 | 0 | |||||
| 2025-10-27 | 13F | Nordea Investment Management Ab | 0 | -100,00 | 0 | |||||
| 2026-02-13 | 13F | Caxton Associates Llp | 0 | -100,00 | 0 | |||||
| 2026-02-10 | 13F | Bank of New York Mellon Corp | 34.288 | 4,34 | 1.820 | -14,43 | ||||
| 2026-02-17 | 13F | Jump Financial, LLC | 0 | -100,00 | 0 | |||||
| 2026-02-11 | 13F | Jpmorgan Chase & Co | 35.306 | 67,89 | 1.874 | 37,69 | ||||
| 2026-04-13 | 13F | IFP Advisors, Inc | 107 | 970,00 | 5 | |||||
| 2026-02-17 | 13F | Tower Research Capital LLC (TRC) | 306 | -67,82 | 16 | -73,77 | ||||
| 2026-02-11 | 13F | LPL Financial LLC | 11.942 | -13,08 | 634 | -28,68 | ||||
| 2026-02-12 | 13F | New York State Common Retirement Fund | 4.590 | 0,00 | 244 | -18,18 | ||||
| 2025-11-21 | 13F | Nebula Research & Development LLC | 0 | -100,00 | 0 | -100,00 | ||||
| 2026-02-12 | 13F | BlackRock, Inc. | 1.069.732 | 12,43 | 56.792 | -7,79 | ||||
| 2026-02-12 | 13F | Quadrant Capital Group Llc | 44 | 2 | ||||||
| 2026-02-13 | 13F | Ubs Asset Management Americas Inc | 17.867 | 22,03 | 949 | 0,11 | ||||
| 2026-02-13 | 13F | Vontobel Holding Ltd. | 3.774 | -2,00 | 200 | -19,68 | ||||
| 2026-02-13 | 13F | Mariner, LLC | 1.760.407 | 31,51 | 93.461 | 7,86 | ||||
| 2026-02-17 | 13F | MIRAE ASSET GLOBAL ETFS HOLDINGS Ltd. | 19.556 | -6,24 | 1.038 | -23,34 | ||||
| 2026-02-12 | 13F | Nuveen, LLC | 153.925 | 9,55 | 8.172 | -10,15 | ||||
| 2026-02-13 | 13F | Wells Fargo & Company/mn | 20.273 | -6,64 | 1.076 | -23,42 | ||||
| 2026-01-26 | 13F | Mirae Asset Global Investments Co., Ltd. | 49 | 19,51 | 3 | 0,00 | ||||
| 2026-02-06 | 13F | GPS Wealth Strategies Group, LLC | 100 | -50,00 | 5 | -58,33 | ||||
| 2025-11-10 | 13F | Jupiter Asset Management Ltd | 0 | -100,00 | 0 | -100,00 | ||||
| 2026-02-12 | 13F | Integrated Quantitative Investments LLC | 14.639 | 777 | ||||||
| 2026-02-13 | 13F | Sterling Capital Management LLC | 115 | 64,29 | 6 | 50,00 | ||||
| 2026-01-21 | 13F | Flagship Harbor Advisors, Llc | 1 | 0 | ||||||
| 2026-02-17 | 13F | Credit Agricole S A | 49.837 | 0,00 | 2.646 | -17,98 |