Grundlæggende statistik
| Institutionelle ejere | 156 total, 145 long only, 0 short only, 11 long/short - change of -13,81% MRQ |
| Del pris | 9,63 |
| Gennemsnitlig porteføljeallokering | 0.0173 % - change of -80,23% MRQ |
| Institutionelle aktier (lange) | 33.997.996 (ex 13D/G) - change of 0,81MM shares 2,45% MRQ |
| Institutionel værdi (lang) | $ 194.941 USD ($1000) |
Institutionelt ejerskab og aktionærer
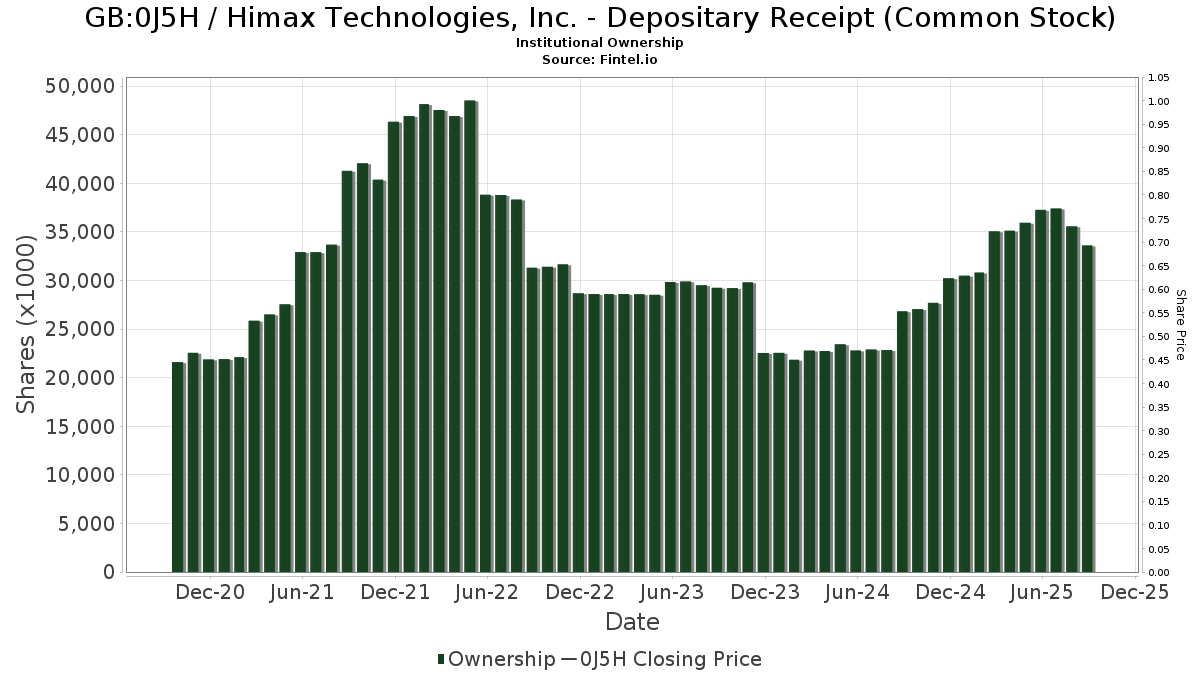
Himax Technologies, Inc. - Depositary Receipt (Common Stock) (GB:0J5H) har 156 institutionelle ejere og aktionærer, der har indsendt 13D/G- eller 13F-formularer til Securities Exchange Commission (SEC). Disse institutioner har i alt 33,997,996 aktier. Største aktionærer omfatter Acadian Asset Management Llc, Lazard Asset Management Llc, Robeco Institutional Asset Management B.V., Handelsbanken Fonder AB, State Street Corp, Allianz Asset Management GmbH, Group One Trading, L.p., Morgan Stanley, Mitsubishi UFJ Kokusai Asset Management Co., Ltd., and Polunin Capital Partners Ltd .
Himax Technologies, Inc. - Depositary Receipt (Common Stock) (LSE:0J5H) institutionel ejerskabsstruktur viser aktuelle positioner i virksomheden efter institutioner og fonde, samt seneste ændringer i positionsstørrelse. Større aktionærer kan omfatte individuelle investorer, investeringsforeninger, hedgefonde eller institutioner. Skema 13D angiver, at investoren besidder (eller besidder) mere end 5 % af virksomheden og har til hensigt (eller har til hensigt at) aktivt at forfølge en ændring i forretningsstrategi. Skema 13G indikerer en passiv investering på over 5%.
The share price as of March 16, 2026 is 9,63 / share. Previously, on December 2, 2025, the share price was 7,70 / share. This represents an increase of 25,09% over that period.
Fondens stemningsscore
Fund Sentiment Score (fka Ownership Accumulation Score) finder de aktier, der bliver mest købt af fonde. Det er resultatet af en sofistikeret, multi-faktor kvantitativ model, der identificerer virksomheder med de højeste niveauer af institutionel akkumulering. Scoringsmodellen bruger en kombination af den samlede stigning i oplyste ejere, ændringerne i porteføljeallokeringer i disse ejere og andre målinger. Tallet går fra 0 til 100, hvor højere tal indikerer et højere niveau af akkumulering for sine jævnaldrende, og 50 er gennemsnittet.
Opdateringsfrekvens: Dagligt
Se Ownership Explorer, som giver en liste over højest rangerende virksomheder.
AI+ Ask Fintel’s AI assistant about Himax Technologies, Inc. - Depositary Receipt (Common Stock).
Select a question to share a public post with an AI-crafted answer.
Thinking of good questions…
13F og NPORT arkivering
Detaljer om 13F-arkivering er gratis. Detaljer om NP-ansøgninger kræver et premium-medlemskab. Grønne rækker angiver nye positioner. Røde rækker angiver lukkede positioner. Klik på linket ikon for at se den fulde transaktionshistorik.
Opgrader
for at låse premium-data op og eksportere til Excel ![]() .
.
| Fil dato | Kilde | Investor | Type | Gennemsnitlig pris (Øst) |
Aktier | Δ Aktier (%) |
Rapporteret Værdi ($1000) |
Δ Værdi (%) |
Port Alloc (%) |
|
|---|---|---|---|---|---|---|---|---|---|---|
| 2026-02-11 | 13F | T3 Companies, LLC | Call | 12.400 | 1 | |||||
| 2026-02-12 | 13F | Commonwealth Equity Services, Llc | 11.965 | -11,50 | 98 | |||||
| 2026-02-13 | 13F | JustInvest LLC | 22.051 | -3,34 | 181 | -10,45 | ||||
| 2026-02-17 | 13F | Numerai GP LLC | 12.814 | -66,93 | 105 | -69,59 | ||||
| 2026-02-12 | 13F | Gagnon Securities Llc | 53.946 | -0,99 | 442 | -8,32 | ||||
| 2025-12-15 | 13F | FNY Investment Advisers, LLC | 0 | -100,00 | 0 | |||||
| 2026-02-17 | 13F | Fmr Llc | 1.650 | -1,08 | 14 | -7,14 | ||||
| 2026-01-21 | 13F | Kraematon Investment Advisors, Inc | 0 | -100,00 | 0 | |||||
| 2026-03-03 | 13F/A | Caitong International Asset Management Co., Ltd | 27 | 0 | ||||||
| 2026-02-11 | 13F | Group One Trading, L.p. | Call | 1.218.200 | -4,26 | 9.977 | -11,20 | |||
| 2026-02-11 | 13F | Group One Trading, L.p. | Put | 433.500 | 38,54 | 3.550 | 28,53 | |||
| 2026-02-11 | 13F | Jpmorgan Chase & Co | 52.270 | 300,35 | 428 | 272,17 | ||||
| 2026-02-10 | 13F | Bank of New York Mellon Corp | 23.711 | 11,13 | 194 | 3,19 | ||||
| 2026-02-02 | 13F | CENTRAL TRUST Co | 0 | -100,00 | 0 | |||||
| 2026-02-13 | 13F | Wells Fargo & Company/mn | 441.980 | 16,61 | 3.620 | 8,16 | ||||
| 2026-01-16 | 13F | Compagnie Lombard Odier SCmA | 0 | -100,00 | 0 | |||||
| 2026-01-14 | 13F | Spire Wealth Management | 0 | -100,00 | 0 | |||||
| 2026-02-09 | 13F | Employees Retirement System of Texas | 0 | -100,00 | 0 | |||||
| 2026-02-17 | 13F | Lazard Asset Management Llc | 5.718.698 | 9,37 | 46.836 | 1,44 | ||||
| 2026-02-17 | 13F | Engineers Gate Manager LP | 14.217 | -38,87 | 116 | -43,41 | ||||
| 2026-02-12 | 13F | Steward Partners Investment Advisory, Llc | 300 | 0,00 | 2 | 0,00 | ||||
| 2026-01-22 | 13F | Pinnacle Bancorp, Inc. | 0 | -100,00 | 0 | |||||
| 2026-02-10 | 13F | Clear Harbor Asset Management, LLC | 179.665 | -0,72 | 1.471 | -7,89 | ||||
| 2026-02-10 | 13F | Clear Harbor Asset Management, LLC | Put | 55.000 | 450 | |||||
| 2026-01-23 | 13F | Farther Finance Advisors, LLC | 8.106 | 128,72 | 66 | 112,90 | ||||
| 2026-01-21 | 13F | Steadtrust LLC | 32.600 | -20,68 | 267 | -26,52 | ||||
| 2026-02-10 | 13F | Acadian Asset Management Llc | 6.072.291 | -3,83 | 50 | -10,91 | ||||
| 2026-02-17 | 13F | Aspen Grove Capital, LLC | 18.483 | -12,80 | 151 | -19,25 | ||||
| 2026-02-06 | 13F | EverSource Wealth Advisors, LLC | 5.025 | -13,60 | 41 | -19,61 | ||||
| 2026-02-13 | 13F | Walleye Trading LLC | Call | 59.000 | -62,08 | 483 | -64,82 | |||
| 2026-02-17 | 13F | Two Sigma Securities, Llc | 26.058 | -26,53 | 213 | -31,95 | ||||
| 2026-02-13 | 13F | State Street Corp | 1.600.126 | 9,57 | 13.105 | 1,63 | ||||
| 2025-11-14 | 13F | Wellington Management Group Llp | 0 | -100,00 | 0 | |||||
| 2026-02-17 | 13F | Cetera Investment Advisers | 17.188 | 10,98 | 141 | 2,94 | ||||
| 2025-10-02 | 13F/A | Mirabella Financial Services Llp | 63.078 | 469 | ||||||
| 2026-02-13 | 13F | Walleye Trading LLC | Put | 37.900 | -50,00 | 310 | -53,66 | |||
| 2026-02-13 | 13F | Headlands Technologies LLC | 19.254 | 158 | ||||||
| 2026-02-06 | 13F | Bare Financial Services, Inc | 117 | 0,00 | 1 | -100,00 | ||||
| 2026-02-17 | 13F | Credit Agricole S A | 80.000 | 655 | ||||||
| 2026-02-13 | 13F | Police & Firemen's Retirement System of New Jersey | 4.978 | 41 | ||||||
| 2026-02-11 | 13F | Curio Wealth, Llc | 1.000 | 8 | ||||||
| 2026-02-17 | 13F | Aquatic Capital Management LLC | 12.930 | 185,62 | 106 | 169,23 | ||||
| 2026-02-17 | 13F | Advisor Group Holdings, Inc. | 13.591 | -33,38 | 111 | -35,09 | ||||
| 2026-02-03 | 13F | Redwood Wealth Management Group, LLC | 52.910 | -19,48 | 433 | -25,34 | ||||
| 2026-02-12 | 13F | Principal Securities, Inc. | 0 | -100,00 | 0 | -100,00 | ||||
| 2025-11-14 | 13F | Berkshire Capital Holdings Inc | 0 | -100,00 | 0 | |||||
| 2026-02-13 | 13F | Caxton Associates Llp | 58.706 | 0,00 | 481 | -7,34 | ||||
| 2026-02-13 | 13F | First Trust Advisors Lp | 277.284 | 13,66 | 2.271 | 5,39 | ||||
| 2025-11-13 | 13F | Formula Growth Ltd | 0 | -100,00 | 0 | |||||
| 2026-01-30 | 13F | CBOE Vest Financial, LLC | 17.596 | 70,83 | 144 | 60,00 | ||||
| 2026-02-13 | 13F | Verition Fund Management LLC | 52.148 | -0,85 | 427 | -7,97 | ||||
| 2026-02-18 | 13F | GWM Advisors LLC | 45 | 0,00 | 0 | |||||
| 2026-02-17 | 13F | Millennium Management Llc | 190.701 | 634,94 | 1.562 | 581,66 | ||||
| 2026-02-13 | 13F | Squarepoint Ops LLC | 97.235 | 149,54 | 796 | 131,40 | ||||
| 2025-11-14 | 13F | Graham Capital Management, L.P. | 0 | -100,00 | 0 | |||||
| 2026-02-19 | 13F | CI Private Wealth, LLC | 21.035 | -2,70 | 172 | -9,47 | ||||
| 2026-02-17 | 13F | Ameriflex Group, Inc. | 1.800 | -50,00 | 15 | -54,84 | ||||
| 2026-02-03 | 13F | Ballentine Partners, LLC | 33.010 | -4,82 | 270 | -11,76 | ||||
| 2026-01-15 | 13F | Nisa Investment Advisors, Llc | 372 | 3 | ||||||
| 2026-02-17 | 13F | Mairs & Power Inc | 0 | -100,00 | 0 | |||||
| 2025-10-28 | 13F | Qrg Capital Management, Inc. | 0 | -100,00 | 0 | |||||
| 2026-02-10 | 13F | Bnp Paribas Arbitrage, Sa | 135.580 | -35,63 | 1.110 | -40,29 | ||||
| 2026-02-12 | 13F | Hm Payson & Co | 540 | 0,00 | 4 | 0,00 | ||||
| 2026-01-30 | 13F | Us Bancorp \de\ | 29.020 | 16,23 | 238 | 7,73 | ||||
| 2025-11-14 | 13F | Nomura Holdings Inc | 0 | -100,00 | 0 | |||||
| 2026-02-11 | 13F | Allianz Asset Management GmbH | 1.538.000 | 31,67 | 12.596 | 22,13 | ||||
| 2026-02-17 | 13F | Jump Financial, LLC | 82.519 | -29,23 | 676 | -34,40 | ||||
| 2026-02-13 | 13F | Transamerica Financial Advisors, Inc. | 25 | 4,17 | 0 | |||||
| 2026-02-10 | 13F | Clear Harbor Asset Management, LLC | Call | 0 | -100,00 | 0 | -100,00 | |||
| 2026-02-12 | 13F | Quadrant Capital Group Llc | 29.457 | -63,29 | 241 | -65,96 | ||||
| 2026-02-12 | 13F | Renaissance Technologies Llc | 194.261 | -43,21 | 1.591 | -47,35 | ||||
| 2025-10-27 | 13F | First Horizon Corp | 0 | -100,00 | 0 | |||||
| 2026-02-10 | 13F | Murphy & Mullick Capital Management Corp | 100 | 0,00 | 1 | |||||
| 2026-01-23 | 13F | Robeco Institutional Asset Management B.V. | 4.400.014 | 3,91 | 36.036 | -3,62 | ||||
| 2026-02-06 | 13F | Vestmark Advisory Solutions, Inc. | 40.946 | 335 | ||||||
| 2025-09-23 | NP | NTKLX - Voya Multi-Manager International Small Cap Fund Class A | 28.343 | 0,00 | 251 | 25,50 | ||||
| 2026-01-23 | 13F | Assetmark, Inc | 6.080 | 19,59 | 50 | 11,36 | ||||
| 2026-02-11 | 13F | Parallel Advisors, LLC | 11.243 | -6,39 | 92 | -13,21 | ||||
| 2026-02-13 | 13F | Marshall Wace, Llp | 0 | -100,00 | 0 | |||||
| 2026-01-27 | 13F | WealthCollab, LLC | 1.238 | -12,20 | 10 | -16,67 | ||||
| 2026-02-13 | 13F | Herald Investment Management Ltd | 400.000 | 0,00 | 3.276 | -7,14 | ||||
| 2026-02-17 | 13F | Point72 Asset Management, L.P. | Call | 15.200 | 124 | |||||
| 2026-02-17 | 13F | Point72 Asset Management, L.P. | 51.321 | 420 | ||||||
| 2026-02-06 | 13F | Larson Financial Group LLC | 8.183 | 15,76 | 67 | 8,06 | ||||
| 2026-03-11 | 13F | Leonteq Securities AG | 0 | -100,00 | 0 | |||||
| 2026-02-17 | 13F | Northern Trust Corp | 14.696 | 1,66 | 120 | -5,51 | ||||
| 2026-02-13 | 13F | Polymer Capital Management (HK) LTD | 0 | -100,00 | 0 | |||||
| 2025-11-14 | 13F | Northwestern Mutual Wealth Management Co | 0 | -100,00 | 0 | |||||
| 2026-02-10 | 13F | Root Financial Partners, LLC | 354 | 0,00 | 3 | -33,33 | ||||
| 2026-02-18 | 13F | Garton & Associates Financial Advisors LLC | 431 | 4 | ||||||
| 2026-01-20 | 13F | Signaturefd, Llc | 12.183 | -6,17 | 100 | -13,16 | ||||
| 2026-02-12 | 13F | CIBC Private Wealth Group, LLC | 258 | 0,00 | 2 | 0,00 | ||||
| 2026-01-26 | 13F | Mirae Asset Global Investments Co., Ltd. | 53.164 | 43,26 | 435 | 33,03 | ||||
| 2026-02-17 | 13F | Parallax Volatility Advisers, L.P. | 39.624 | -5,42 | 325 | -12,20 | ||||
| 2026-02-17 | 13F | EFG International AG | 5.000 | 41 | ||||||
| 2025-11-12 | 13F | Neuberger Berman Group LLC | 0 | -100,00 | 0 | |||||
| 2026-02-18 | 13F | Vident Advisory, LLC | 149.064 | -7,27 | 1.221 | -14,02 | ||||
| 2026-02-05 | 13F | Allworth Financial LP | 2.211 | 16,80 | 18 | 12,50 | ||||
| 2026-02-13 | 13F | Smartleaf Asset Management LLC | 2.767 | 23 | ||||||
| 2026-02-17 | 13F | Two Sigma Advisers, Lp | 10.900 | -93,20 | 89 | -93,71 | ||||
| 2025-11-13 | 13F/A | Peak6 Llc | 0 | -100,00 | 0 | -100,00 | ||||
| 2026-01-20 | 13F | Polunin Capital Partners Ltd | 706.750 | -4,41 | 6 | 0,00 | ||||
| 2026-02-10 | 13F | Envestnet Asset Management Inc | 307.351 | 9,52 | 2.517 | 1,57 | ||||
| 2026-02-17 | 13F | Balyasny Asset Management Llc | 0 | -100,00 | 0 | |||||
| 2026-02-10 | 13F | Natixis Advisors, L.p. | 0 | -100,00 | 0 | |||||
| 2026-02-13 | 13F | MAI Capital Management | 99 | -87,13 | 1 | -100,00 | ||||
| 2026-02-13 | 13F | Walleye Capital LLC | Call | 9.000 | -59,28 | 74 | -62,56 | |||
| 2026-02-13 | 13F | Walleye Capital LLC | Put | 38.200 | 664,00 | 313 | 609,09 | |||
| 2026-02-13 | 13F | Walleye Capital LLC | 7.107 | 58 | ||||||
| 2025-11-13 | 13F | Deutsche Bank Ag\ | 0 | -100,00 | 0 | |||||
| 2026-02-17 | 13F | Susquehanna Fundamental Investments, Llc | 154.769 | 1.268 | ||||||
| 2026-01-27 | 13F | Proffitt & Goodson Inc | 422 | 0,00 | 3 | 0,00 | ||||
| 2026-02-11 | 13F | Simplex Trading, Llc | Call | 196.000 | -3,92 | 1.605 | 160.400,00 | |||
| 2026-01-29 | 13F | UMA Financial Services, Inc. | 52 | 0 | ||||||
| 2026-02-13 | 13F | Rhumbline Advisers | 22.227 | 1,81 | 182 | -5,21 | ||||
| 2026-01-16 | 13F | Ronald Blue Trust, Inc. | 6.925 | -7,72 | 57 | -15,15 | ||||
| 2026-02-03 | 13F | NewEdge Wealth, LLC | 19.707 | 26,28 | 161 | 14,18 | ||||
| 2026-02-12 | 13F | BlackRock, Inc. | 257.150 | -35,21 | 2.106 | -39,90 | ||||
| 2026-02-06 | 13F | Global Retirement Partners, LLC | 74 | 0,00 | 1 | |||||
| 2026-01-12 | 13F | CVA Family Office, LLC | 52 | 0,00 | 0 | |||||
| 2026-01-29 | 13F | IMC-Chicago, LLC | Put | 72.600 | -31,83 | 595 | -36,81 | |||
| 2026-01-29 | 13F | IMC-Chicago, LLC | Call | 129.200 | 24,59 | 1.058 | 15,63 | |||
| 2025-11-13 | 13F | Hel Ved Capital Management Ltd | 0 | -100,00 | 0 | |||||
| 2026-02-06 | 13F | Kilter Group LLC | 0 | -100,00 | 0 | |||||
| 2026-02-12 | 13F | Rossby Financial, LCC | 115 | 0,00 | 1 | |||||
| 2026-02-13 | 13F | Cornerstone Financial Management LLC | 304 | 2 | ||||||
| 2025-11-14 | 13F | Cubist Systematic Strategies, LLC | Call | 15.200 | -63,55 | 134 | -63,98 | |||
| 2026-01-29 | 13F | Sanctuary Advisors, LLC | 24.838 | 13,79 | 203 | 5,73 | ||||
| 2026-02-06 | 13F | IFP Advisors, Inc | 0 | -100,00 | 0 | -100,00 | ||||
| 2026-02-17 | 13F | XTX Topco Ltd | 29.261 | 240 | ||||||
| 2026-02-13 | 13F | Citigroup Inc | 27.430 | 2,37 | 225 | -5,08 | ||||
| 2026-02-12 | 13F | Federation des caisses Desjardins du Quebec | 61.286 | 29,64 | 501 | 20,14 | ||||
| 2026-01-29 | 13F | UBS Group AG | 276.059 | -45,18 | 2.261 | -49,17 | ||||
| 2026-02-05 | 13F | Td Private Client Wealth Llc | 1.814 | -1,14 | 15 | -12,50 | ||||
| 2026-01-29 | 13F | IMC-Chicago, LLC | 46.356 | 0,79 | 380 | -6,65 | ||||
| 2025-10-15 | 13F | CWM Advisors, LLC | 0 | -100,00 | 0 | |||||
| 2026-02-13 | 13F | SRS Capital Advisors, Inc. | 2.055 | 781,97 | 17 | 700,00 | ||||
| 2026-02-17 | 13F | Two Sigma Investments, Lp | 382.289 | -26,84 | 3.131 | -32,15 | ||||
| 2026-02-12 | 13F | New York State Common Retirement Fund | 17.799 | -46,26 | 146 | -50,34 | ||||
| 2026-02-17 | 13F | Ameriprise Financial Inc | 57.316 | -27,07 | 469 | -32,32 | ||||
| 2026-02-11 | 13F | O'shaughnessy Asset Management, Llc | 24.476 | -5,11 | 200 | -11,89 | ||||
| 2026-02-09 | 13F | Legal & General Group Plc | 0 | -100,00 | 0 | |||||
| 2026-02-09 | 13F | Huntington National Bank | 1.814 | 11,77 | 15 | 0,00 | ||||
| 2026-02-11 | 13F | Simplex Trading, Llc | Put | 83.700 | -17,86 | 686 | ||||
| 2026-02-11 | 13F | Simplex Trading, Llc | 14.542 | 119 | ||||||
| 2026-02-10 | 13F | Savant Capital, LLC | 20.646 | 68,87 | 169 | 57,94 | ||||
| 2026-02-17 | 13F | Jones Financial Companies Lllp | 428 | 42,19 | 4 | 50,00 | ||||
| 2026-03-05 | 13F | Gunpowder Capital Management, LLC dba Oliver Wealth Management | 1.300 | 11 | ||||||
| 2026-01-27 | 13F | BankPlus Trust Department | 2.500 | 0,00 | 20 | -9,09 | ||||
| 2025-11-14 | 13F | Wolverine Trading, Llc | 48.034 | 8,75 | 416 | -0,24 | ||||
| 2025-11-14 | 13F | Wolverine Trading, Llc | Call | 51.700 | 16,97 | 448 | 7,19 | |||
| 2025-11-14 | 13F | Wolverine Trading, Llc | Put | 31.100 | -16,84 | 269 | -23,80 | |||
| 2026-02-13 | 13F | Barclays Plc | 5 | 0 | ||||||
| 2026-02-13 | 13F | Morgan Stanley | 842.263 | -31,27 | 6.898 | -36,25 | ||||
| 2026-02-05 | 13F | DnB Asset Management AS | 0 | -100,00 | 0 | |||||
| 2025-09-26 | NP | HAOSX - Harbor Overseas Fund Institutional Class | 46.174 | -36,61 | 409 | -20,58 | ||||
| 2026-02-17 | 13F | D. E. Shaw & Co., Inc. | 632.045 | 80,35 | 5.176 | 67,29 | ||||
| 2026-02-03 | 13F | Mitsubishi UFJ Kokusai Asset Management Co., Ltd. | 825.971 | 24,55 | 7.046 | 20,32 | ||||
| 2026-02-09 | 13F | Putnam Fl Investment Management Co | 0 | -100,00 | 0 | |||||
| 2026-01-14 | 13F | Jfs Wealth Advisors, Llc | 0 | -100,00 | 0 | |||||
| 2025-10-10 | 13F | Sound Income Strategies, LLC | 0 | -100,00 | 0 | |||||
| 2025-09-29 | NP | CRNSX - CATHOLIC RESPONSIBLE INVESTMENTS INTERNATIONAL SMALL-CAP FUND Institutional Shares | 7.465 | 103,74 | 66 | 164,00 | ||||
| 2026-02-13 | 13F | Pinpoint Asset Management (Singapore) Pte. Ltd. | 1 | 0,00 | 0 | |||||
| 2026-02-17 | 13F | Citadel Advisors Llc | Put | 454.400 | -1,41 | 3.722 | -8,55 | |||
| 2025-12-16 | 13F | Garde Capital, Inc. | 0 | -100,00 | 0 | |||||
| 2026-02-17 | 13F | Citadel Advisors Llc | 325.095 | 102,36 | 2.663 | 87,73 | ||||
| 2026-02-17 | 13F | Public Employees Retirement System Of Ohio | 220.146 | -9,37 | 1.803 | -15,95 | ||||
| 2026-02-17 | 13F | Citadel Advisors Llc | Call | 227.100 | 17,24 | 1.860 | 8,71 | |||
| 2026-01-05 | 13F | GAMMA Investing LLC | 9.139 | -3,39 | 75 | -10,84 | ||||
| 2026-01-09 | 13F | SG Americas Securities, LLC | 16.209 | -1,85 | 0 | |||||
| 2026-02-17 | 13F | Warren Averett Asset Management, LLC | 16.203 | 16,22 | 133 | 7,32 | ||||
| 2025-11-14 | 13F | Susquehanna Portfolio Strategies, LLC | 0 | -100,00 | 0 | -100,00 | ||||
| 2026-02-12 | 13F | Jane Street Group, Llc | Call | 153.800 | -55,69 | 1.260 | -58,91 | |||
| 2026-02-12 | 13F | Jane Street Group, Llc | 63.067 | 0,83 | 517 | -6,52 | ||||
| 2026-01-09 | 13F | Park Place Capital Corp | 1.537 | 0,00 | 13 | -7,69 | ||||
| 2026-02-12 | 13F | Jane Street Group, Llc | Put | 14.000 | -89,93 | 115 | -90,71 | |||
| 2026-02-13 | 13F | Stifel Financial Corp | 466.813 | -1,34 | 3.823 | -8,50 | ||||
| 2025-10-31 | 13F | Whittier Trust Co | 0 | -100,00 | 0 | |||||
| 2026-02-17 | 13F | Clark Capital Management Group, Inc. | 119.576 | 0,00 | 979 | -7,20 | ||||
| 2026-02-13 | 13F | Arkadios Wealth Advisors | 20.402 | 19,14 | 167 | 10,60 | ||||
| 2025-11-17 | 13F | Sender Co & Partners, Inc. | 0 | -100,00 | 0 | |||||
| 2026-02-09 | 13F | Harbour Investments, Inc. | 0 | -100,00 | 0 | |||||
| 2025-11-13 | 13F | Bank Of Montreal /can/ | 0 | -100,00 | 0 | -100,00 | ||||
| 2026-02-05 | 13F | 1620 Investment Advisors, Inc. | 7 | 0,00 | 0 | |||||
| 2026-02-17 | 13F | Voloridge Investment Management, Llc | 49.883 | 409 | ||||||
| 2026-01-26 | 13F | Cwm, Llc | 1.285 | -6,55 | 0 | |||||
| 2026-02-17 | 13F | Creative Planning | 31.132 | -10,32 | 255 | -16,99 | ||||
| 2026-02-13 | 13F | Peak6 Llc | Put | 34.300 | 281 | |||||
| 2026-02-17 | 13F | Royal Bank Of Canada | 146.442 | 15,78 | 1.199 | 7,34 | ||||
| 2026-02-13 | 13F | Peak6 Llc | Call | 167.000 | 339,47 | 1.368 | 308,06 | |||
| 2025-10-23 | 13F | JTC Employer Solutions Trusteee Ltd | 0 | -100,00 | 0 | |||||
| 2026-03-05 | 13F | Bayban | 100 | 1 | ||||||
| 2026-02-17 | 13F | Susquehanna International Group, Llp | Call | 389.800 | 7,92 | 3.192 | 0,09 | |||
| 2025-10-10 | 13F | USA Financial Portformulas Corp | 0 | -100,00 | 0 | -100,00 | ||||
| 2026-02-17 | 13F | Susquehanna International Group, Llp | 354.973 | 34,22 | 2.907 | 24,50 | ||||
| 2026-02-17 | 13F | Susquehanna International Group, Llp | Put | 158.800 | 56,61 | 1.301 | 45,25 | |||
| 2025-11-13 | 13F | FORA Capital, LLC | 0 | -100,00 | 0 | |||||
| 2026-01-12 | 13F | Foster Group, Inc. | 0 | -100,00 | 0 | |||||
| 2026-02-03 | 13F | SBI Securities Co., Ltd. | 3.434 | 0,09 | 28 | -6,67 | ||||
| 2026-02-05 | 13F | Bessemer Group Inc | 0 | -100,00 | 0 | |||||
| 2026-02-17 | 13F | Raymond James Financial Inc | 13.810 | -14,97 | 113 | -20,98 | ||||
| 2026-02-11 | 13F | IMA Wealth, Inc. | 59 | 0 | ||||||
| 2026-02-12 | 13F | Brinker Capital Investments, LLC | 53.091 | 18,06 | 435 | 9,32 | ||||
| 2026-02-12 | 13F | Triumph Capital Management | 3.150 | 0,00 | 26 | -7,41 | ||||
| 2026-02-17 | 13F | Advisory Services Network, LLC | 0 | -100,00 | 0 | |||||
| 2026-02-09 | 13F | Geode Capital Management, Llc | 102.534 | 2,18 | 840 | -5,30 | ||||
| 2026-02-10 | 13F | Commonwealth Of Pennsylvania Public School Empls Retrmt Sys | 62.383 | 0,00 | 511 | -7,27 | ||||
| 2026-01-28 | 13F | Barrett & Company, Inc. | 100 | 0,00 | 1 | |||||
| 2026-02-17 | 13F | Soviero Asset Management, LP | 0 | -100,00 | 0 | |||||
| 2026-02-17 | 13F | Tower Research Capital LLC (TRC) | 1.740 | -65,83 | 14 | -68,18 | ||||
| 2026-02-12 | 13F | Brown Brothers Harriman & Co | 0 | -100,00 | 0 | |||||
| 2026-02-11 | 13F | Franklin Resources Inc | 26.340 | 75,82 | 216 | 62,88 | ||||
| 2026-02-11 | 13F | LPL Financial LLC | 59.206 | -1,24 | 485 | -8,51 | ||||
| 2026-02-17 | 13F | Bank Of America Corp /de/ | 120.423 | -43,75 | 986 | -47,83 | ||||
| 2026-02-17 | 13F | Russell Investments Group, Ltd. | 233.457 | -5,65 | 1.921 | -10,32 | ||||
| 2026-02-10 | 13F | Goldman Sachs Group Inc | 265.818 | -66,90 | 2.177 | -69,29 | ||||
| 2025-11-14 | 13F | Skopos Labs, Inc. | 0 | -100,00 | 0 | |||||
| 2026-02-06 | 13F | ProShare Advisors LLC | 31.688 | 28,29 | 260 | 18,81 | ||||
| 2026-02-06 | 13F | Pnc Financial Services Group, Inc. | 388 | 0,00 | 3 | 0,00 | ||||
| 2026-02-17 | 13F | Soviero Asset Management, LP | Call | 0 | -100,00 | 0 | ||||
| 2026-02-17 | 13F | Wiley Bros.-aintree Capital, Llc | 17.702 | -11,25 | 145 | -18,18 | ||||
| 2026-02-06 | 13F | Gsa Capital Partners Llp | 10.517 | -91,71 | 0 | -100,00 | ||||
| 2026-01-29 | 13F | Aprio Wealth Management, LLC | 12.492 | -0,52 | 102 | -7,27 | ||||
| 2026-02-14 | 13F | Rockefeller Capital Management L.P. | 5.340 | 976,61 | 44 | 975,00 | ||||
| 2026-02-06 | 13F | Handelsbanken Fonder AB | 3.429.263 | 95,69 | 28 | 86,67 | ||||
| 2026-02-13 | 13F | Sei Investments Co | 267.298 | 0,00 | 2.189 | -7,25 | ||||
| 2025-11-13 | 13F | Clear Street Markets Llc | 0 | -100,00 | 0 | -100,00 |