Grundlæggende statistik
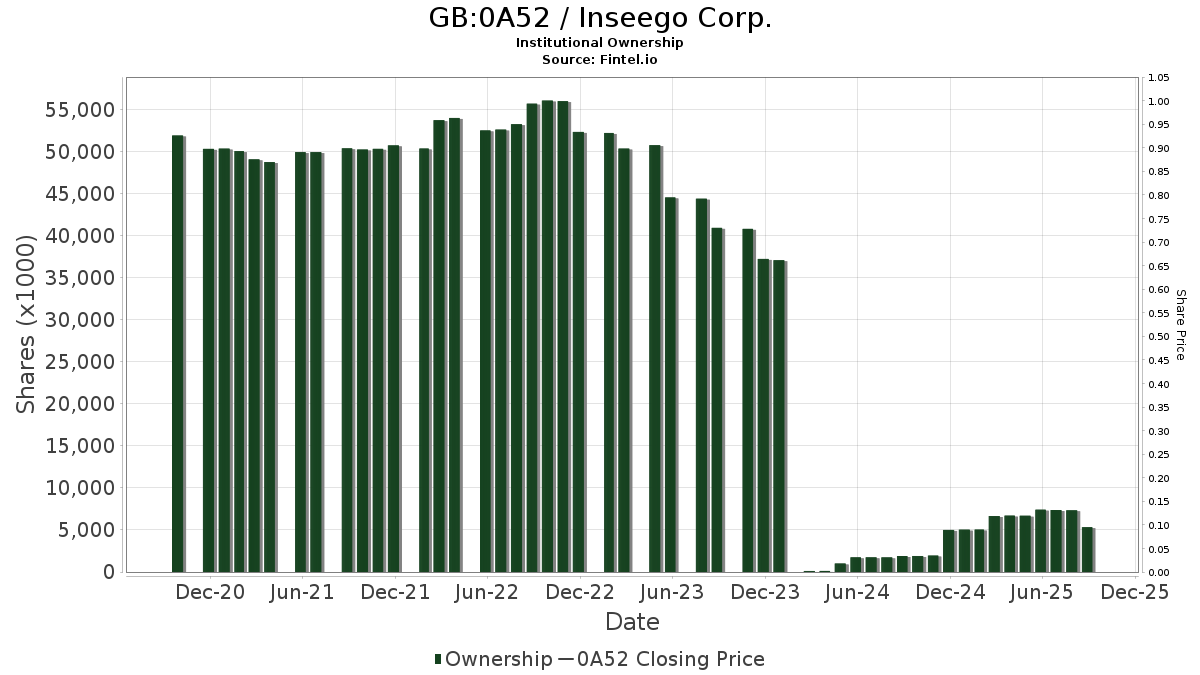
| Institutionelle aktier (lange) | 5.123.759 - 31,55% (ex 13D/G) - change of 0,05MM shares 1,06% MRQ |
| Institutionel værdi (lang) | $ 52.748 USD ($1000) |
Institutionelt ejerskab og aktionærer
Inseego Corp. (GB:0A52) har 86 institutionelle ejere og aktionærer, der har indsendt 13D/G- eller 13F-formularer til Securities Exchange Commission (SEC). Disse institutioner har i alt 5,123,759 aktier. Største aktionærer omfatter BlackRock, Inc., Vanguard Group Inc, Royce & Associates Lp, First Eagle Investment Management, LLC, Gendell Jeffrey L, Geode Capital Management, Llc, Blue Door Asset Management, LLC, State Street Corp, Caption Management, LLC, and Wolverine Asset Management Llc .
Inseego Corp. (LSE:0A52) institutionel ejerskabsstruktur viser aktuelle positioner i virksomheden efter institutioner og fonde, samt seneste ændringer i positionsstørrelse. Større aktionærer kan omfatte individuelle investorer, investeringsforeninger, hedgefonde eller institutioner. Skema 13D angiver, at investoren besidder (eller besidder) mere end 5 % af virksomheden og har til hensigt (eller har til hensigt at) aktivt at forfølge en ændring i forretningsstrategi. Skema 13G indikerer en passiv investering på over 5%.
The share price as of May 1, 2026 is 19,01 / share. Previously, on May 2, 2025, the share price was 8,52 / share. This represents an increase of 122,99% over that period.
Fondens stemningsscore
Fund Sentiment Score (fka Ownership Accumulation Score) finder de aktier, der bliver mest købt af fonde. Det er resultatet af en sofistikeret, multi-faktor kvantitativ model, der identificerer virksomheder med de højeste niveauer af institutionel akkumulering. Scoringsmodellen bruger en kombination af den samlede stigning i oplyste ejere, ændringerne i porteføljeallokeringer i disse ejere og andre målinger. Tallet går fra 0 til 100, hvor højere tal indikerer et højere niveau af akkumulering for sine jævnaldrende, og 50 er gennemsnittet.
Opdateringsfrekvens: Dagligt
Se Ownership Explorer, som giver en liste over højest rangerende virksomheder.
AI+ Ask Fintel’s AI assistant about Inseego Corp..
Select a question to share a public post with an AI-crafted answer.
Thinking of good questions…
13F og NPORT arkivering
Detaljer om 13F-arkivering er gratis. Detaljer om NP-ansøgninger kræver et premium-medlemskab. Grønne rækker angiver nye positioner. Røde rækker angiver lukkede positioner. Klik på linket ikon for at se den fulde transaktionshistorik.
Opgrader
for at låse premium-data op og eksportere til Excel ![]() .
.
| Fil dato | Kilde | Investor | Type | Gennemsnitlig pris (Øst) |
Aktier | Δ Aktier (%) |
Rapporteret Værdi ($1000) |
Δ Værdi (%) |
Port Alloc (%) |
|
|---|---|---|---|---|---|---|---|---|---|---|
| 2026-02-11 | 13F | Los Angeles Capital Management Llc | 43.605 | 712 | ||||||
| 2025-11-10 | 13F/A | Flaharty Asset Management, LLC | 0 | -100,00 | 0 | |||||
| 2025-11-14 | 13F | Raymond James Financial Inc | 0 | -100,00 | 0 | |||||
| 2026-02-12 | 13F | Wealthspire Advisors, LLC | 0 | -100,00 | 0 | |||||
| 2025-11-05 | 13F | Koesten, Hirschmann & Crabtree, INC. | 0 | -100,00 | 0 | |||||
| 2026-04-29 | 13F | Police & Firemen's Retirement System of New Jersey | 3.342 | 0,00 | 37 | 8,82 | ||||
| 2026-02-17 | 13F | Millennium Management Llc | 108.513 | 1.114 | ||||||
| 2026-02-17 | 13F | Susquehanna International Group, Llp | Call | 55.200 | -51,41 | 567 | -66,71 | |||
| 2026-02-17 | 13F | Susquehanna International Group, Llp | 17.160 | 176 | ||||||
| 2026-02-17 | 13F | Susquehanna International Group, Llp | Put | 57.100 | -73,29 | 586 | -81,69 | |||
| 2026-04-29 | 13F | KERR FINANCIAL PLANNING Corp | 30 | 0,00 | 0 | |||||
| 2026-02-09 | 13F | Quest Partners LLC | 36.908 | 3,89 | 379 | -28,63 | ||||
| 2026-02-17 | 13F | Balyasny Asset Management Llc | 28.406 | -94,59 | 292 | -96,29 | ||||
| 2026-02-10 | 13F/A | Northwestern Mutual Wealth Management Co | 50 | 1 | ||||||
| 2026-02-06 | 13F | Larson Financial Group LLC | 36.996 | 32,67 | 380 | -9,11 | ||||
| 2026-02-17 | 13F | Advisor Group Holdings, Inc. | 40.019 | -9,76 | 411 | -37,31 | ||||
| 2025-11-14 | 13F | Squarepoint Ops LLC | 0 | -100,00 | 0 | -100,00 | ||||
| 2026-02-17 | 13F | Citadel Advisors Llc | Put | 21.100 | 30,25 | 217 | -10,74 | |||
| 2025-11-20 | 13F | Maven Securities LTD | 0 | -100,00 | 0 | |||||
| 2026-02-17 | 13F | Citadel Advisors Llc | Call | 36.200 | -19,02 | 372 | -44,54 | |||
| 2025-11-14 | 13F | Sofos Investments, Inc. | 0 | -100,00 | 0 | |||||
| 2026-02-04 | 13F | First Eagle Investment Management, LLC | 435.849 | 209,44 | 4.476 | 112,33 | ||||
| 2025-11-12 | 13F | Headlands Technologies LLC | 0 | -100,00 | 0 | -100,00 | ||||
| 2025-11-12 | 13F | Us Bancorp \de\ | 0 | -100,00 | 0 | |||||
| 2026-02-14 | 13F | Rockefeller Capital Management L.P. | 20 | 0,00 | 0 | |||||
| 2026-02-05 | 13F | Allworth Financial LP | 40 | -14,89 | 0 | |||||
| 2026-03-12 | 13F/A | Peak6 Llc | Call | 84.100 | -22,20 | 864 | -46,66 | |||
| 2026-02-06 | 13F | Global Retirement Partners, LLC | 10 | 0,00 | 0 | |||||
| 2026-02-13 | 13F | Ubs Asset Management Americas Inc | 1.004 | 10 | ||||||
| 2025-11-14 | 13F | Wolverine Trading, Llc | Call | 17.900 | 265 | |||||
| 2025-11-14 | 13F | Wolverine Trading, Llc | Put | 50.100 | 742 | |||||
| 2026-02-06 | 13F | Covestor Ltd | 0 | -100,00 | 0 | |||||
| 2026-01-16 | 13F | Crewe Advisors LLC | 1.000 | 0,00 | 10 | -28,57 | ||||
| 2026-02-19 | 13F | Invesco Ltd. | 11.940 | 123 | ||||||
| 2026-02-17 | 13F | Russell Investments Group, Ltd. | 1.028 | 0,00 | 11 | -33,33 | ||||
| 2025-11-14 | 13F | Wolverine Trading, Llc | 15.194 | 225 | ||||||
| 2026-04-16 | 13F | Capital Advisors, Ltd. LLC | 4.400 | 0,00 | 0 | |||||
| 2026-02-17 | 13F | Tower Research Capital LLC (TRC) | 3.134 | 207,25 | 32 | 113,33 | ||||
| 2026-04-06 | 13F | GAMMA Investing LLC | 90 | 1 | ||||||
| 2026-02-13 | 13F | Marshall Wace, Llp | 0 | -100,00 | 0 | |||||
| 2026-02-12 | 13F | Renaissance Technologies Llc | 71.817 | 24,37 | 738 | -14,70 | ||||
| 2026-02-17 | 13F | Public Employees Retirement System Of Ohio | 2.049 | 0,00 | 21 | -30,00 | ||||
| 2026-02-18 | 13F | GWM Advisors LLC | 30 | 0 | ||||||
| 2026-04-30 | 13F | Kestra Advisory Services, LLC | 0 | -100,00 | 0 | |||||
| 2026-02-10 | 13F | Quantbot Technologies LP | 17 | 0 | ||||||
| 2026-04-28 | 13F | SBI Securities Co., Ltd. | 357 | -57,19 | 4 | -62,50 | ||||
| 2026-04-21 | 13F | Financial Consulate, Inc | 241 | 0,00 | 3 | 0,00 | ||||
| 2026-02-13 | 13F | Morgan Stanley | 23.763 | -45,99 | 244 | -62,92 | ||||
| 2026-01-29 | 13F | Comerica Bank | 120 | 1 | ||||||
| 2026-02-06 | 13F | Fortis Group Advisors, LLC | 61 | 0,00 | 1 | |||||
| 2026-04-24 | 13F | Medallion Wealth Advisors, LLC | 0 | -100,00 | 0 | |||||
| 2026-02-17 | 13F | Price T Rowe Associates Inc /md/ | 18.237 | 0,00 | 0 | |||||
| 2026-02-17 | 13F | VestGen Advisors, LLC | 11.844 | 122 | ||||||
| 2026-02-13 | 13F | MAI Capital Management | 40 | 0,00 | 0 | |||||
| 2026-04-30 | 13F | Nuveen, LLC | 16.169 | 0,00 | 180 | 7,83 | ||||
| 2026-02-12 | 13F | Jane Street Group, Llc | 31.220 | 321 | ||||||
| 2026-02-12 | 13F | Jane Street Group, Llc | Call | 17.000 | -30,89 | 175 | -52,72 | |||
| 2026-02-13 | 13F | Jacobs Levy Equity Management, Inc | 118.220 | 25,01 | 1.214 | -14,20 | ||||
| 2026-02-13 | 13F | Gendell Jeffrey L | 429.301 | 34,56 | 4.409 | -7,71 | ||||
| 2026-02-13 | 13F | SRS Capital Advisors, Inc. | 0 | -100,00 | 0 | |||||
| 2026-02-10 | 13F | Axq Capital, Lp | 12.219 | 125 | ||||||
| 2026-02-17 | 13F | Northern Trust Corp | 82.952 | -8,86 | 852 | -37,52 | ||||
| 2026-04-28 | 13F | Stratos Wealth Partners, LTD. | 31.066 | -0,35 | 345 | 7,81 | ||||
| 2026-02-10 | 13F | Goldman Sachs Group Inc | 33.935 | 231,82 | 349 | 127,45 | ||||
| 2026-02-17 | 13F | Toronto Dominion Bank | 50.501 | 910,02 | 519 | 600,00 | ||||
| 2026-01-30 | 13F | Simplicity Wealth,LLC | 0 | -100,00 | 0 | |||||
| 2026-02-09 | 13F | Geode Capital Management, Llc | 280.652 | 1,76 | 2.883 | -30,20 | ||||
| 2026-02-12 | 13F | Dimensional Fund Advisors Lp | 102.812 | 88,32 | 1.056 | 29,13 | ||||
| 2026-02-11 | 13F | Jpmorgan Chase & Co | 34.578 | 566,24 | 355 | 361,04 | ||||
| 2026-02-11 | 13F | Franklin Resources Inc | 10.518 | 108 | ||||||
| 2026-02-09 | 13F | Royce & Associates Lp | 508.000 | 25,43 | 5.217 | -13,94 | ||||
| 2026-02-13 | 13F | Barclays Plc | 19.593 | 11,88 | 201 | -23,28 | ||||
| 2026-02-12 | 13F | Marex Group plc | 0 | -100,00 | 0 | |||||
| 2026-05-01 | 13F | Fifth Third Bancorp | 120 | 1 | ||||||
| 2026-01-26 | 13F | Cwm, Llc | 102 | -16,39 | 0 | |||||
| 2026-02-13 | 13F | Rhumbline Advisers | 16.545 | -9,23 | 170 | -37,87 | ||||
| 2026-02-12 | 13F | New York State Common Retirement Fund | 2.000 | 0,00 | 21 | -31,03 | ||||
| 2026-01-23 | 13F | Diversify Advisory Services, LLC | 12.700 | -0,39 | 154 | -26,09 | ||||
| 2026-02-10 | 13F | Bank of New York Mellon Corp | 27.830 | -7,50 | 286 | -36,67 | ||||
| 2026-02-02 | 13F | Wolverine Asset Management Llc | 148.741 | -37,44 | 1.528 | -57,08 | ||||
| 2026-02-10 | 13F | State of Wyoming | 706 | 7 | ||||||
| 2025-11-13 | 13F | Mackenzie Financial Corp | 0 | -100,00 | 0 | |||||
| 2026-02-17 | 13F | MIRAE ASSET GLOBAL ETFS HOLDINGS Ltd. | 5.930 | 5,74 | 61 | -27,71 | ||||
| 2025-11-06 | 13F | Ameritas Advisory Services, LLC | 0 | -100,00 | 0 | |||||
| 2026-02-17 | 13F | Occudo Quantitative Strategies Lp | 10.065 | -7,18 | 103 | -36,42 | ||||
| 2026-02-17 | 13F | Blue Door Asset Management, LLC | 215.160 | 2.210 | ||||||
| 2026-02-13 | 13F | Citigroup Inc | 4.647 | 1.789,02 | 48 | 1.466,67 | ||||
| 2026-02-17 | 13F | Fmr Llc | 807 | 38,18 | 8 | 0,00 | ||||
| 2025-12-18 | 13F | Danske Bank A/s | 0 | -100,00 | 0 | |||||
| 2026-02-13 | 13F | Wells Fargo & Company/mn | 14.207 | 44,60 | 146 | -1,36 | ||||
| 2026-02-12 | 13F | BlackRock, Inc. | 782.672 | 4,07 | 8.038 | -28,60 | ||||
| 2026-04-22 | 13F | Sterling Capital Management LLC | 391 | -35,26 | 4 | -33,33 | ||||
| 2025-11-13 | 13F | Winton Capital Group Ltd | 0 | -100,00 | 0 | |||||
| 2025-11-13 | 13F | Acadian Asset Management Llc | 0 | -100,00 | 0 | |||||
| 2026-02-12 | 13F | Federated Hermes, Inc. | 0 | -100,00 | 0 | |||||
| 2026-02-17 | 13F | Royal Bank Of Canada | 1.328 | -48,69 | 14 | -63,16 | ||||
| 2026-02-10 | 13F | Bnp Paribas Arbitrage, Sa | 2.839 | 4,84 | 29 | -27,50 | ||||
| 2026-02-13 | 13F | State Street Corp | 190.206 | 28,17 | 1.953 | -12,07 | ||||
| 2025-12-02 | 13F | IFP Advisors, Inc | 0 | 0 | ||||||
| 2026-02-13 | 13F | Wexford Capital Lp | 0 | -100,00 | 0 | |||||
| 2026-02-17 | 13F | XTX Topco Ltd | 19.995 | 205 | ||||||
| 2026-02-17 | 13F | D. E. Shaw & Co., Inc. | 23.526 | 242 | ||||||
| 2026-02-05 | 13F | Amalgamated Bank | 395 | -6,84 | 0 | |||||
| 2025-11-19 | 13F | Caitong International Asset Management Co., Ltd | 0 | -100,00 | 0 | |||||
| 2026-01-29 | 13F | UBS Group AG | 147.868 | 17,22 | 1.519 | -19,60 | ||||
| 2026-02-17 | 13F | California State Teachers Retirement System | 774 | -0,26 | 8 | -36,36 | ||||
| 2026-04-20 | 13F | Kestra Private Wealth Services, Llc | 0 | -100,00 | 0 | |||||
| 2026-02-02 | 13F | Nkcfo Llc | 0 | -100,00 | 0 | |||||
| 2026-02-09 | 13F | Legal & General Group Plc | 1.130 | 0,00 | 12 | -31,25 | ||||
| 2026-02-12 | 13F | MetLife Investment Management, LLC | 0 | -100,00 | 0 | |||||
| 2025-11-14 | 13F | Graham Capital Management, L.P. | 0 | -100,00 | 0 | |||||
| 2026-02-17 | 13F | Jones Financial Companies Lllp | 49 | -50,51 | 1 | -100,00 | ||||
| 2026-01-29 | 13F | Vanguard Group Inc | 650.469 | -1,99 | 6.680 | -32,76 | ||||
| 2025-11-14 | 13F | FourWorld Capital Management LLC | 0 | -100,00 | 0 | -100,00 | ||||
| 2025-11-14 | 13F | Mount Yale Investment Advisors, LLC | 0 | -100,00 | 0 | |||||
| 2026-02-11 | 13F | Deutsche Bank Ag\ | 0 | -100,00 | 0 | |||||
| 2026-02-17 | 13F | Citadel Advisors Llc | 0 | -100,00 | 0 | |||||
| 2026-02-17 | 13F | Bridgeway Capital Management Inc | 65.600 | 320,51 | 674 | 188,84 | ||||
| 2026-02-11 | 13F | Simplex Trading, Llc | 5.928 | -49,69 | 61 | |||||
| 2026-02-17 | 13F | Caption Management, LLC | Put | 173.000 | 73,00 | 1.777 | 18,64 | |||
| 2026-02-17 | 13F | Caption Management, LLC | Call | 23.000 | 236 | |||||
| 2026-02-17 | 13F | Caption Management, LLC | 23.038 | 28,67 | 237 | -11,94 | ||||
| 2026-02-11 | 13F | Ameritas Investment Partners, Inc. | 1.268 | 13 | ||||||
| 2026-02-17 | 13F | Bank Of America Corp /de/ | 13.487 | -53,41 | 139 | -68,13 | ||||
| 2026-02-13 | 13F | Charles Schwab Investment Management Inc | 34.899 | 0,00 | 358 | -31,42 | ||||
| 2026-04-24 | 13F | UMA Financial Services, Inc. | 120 | 0,00 | 1 | 0,00 | ||||
| 2026-02-11 | 13F | Group One Trading, L.p. | 19.167 | 37,52 | 197 | -5,77 |
Other Listings
| US:INSG | 20,29 $ |