Grundlæggende statistik
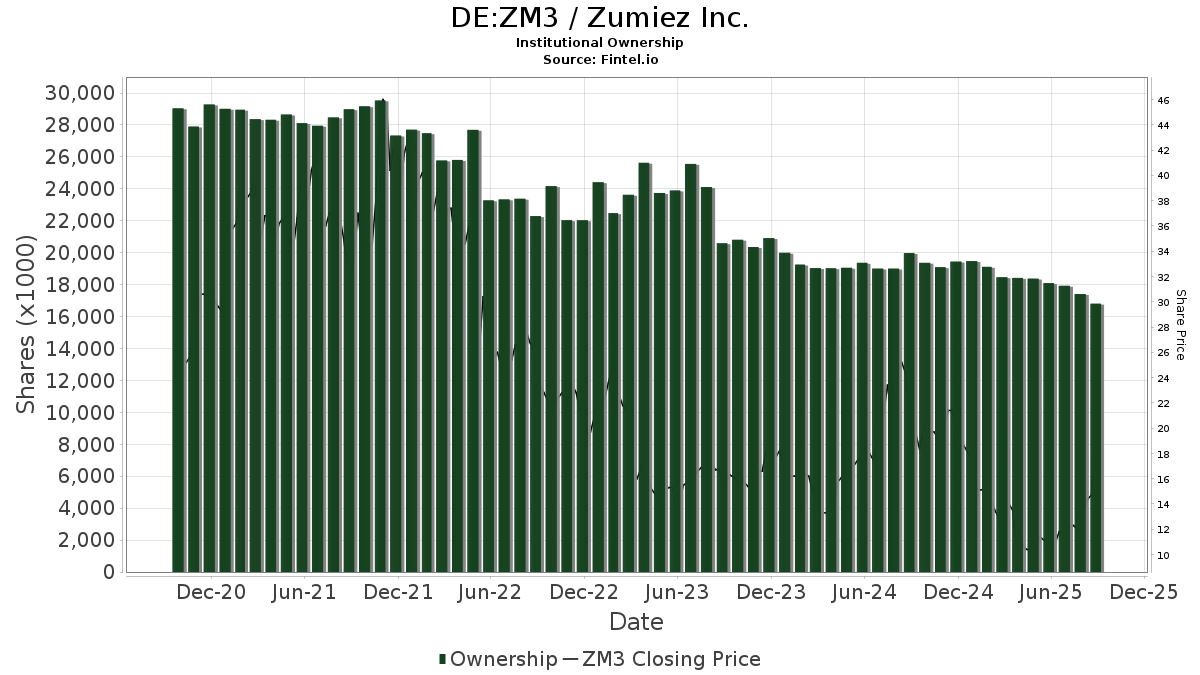
| Institutionelle aktier (lange) | 13.004.378 - 76,63% (ex 13D/G) - change of -2,69MM shares -17,18% MRQ |
| Institutionel værdi (lang) | $ 312.268 USD ($1000) |
Institutionelt ejerskab og aktionærer
Zumiez Inc. (DE:ZM3) har 141 institutionelle ejere og aktionærer, der har indsendt 13D/G- eller 13F-formularer til Securities Exchange Commission (SEC). Disse institutioner har i alt 13,004,378 aktier. Største aktionærer omfatter BlackRock, Inc., Vanguard Group Inc, Dimensional Fund Advisors Lp, Acadian Asset Management Llc, Goldman Sachs Group Inc, Charles Schwab Investment Management Inc, Paradigm Capital Management Inc/ny, Arrowstreet Capital, Limited Partnership, Towle & Co, and Jacobs Levy Equity Management, Inc .
Zumiez Inc. (DB:ZM3) institutionel ejerskabsstruktur viser aktuelle positioner i virksomheden efter institutioner og fonde, samt seneste ændringer i positionsstørrelse. Større aktionærer kan omfatte individuelle investorer, investeringsforeninger, hedgefonde eller institutioner. Skema 13D angiver, at investoren besidder (eller besidder) mere end 5 % af virksomheden og har til hensigt (eller har til hensigt at) aktivt at forfølge en ændring i forretningsstrategi. Skema 13G indikerer en passiv investering på over 5%.
The share price as of April 22, 2026 is 21,00 / share. Previously, on April 28, 2025, the share price was 10,70 / share. This represents an increase of 96,26% over that period.
Fondens stemningsscore
Fund Sentiment Score (fka Ownership Accumulation Score) finder de aktier, der bliver mest købt af fonde. Det er resultatet af en sofistikeret, multi-faktor kvantitativ model, der identificerer virksomheder med de højeste niveauer af institutionel akkumulering. Scoringsmodellen bruger en kombination af den samlede stigning i oplyste ejere, ændringerne i porteføljeallokeringer i disse ejere og andre målinger. Tallet går fra 0 til 100, hvor højere tal indikerer et højere niveau af akkumulering for sine jævnaldrende, og 50 er gennemsnittet.
Opdateringsfrekvens: Dagligt
Se Ownership Explorer, som giver en liste over højest rangerende virksomheder.
AI+ Ask Fintel’s AI assistant about Zumiez Inc..
Select a question to share a public post with an AI-crafted answer.
Thinking of good questions…
13F og NPORT arkivering
Detaljer om 13F-arkivering er gratis. Detaljer om NP-ansøgninger kræver et premium-medlemskab. Grønne rækker angiver nye positioner. Røde rækker angiver lukkede positioner. Klik på linket ikon for at se den fulde transaktionshistorik.
Opgrader
for at låse premium-data op og eksportere til Excel ![]() .
.
| Fil dato | Kilde | Investor | Type | Gennemsnitlig pris (Øst) |
Aktier | Δ Aktier (%) |
Rapporteret Værdi ($1000) |
Δ Værdi (%) |
Port Alloc (%) |
|
|---|---|---|---|---|---|---|---|---|---|---|
| 2026-02-13 | 13F | American Century Companies Inc | 126.911 | 124,51 | 3.306 | 198,38 | ||||
| 2026-02-13 | 13F | Verition Fund Management LLC | 38.303 | -0,83 | 998 | 31,70 | ||||
| 2026-02-17 | 13F | Zacks Investment Management | 7.809 | 203 | ||||||
| 2026-02-13 | 13F | Wells Fargo & Company/mn | 14.814 | 34,93 | 386 | 79,07 | ||||
| 2026-04-22 | 13F | Sterling Capital Management LLC | 433 | -43,18 | 10 | -52,63 | ||||
| 2026-02-17 | 13F | Lotus Technology Management, LP | 12.910 | 336 | ||||||
| 2026-02-12 | 13F | New York State Common Retirement Fund | 5.436 | 0,00 | 142 | 33,02 | ||||
| 2026-02-17 | 13F | Royal Bank Of Canada | 379 | -89,68 | 10 | -86,30 | ||||
| 2025-11-14 | 13F | Fund 1 Investments, LLC | 0 | -100,00 | 0 | -100,00 | ||||
| 2026-04-06 | 13F | Versant Capital Management, Inc | 16 | 0,00 | 0 | |||||
| 2026-02-12 | 13F | Hrt Financial Lp | 9.671 | -59,88 | 0 | |||||
| 2026-02-13 | 13F | Police & Firemen's Retirement System of New Jersey | 4.116 | 0,00 | 107 | 33,75 | ||||
| 2026-02-13 | 13F | Marshall Wace, Llp | 243.807 | 6.351 | ||||||
| 2026-02-19 | 13F | Invesco Ltd. | 57.663 | -14,38 | 1.502 | 13,79 | ||||
| 2026-01-26 | 13F | Cwm, Llc | 15.511 | 44,95 | 0 | |||||
| 2026-02-12 | 13F | Towle & Co | 394.558 | -4,35 | 10.278 | 27,06 | ||||
| 2026-02-17 | 13F | California State Teachers Retirement System | 813 | -31,74 | 21 | -8,70 | ||||
| 2026-02-13 | 13F | Prudential Financial Inc | 9.761 | 254 | ||||||
| 2026-02-17 | 13F | Alliancebernstein L.p. | 11.100 | -36,57 | 289 | -15,74 | ||||
| 2026-02-17 | 13F | Magnetar Financial LLC | 0 | -100,00 | 0 | |||||
| 2026-02-09 | 13F | Geode Capital Management, Llc | 325.375 | -7,14 | 8.478 | 23,35 | ||||
| 2026-02-09 | 13F | Legal & General Group Plc | 1.117 | -11,14 | 29 | 20,83 | ||||
| 2026-02-05 | 13F | Amalgamated Bank | 415 | -22,57 | 0 | |||||
| 2026-02-17 | 13F | Mangrove Partners | 10.082 | 263 | ||||||
| 2026-04-07 | 13F | Signaturefd, Llc | 112 | 2 | ||||||
| 2026-02-13 | 13F | Quarry LP | 662 | -75,87 | 17 | -67,92 | ||||
| 2026-02-12 | 13F | Integrated Quantitative Investments LLC | 10.299 | 268 | ||||||
| 2026-02-10 | 13F | Hillsdale Investment Management Inc. | 285.400 | 7.435 | ||||||
| 2026-02-13 | 13F | Arrowstreet Capital, Limited Partnership | 404.029 | 5,37 | 10.525 | 39,97 | ||||
| 2026-04-13 | 13F | IFP Advisors, Inc | 276 | 645,95 | 6 | |||||
| 2026-02-06 | 13F | Pnc Financial Services Group, Inc. | 497 | 0,00 | 13 | 33,33 | ||||
| 2026-02-17 | 13F | Balyasny Asset Management Llc | 0 | -100,00 | 0 | |||||
| 2026-02-13 | 13F | Landscape Capital Management, L.l.c. | 65.005 | -5,22 | 1.693 | 25,97 | ||||
| 2026-02-17 | 13F | Point72 Asset Management, L.P. | 56.788 | 1.479 | ||||||
| 2026-01-29 | 13F | Vanguard Group Inc | 1.025.982 | -1,67 | 26.727 | 30,63 | ||||
| 2026-02-17 | 13F | Aquatic Capital Management LLC | 0 | -100,00 | 0 | |||||
| 2026-02-10 | 13F | Acadian Asset Management Llc | 678.877 | 2,65 | 18 | 41,67 | ||||
| 2026-02-13 | 13F | Citigroup Inc | 1.565 | 34,10 | 41 | 81,82 | ||||
| 2026-02-10 | 13F | Goldman Sachs Group Inc | 645.849 | 6,42 | 16.824 | 41,37 | ||||
| 2026-02-17 | 13F | MIRAE ASSET GLOBAL ETFS HOLDINGS Ltd. | 6.163 | -7,38 | 161 | 23,08 | ||||
| 2026-02-10 | 13F | Bnp Paribas Arbitrage, Sa | 28.081 | 194,54 | 732 | 293,01 | ||||
| 2026-02-11 | 13F | Simplex Trading, Llc | Call | 100 | 3 | |||||
| 2026-04-24 | 13F | Strs Ohio | 26.200 | 30,35 | 581 | 10,90 | ||||
| 2026-02-11 | 13F | Simplex Trading, Llc | Put | 1.300 | -88,07 | 34 | ||||
| 2026-02-11 | 13F | Simplex Trading, Llc | 385 | 6.316,67 | 10 | |||||
| 2026-02-13 | 13F | Morgan Stanley | 157.072 | -39,67 | 4.092 | -19,86 | ||||
| 2026-02-17 | 13F | Monimus Capital Management, Lp | 18.842 | -77,50 | 491 | -70,16 | ||||
| 2026-02-17 | 13F | Northern Trust Corp | 119.340 | -11,58 | 3.109 | 17,46 | ||||
| 2026-02-17 | 13F | Price T Rowe Associates Inc /md/ | 8.462 | 0 | ||||||
| 2026-02-03 | 13F | SBI Securities Co., Ltd. | 1 | 0 | ||||||
| 2026-02-12 | 13F | BlackRock, Inc. | 1.917.634 | -4,89 | 49.954 | 26,34 | ||||
| 2026-02-12 | 13F | Commonwealth Equity Services, Llc | 15.855 | 413 | ||||||
| 2025-11-12 | 13F | Group One Trading, L.p. | Call | 0 | -100,00 | 0 | -100,00 | |||
| 2026-02-17 | 13F | D. E. Shaw & Co., Inc. | 97.737 | 3,16 | 2.546 | 37,10 | ||||
| 2026-02-17 | 13F | Susquehanna International Group, Llp | Call | 11.700 | 6,36 | 305 | 41,40 | |||
| 2026-02-17 | 13F | Public Employees Retirement System Of Ohio | 33.649 | -2,26 | 877 | 29,78 | ||||
| 2026-02-17 | 13F | Qube Research & Technologies Ltd | 103.109 | 647,60 | 2.686 | 894,44 | ||||
| 2026-02-13 | 13F | Squarepoint Ops LLC | 80.312 | 2.092 | ||||||
| 2026-02-17 | 13F | Ameriprise Financial Inc | 366.963 | -30,01 | 9.559 | -7,02 | ||||
| 2025-11-13 | 13F | Renaissance Technologies Llc | 0 | -100,00 | 0 | |||||
| 2026-02-12 | 13F | CIBC Private Wealth Group, LLC | 0 | -100,00 | 0 | |||||
| 2026-04-21 | 13F | PharVision Advisers, LLC | 0 | -100,00 | 0 | |||||
| 2026-02-11 | 13F | Allianz Asset Management GmbH | 20.115 | 524 | ||||||
| 2026-02-10 | 13F | State of Wyoming | 6.481 | 169 | ||||||
| 2025-11-13 | 13F | Baird Financial Group, Inc. | 0 | -100,00 | 0 | |||||
| 2026-02-13 | 13F | Rhumbline Advisers | 19.023 | -19,96 | 496 | 6,22 | ||||
| 2026-02-17 | 13F | Russell Investments Group, Ltd. | 22.495 | 1,79 | 587 | 35,57 | ||||
| 2026-02-11 | 13F | Group One Trading, L.p. | Put | 0 | -100,00 | 0 | ||||
| 2026-02-13 | 13F | Natixis | 37.600 | 979 | ||||||
| 2026-02-17 | 13F | Mercer Global Advisors Inc /adv | 11.312 | 3,61 | 295 | 37,38 | ||||
| 2026-02-17 | 13F | Millennium Management Llc | 39.809 | -78,79 | 1.037 | -71,82 | ||||
| 2026-02-17 | 13F | Bridgeway Capital Management Inc | 218.322 | -2,34 | 5.687 | 29,75 | ||||
| 2026-02-12 | 13F | Quadrant Capital Group Llc | 241 | 6 | ||||||
| 2026-02-12 | 13F | Paradigm Capital Management Inc/ny | 478.200 | -17,30 | 12.457 | 9,87 | ||||
| 2026-02-17 | 13F | Tower Research Capital LLC (TRC) | 1.754 | 193,31 | 46 | 309,09 | ||||
| 2025-11-14 | 13F | CI Private Wealth, LLC | 0 | -100,00 | 0 | |||||
| 2026-02-05 | 13F | Allworth Financial LP | 330 | 159,84 | 9 | 300,00 | ||||
| 2026-02-17 | 13F | Man Group plc | 0 | -100,00 | 0 | |||||
| 2026-02-17 | 13F | XTX Topco Ltd | 0 | -100,00 | 0 | |||||
| 2025-11-13 | 13F | Panagora Asset Management Inc | 0 | -100,00 | 0 | |||||
| 2026-02-12 | 13F | EAM Investors, LLC | 41.866 | 1.091 | ||||||
| 2026-02-13 | 13F | Victory Capital Management Inc | 38.000 | -3,31 | 990 | 28,44 | ||||
| 2026-02-17 | 13F | Occudo Quantitative Strategies Lp | 8.822 | 230 | ||||||
| 2026-02-13 | 13F | Jacobs Levy Equity Management, Inc | 377.220 | -5,66 | 9.827 | 25,32 | ||||
| 2026-04-16 | 13F | SG Americas Securities, LLC | 0 | -100,00 | 0 | |||||
| 2026-02-17 | 13F | Algert Global Llc | 0 | -100,00 | 0 | |||||
| 2026-01-29 | 13F | IMC-Chicago, LLC | Call | 11.400 | -6,56 | 297 | 23,85 | |||
| 2026-01-30 | 13F | Us Bancorp \de\ | 21 | 1 | ||||||
| 2026-02-13 | 13F | Public Employees Retirement Association Of Colorado | 2.838 | 0,00 | 0 | |||||
| 2026-02-17 | 13F | Fmr Llc | 1.891 | 133,17 | 49 | 226,67 | ||||
| 2026-02-10 | 13F | Tieton Capital Management, LLC | 254.513 | -0,94 | 7 | 20,00 | ||||
| 2026-03-06 | 13F | Hsbc Holdings Plc | 26.454 | -18,35 | 696 | 9,28 | ||||
| 2026-02-13 | 13F | Mariner, LLC | 11.004 | 287 | ||||||
| 2026-04-23 | 13F | SJS Investment Consulting Inc. | 37 | 236,36 | 1 | |||||
| 2026-02-17 | 13F | Aqr Capital Management Llc | 240.029 | 31,89 | 6.253 | 75,22 | ||||
| 2026-02-13 | 13F | SRS Capital Advisors, Inc. | 15 | -99,59 | 0 | -100,00 | ||||
| 2026-02-17 | 13F | State Of Wisconsin Investment Board | 57.893 | 3,21 | 1.508 | 37,22 | ||||
| 2026-02-11 | 13F | Empowered Funds, LLC | 161.487 | -1,17 | 4.207 | 31,27 | ||||
| 2026-02-18 | 13F | Mackenzie Financial Corp | 69.666 | 83,76 | 1.862 | 150,47 | ||||
| 2026-02-17 | 13F | Optiver Holding B.V. | 48 | -82,09 | 1 | -80,00 | ||||
| 2026-02-13 | 13F | Walleye Trading LLC | Call | 0 | -100,00 | 0 | -100,00 | |||
| 2026-01-29 | 13F | Cornerstone Investment Partners, LLC | 7.796 | 203 | ||||||
| 2026-02-13 | 13F | Walleye Trading LLC | Put | 0 | -100,00 | 0 | -100,00 | |||
| 2026-02-04 | 13F | Bailard, Inc. | 8.257 | 215 | ||||||
| 2026-02-10 | 13F | Bank of New York Mellon Corp | 52.344 | 0,77 | 1.364 | 33,89 | ||||
| 2026-02-17 | 13F | Advisor Group Holdings, Inc. | 100 | 0,00 | 3 | 100,00 | ||||
| 2026-02-12 | 13F | Federated Hermes, Inc. | 82 | 2 | ||||||
| 2026-01-27 | 13F | Financial Management Professionals, Inc. | 0 | -100,00 | 0 | |||||
| 2026-04-08 | 13F | Wealth Enhancement Advisory Services, Llc | 9.768 | 211 | ||||||
| 2026-02-11 | 13F | Jpmorgan Chase & Co | 6.787 | -4,39 | 177 | 26,62 | ||||
| 2025-11-14 | 13F | Walleye Capital LLC | 0 | -100,00 | 0 | -100,00 | ||||
| 2026-04-07 | 13F | Farther Finance Advisors, LLC | 165 | 33,06 | 4 | 0,00 | ||||
| 2026-04-13 | 13F | True Wealth Design, LLC | 50 | 8,70 | 1 | 0,00 | ||||
| 2025-11-12 | 13F | Quantbot Technologies LP | 0 | -100,00 | 0 | |||||
| 2026-02-09 | 13F | Quest Partners LLC | 14.402 | 375,94 | 375 | 535,59 | ||||
| 2026-02-11 | 13F | Cerity Partners LLC | 26.656 | 694 | ||||||
| 2025-11-14 | 13F | Skopos Labs, Inc. | 0 | -100,00 | 0 | |||||
| 2026-04-27 | 13F | Y-Intercept (Hong Kong) Ltd | 18.528 | 411 | ||||||
| 2026-02-13 | 13F | Walleye Capital LLC | Put | 0 | -100,00 | 0 | -100,00 | |||
| 2026-02-06 | 13F | EverSource Wealth Advisors, LLC | 531 | 31,76 | 14 | 85,71 | ||||
| 2026-01-29 | 13F | UBS Group AG | 33.406 | -63,38 | 870 | -51,34 | ||||
| 2026-02-02 | 13F | Mutual Advisors, LLC | 47.304 | 0,00 | 1.232 | 18,12 | ||||
| 2026-02-17 | 13F | Engineers Gate Manager LP | 11.706 | 305 | ||||||
| 2026-02-17 | 13F | Divisar Capital Management LLC | 259.102 | -62,76 | 6.750 | -50,53 | ||||
| 2026-02-17 | 13F | Numerai GP LLC | 11.016 | -54,69 | 287 | -39,92 | ||||
| 2026-02-12 | 13F | Nuveen, LLC | 41.730 | -4,70 | 1.087 | 26,69 | ||||
| 2026-02-13 | 13F | Dynamic Technology Lab Private Ltd | 11.693 | -69,23 | 305 | -59,06 | ||||
| 2025-11-14 | 13F | Maverick Capital Ltd | 0 | -100,00 | 0 | |||||
| 2026-02-13 | 13F | State Street Corp | 326.928 | -9,28 | 8.516 | 20,52 | ||||
| 2025-11-14 | 13F | Susquehanna International Group, Llp | 0 | -100,00 | 0 | -100,00 | ||||
| 2026-02-18 | 13F/A | Fuller & Thaler Asset Management, Inc. | 9.933 | 259 | ||||||
| 2026-02-13 | 13F | Sei Investments Co | 160.772 | 1.008,01 | 4.188 | 1.406,47 | ||||
| 2026-04-15 | 13F | Fortitude Family Office, LLC | 116 | 0,00 | 3 | -33,33 | ||||
| 2026-02-13 | 13F | Charles Schwab Investment Management Inc | 516.049 | 15,32 | 13.443 | 53,20 | ||||
| 2026-03-04 | 13F | SHP Wealth Management | 2 | 0 | ||||||
| 2026-02-12 | 13F | MetLife Investment Management, LLC | 8.281 | -3,23 | 216 | 28,74 | ||||
| 2026-02-09 | 13F | Hartland & Co., LLC | 2 | -96,15 | 0 | -100,00 | ||||
| 2026-02-17 | 13F | Quantinno Capital Management LP | 14.449 | 376 | ||||||
| 2026-02-20 | 13F | Sunbelt Securities, Inc. | 6 | 0,00 | 0 | |||||
| 2026-02-13 | 13F | Barclays Plc | 51.636 | 3,53 | 1.345 | 37,53 | ||||
| 2026-02-17 | 13F | Trexquant Investment LP | 198.142 | 47,38 | 5.162 | 95,79 | ||||
| 2026-02-13 | 13F | Ieq Capital, Llc | 22.142 | 71,79 | 577 | 128,57 | ||||
| 2026-02-17 | 13F | Tudor Investment Corp Et Al | 75.313 | 1.962 | ||||||
| 2026-02-10 | 13F | Rothschild Investment Llc | 141 | 116,92 | 4 | 200,00 | ||||
| 2026-04-24 | 13F | Root Financial Partners, LLC | 136 | 3 | ||||||
| 2026-04-06 | 13F | GAMMA Investing LLC | 173 | -6,99 | 4 | -25,00 | ||||
| 2026-02-11 | 13F | Los Angeles Capital Management Llc | 27.340 | 0,00 | 604 | 12,50 | ||||
| 2026-02-13 | 13F | Walleye Capital LLC | Call | 0 | -100,00 | 0 | -100,00 | |||
| 2026-02-17 | 13F | Citadel Advisors Llc | 37.244 | 970 | ||||||
| 2026-02-23 | 13F | Virtu Financial LLC | 10.469 | 0 | ||||||
| 2026-02-17 | 13F | Citadel Advisors Llc | Call | 8.800 | 229 | |||||
| 2026-02-04 | 13F | Pacific Ridge Capital Partners, LLC | 22.237 | 4,81 | 579 | 39,18 | ||||
| 2026-02-06 | 13F | Gsa Capital Partners Llp | 24.596 | -70,02 | 1 | -100,00 | ||||
| 2026-02-13 | 13F | Kilter Group LLC | 29 | -39,58 | 1 | |||||
| 2026-02-17 | 13F | Creative Planning | 27.232 | 709 | ||||||
| 2026-02-17 | 13F | Oxford Asset Management Llp | 16.764 | 437 | ||||||
| 2026-02-13 | 13F | Kestra Advisory Services, LLC | 1.025 | 27 | ||||||
| 2026-02-11 | 13F | Franklin Resources Inc | 9.189 | 239 | ||||||
| 2026-02-14 | 13F | Rockefeller Capital Management L.P. | 58 | 2 | ||||||
| 2026-02-17 | 13F | Bank Of America Corp /de/ | 16.209 | -3,36 | 422 | 28,66 | ||||
| 2025-11-14 | 13F | Walleye Trading LLC | 0 | -100,00 | 0 | -100,00 | ||||
| 2026-02-12 | 13F | Jane Street Group, Llc | 76.137 | 58,01 | 1.983 | 110,06 | ||||
| 2026-02-11 | 13F | Deutsche Bank Ag\ | 7.065 | -54,86 | 184 | -39,87 | ||||
| 2026-02-13 | 13F | Divisadero Street Capital Management, LP | 124.549 | 3.245 | ||||||
| 2026-02-17 | 13F | Two Sigma Advisers, Lp | 14.800 | 24,37 | 386 | 65,24 | ||||
| 2026-01-23 | 13F | Assetmark, Inc | 15 | 0,00 | 0 | |||||
| 2026-02-12 | 13F | Dimensional Fund Advisors Lp | 1.011.866 | -4,66 | 26.361 | 26,66 | ||||
| 2026-02-17 | 13F | Watershed Asset Management, L.L.C. | 18.717 | 488 | ||||||
| 2026-02-11 | 13F | Ameritas Investment Partners, Inc. | 1.196 | 31 | ||||||
| 2026-02-13 | 13F | MAI Capital Management | 9 | 0 | ||||||
| 2026-01-15 | 13F | Nisa Investment Advisors, Llc | 18.356 | 0,00 | 478 | 33,15 |
Other Listings
| US:ZUMZ | 24,56 $ |