Grundlæggende statistik
| Institutionelle aktier (lange) | 67.470.878 - 78,16% (ex 13D/G) - change of -21,18MM shares -23,89% MRQ |
| Institutionel værdi (lang) | $ 1.198.104 USD ($1000) |
Institutionelt ejerskab og aktionærer
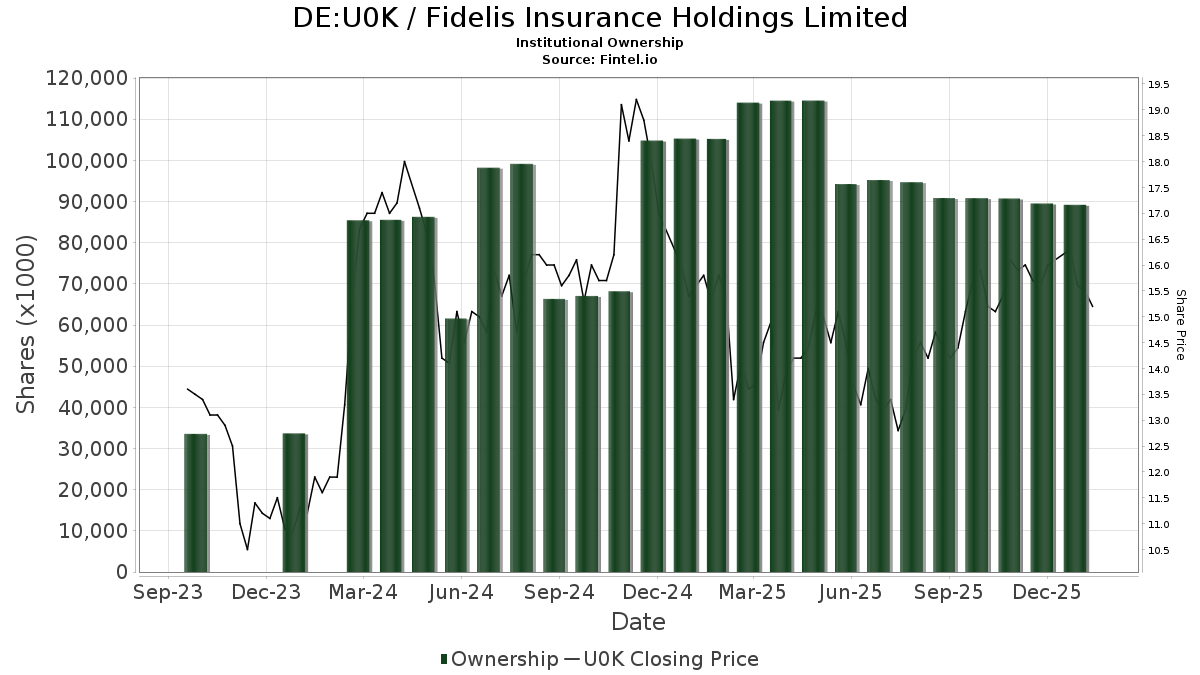
Fidelis Insurance Holdings Limited (DE:U0K) har 153 institutionelle ejere og aktionærer, der har indsendt 13D/G- eller 13F-formularer til Securities Exchange Commission (SEC). Disse institutioner har i alt 67,470,878 aktier. Største aktionærer omfatter CVC Management Holdings II Ltd., Pine Brook Road Advisors, L.P., Travelers Companies, Inc., Cooperman Leon G, Crestview Partners IV GP, L.P., Lsv Asset Management, BlackRock, Inc., Dimensional Fund Advisors Lp, American Century Companies Inc, and Loomis Sayles & Co L P .
Fidelis Insurance Holdings Limited (DB:U0K) institutionel ejerskabsstruktur viser aktuelle positioner i virksomheden efter institutioner og fonde, samt seneste ændringer i positionsstørrelse. Større aktionærer kan omfatte individuelle investorer, investeringsforeninger, hedgefonde eller institutioner. Skema 13D angiver, at investoren besidder (eller besidder) mere end 5 % af virksomheden og har til hensigt (eller har til hensigt at) aktivt at forfølge en ændring i forretningsstrategi. Skema 13G indikerer en passiv investering på over 5%.
The share price as of April 29, 2026 is 17,70 / share. Previously, on May 2, 2025, the share price was 14,00 / share. This represents an increase of 26,43% over that period.
Fondens stemningsscore
Fund Sentiment Score (fka Ownership Accumulation Score) finder de aktier, der bliver mest købt af fonde. Det er resultatet af en sofistikeret, multi-faktor kvantitativ model, der identificerer virksomheder med de højeste niveauer af institutionel akkumulering. Scoringsmodellen bruger en kombination af den samlede stigning i oplyste ejere, ændringerne i porteføljeallokeringer i disse ejere og andre målinger. Tallet går fra 0 til 100, hvor højere tal indikerer et højere niveau af akkumulering for sine jævnaldrende, og 50 er gennemsnittet.
Opdateringsfrekvens: Dagligt
Se Ownership Explorer, som giver en liste over højest rangerende virksomheder.
AI+ Ask Fintel’s AI assistant about Fidelis Insurance Holdings Limited.
Select a question to share a public post with an AI-crafted answer.
Thinking of good questions…
13F og NPORT arkivering
Detaljer om 13F-arkivering er gratis. Detaljer om NP-ansøgninger kræver et premium-medlemskab. Grønne rækker angiver nye positioner. Røde rækker angiver lukkede positioner. Klik på linket ikon for at se den fulde transaktionshistorik.
Opgrader
for at låse premium-data op og eksportere til Excel ![]() .
.
| Fil dato | Kilde | Investor | Type | Gennemsnitlig pris (Øst) |
Aktier | Δ Aktier (%) |
Rapporteret Værdi ($1000) |
Δ Værdi (%) |
Port Alloc (%) |
|
|---|---|---|---|---|---|---|---|---|---|---|
| 2026-02-12 | 13F | Voya Investment Management Llc | 10.730 | -3,12 | 210 | 3,98 | ||||
| 2026-02-17 | 13F | Price T Rowe Associates Inc /md/ | 33.490 | 7,70 | 1 | |||||
| 2026-02-17 | 13F | Susquehanna Portfolio Strategies, LLC | 11.413 | 0,00 | 223 | 7,73 | ||||
| 2026-02-13 | 13F | First Trust Advisors Lp | 0 | -100,00 | 0 | |||||
| 2026-02-09 | 13F | Knights of Columbus Asset Advisors LLC | 73.602 | -2,48 | 1.440 | 5,19 | ||||
| 2026-03-09 | 13F | EMC Capital Management | 6.721 | -15,00 | 0 | |||||
| 2026-04-30 | 13F | Nisa Investment Advisors, Llc | 489 | 1,88 | 9 | 0,00 | ||||
| 2026-02-13 | 13F | Boston Partners | 0 | -100,00 | 0 | |||||
| 2026-02-17 | 13F | Man Group plc | 160.037 | -21,99 | 3.132 | -15,90 | ||||
| 2025-11-14 | 13F | Zimmer Partners, LP | 0 | -100,00 | 0 | |||||
| 2026-02-17 | 13F | Dark Forest Capital Management Lp | 0 | -100,00 | 0 | |||||
| 2026-02-17 | 13F | Point72 Asset Management, L.P. | 206.055 | 4.032 | ||||||
| 2026-02-17 | 13F | Quantinno Capital Management LP | 16.962 | 47,80 | 332 | 59,13 | ||||
| 2026-02-06 | 13F | Larson Financial Group LLC | 1.472 | 15,00 | 29 | 21,74 | ||||
| 2026-02-09 | 13F | Royce & Associates Lp | 1.187.213 | -25,39 | 23.234 | -19,56 | ||||
| 2026-02-17 | 13F | Schonfeld Strategic Advisors LLC | 38.285 | 749 | ||||||
| 2026-01-30 | 13F | Citizens Financial Group Inc/ri | 40.070 | -0,35 | 784 | 7,54 | ||||
| 2026-02-18 | 13F | Mackenzie Financial Corp | 0 | -100,00 | 0 | |||||
| 2026-02-13 | 13F | Squarepoint Ops LLC | 0 | -100,00 | 0 | |||||
| 2026-02-10 | 13F | State of Wyoming | 10.938 | 214 | ||||||
| 2026-02-11 | 13F | Ameritas Investment Partners, Inc. | 4.865 | 95 | ||||||
| 2026-02-17 | 13F | Aqr Capital Management Llc | 433.187 | 46,36 | 8.477 | 57,83 | ||||
| 2026-02-17 | 13F | MIRAE ASSET GLOBAL ETFS HOLDINGS Ltd. | 25.953 | -4,07 | 508 | 3,26 | ||||
| 2026-04-16 | 13F | Diversified Trust Co | 138.900 | 0,00 | 2.654 | -2,35 | ||||
| 2026-02-10 | 13F | Rothschild Investment Llc | 494 | 23,50 | 10 | 28,57 | ||||
| 2026-02-17 | 13F | Balyasny Asset Management Llc | 960.826 | 0,02 | 18.803 | 7,84 | ||||
| 2026-02-17 | 13F | Burkehill Global Management, LP | 150.000 | 2.936 | ||||||
| 2025-11-04 | 13F | UMA Financial Services, Inc. | 0 | -100,00 | 0 | |||||
| 2026-02-12 | 13F | New York State Common Retirement Fund | 15.311 | 0,00 | 300 | 7,94 | ||||
| 2026-02-17 | 13F | Quadrature Capital Ltd | 30.239 | 592 | ||||||
| 2026-04-23 | 13F | Pine Brook Road Advisors, L.P. | 7.209.921 | 0,00 | 137.782 | -2,35 | ||||
| 2026-02-13 | 13F | Quinn Opportunity Partners LLC | 10.000 | 0,00 | 196 | 7,73 | ||||
| 2026-04-22 | 13F | Red Door Wealth Management, LLC | 17.000 | 0,00 | 325 | -2,41 | ||||
| 2026-04-07 | 13F | Signaturefd, Llc | 950 | -5,85 | 18 | -5,26 | ||||
| 2025-11-13 | 13F | Sei Investments Co | 0 | -100,00 | 0 | -100,00 | ||||
| 2026-02-13 | 13F | Charles Schwab Investment Management Inc | 217.152 | -7,89 | 4.250 | -0,70 | ||||
| 2026-02-17 | 13F | Raymond James Financial Inc | 261.260 | -4,02 | 5.113 | 3,48 | ||||
| 2026-02-09 | 13F | Legal & General Group Plc | 9.157 | -2,25 | 179 | 5,29 | ||||
| 2026-02-13 | 13F | Marshall Wace, Llp | 0 | -100,00 | 0 | |||||
| 2026-02-13 | 13F | Crestview Partners IV GP, L.P. | 4.511.799 | 0,00 | 88.296 | 7,82 | ||||
| 2026-04-27 | 13F | Counterpoint Mutual Funds LLC | 16.885 | 323 | ||||||
| 2026-02-13 | 13F | Rhumbline Advisers | 70.851 | -16,46 | 1.387 | -9,94 | ||||
| 2026-01-30 | 13F | Harbor Advisors LLC | 0 | -100,00 | 0 | -100,00 | ||||
| 2026-02-14 | 13F | Rockefeller Capital Management L.P. | 1.184 | -20,43 | 23 | -14,81 | ||||
| 2026-02-17 | 13F | Citadel Advisors Llc | 258.785 | 5.064 | ||||||
| 2026-02-06 | 13F | Global Retirement Partners, LLC | 20 | -13,04 | 0 | |||||
| 2026-02-13 | 13F | Healthcare Of Ontario Pension Plan Trust Fund | 0 | -100,00 | 0 | |||||
| 2026-02-10 | 13F | Goldman Sachs Group Inc | 729.818 | 108,84 | 14.283 | 125,20 | ||||
| 2026-02-11 | 13F | Deutsche Bank Ag\ | 43.777 | -71,47 | 857 | -69,25 | ||||
| 2026-04-27 | 13F | Y-Intercept (Hong Kong) Ltd | 0 | -100,00 | 0 | |||||
| 2026-02-11 | 13F | Los Angeles Capital Management Llc | 424 | 8 | ||||||
| 2026-02-17 | 13F | Two Sigma Investments, Lp | 56.536 | -22,53 | 1.106 | -16,47 | ||||
| 2026-02-13 | 13F | Ieq Capital, Llc | 100.766 | 31,14 | 1.972 | 41,39 | ||||
| 2026-04-13 | 13F | True Wealth Design, LLC | 46 | -19,30 | 1 | -100,00 | ||||
| 2026-02-12 | 13F | Callan Family Office, LLC | 20.035 | 0,00 | 392 | 7,99 | ||||
| 2026-02-13 | 13F | Ubs Asset Management Americas Inc | 212 | 4 | ||||||
| 2026-02-13 | 13F | SRS Capital Advisors, Inc. | 4 | -99,96 | 0 | -100,00 | ||||
| 2026-02-17 | 13F | Creative Planning | 207.078 | 20,92 | 4.053 | 30,37 | ||||
| 2026-04-07 | 13F | Farther Finance Advisors, LLC | 1.381 | -5,54 | 26 | -7,14 | ||||
| 2026-02-13 | 13F | Panagora Asset Management Inc | 0 | -100,00 | 0 | |||||
| 2026-02-17 | 13F | Jain Global LLC | 23.813 | 466 | ||||||
| 2026-02-17 | 13F | Millennium Management Llc | 606.158 | -34,43 | 11.863 | -29,30 | ||||
| 2026-02-10 | 13F | Bnp Paribas Arbitrage, Sa | 19.875 | 71,11 | 389 | 84,76 | ||||
| 2026-04-24 | 13F | Kendall Capital Management | 83.295 | 6,54 | 1.592 | 3,99 | ||||
| 2025-11-14 | 13F | Capstone Investment Advisors, Llc | 16.201 | 294 | ||||||
| 2026-04-22 | 13F | Joel Isaacson & Co., LLC | 19.462 | 0,00 | 372 | -2,37 | ||||
| 2026-04-29 | 13F | Hughes Financial Services, LLC | 2 | 0 | ||||||
| 2026-02-17 | 13F | Fmr Llc | 2.555 | 0,75 | 50 | 8,70 | ||||
| 2026-02-13 | 13F | Martingale Asset Management L P | 0 | -100,00 | 0 | |||||
| 2025-11-12 | 13F | Corient IA LLC | 0 | -100,00 | 0 | |||||
| 2026-01-30 | 13F | BancorpSouth Bank | 11.562 | 0,00 | 226 | 8,13 | ||||
| 2026-02-10 | 13F | Quantbot Technologies LP | 79.695 | 1.560 | ||||||
| 2026-04-24 | 13F | ProShare Advisors LLC | 0 | -100,00 | 0 | |||||
| 2026-02-10 | 13F | Intech Investment Management Llc | 22.021 | -0,54 | 431 | 7,23 | ||||
| 2026-02-13 | 13F | Manufacturers Life Insurance Company, The | 0 | -100,00 | 0 | -100,00 | ||||
| 2026-02-13 | 13F | Crestview Partners III GP, L.P. | 0 | -100,00 | 0 | |||||
| 2025-11-14 | 13F | New Vernon Investment Management Llc | 0 | -100,00 | 0 | |||||
| 2026-02-13 | 13F | MAI Capital Management | 187 | -6,50 | 4 | 0,00 | ||||
| 2026-04-29 | 13F | Police & Firemen's Retirement System of New Jersey | 14.529 | 0,00 | 278 | -2,46 | ||||
| 2026-02-12 | 13F | Quadrant Capital Group Llc | 13.120 | 23,51 | 257 | 33,33 | ||||
| 2026-01-29 | 13F | Vanguard Group Inc | 519.291 | 4,81 | 10.163 | 13,01 | ||||
| 2026-02-17 | 13F | Jones Financial Companies Lllp | 14.351 | -18,30 | 281 | -8,79 | ||||
| 2026-02-12 | 13F | Loomis Sayles & Co L P | 1.288.824 | 2,71 | 25.222 | 10,75 | ||||
| 2026-02-17 | 13F | Aster Capital Management (DIFC) Ltd | 0 | -100,00 | 0 | |||||
| 2026-02-13 | 13F | Jacobs Levy Equity Management, Inc | 638.442 | 36,94 | 12.494 | 47,65 | ||||
| 2026-02-17 | 13F | Ameriprise Financial Inc | 185.833 | 0,09 | 3.637 | 7,93 | ||||
| 2026-02-12 | 13F | MetLife Investment Management, LLC | 32.777 | -9,31 | 641 | -2,14 | ||||
| 2025-11-14 | 13F | Two Sigma Advisers, Lp | 0 | -100,00 | 0 | -100,00 | ||||
| 2026-01-12 | 13F | AllSquare Wealth Management LLC | 900 | 0,00 | 16 | 14,29 | ||||
| 2026-02-10 | 13F | Travelers Companies, Inc. | 7.202.354 | 0,00 | 140.950 | 7,82 | ||||
| 2026-04-13 | 13F | Massmutual Trust Co Fsb/adv | 70 | 0,00 | 1 | 0,00 | ||||
| 2026-04-28 | 13F | Stephens Inc /ar/ | 267.329 | 12,70 | 5.109 | 10,04 | ||||
| 2026-02-17 | 13F | California State Teachers Retirement System | 3.445 | -8,04 | 67 | 0,00 | ||||
| 2026-02-17 | 13F | Public Employees Retirement System Of Ohio | 75.075 | 0,44 | 1.469 | 8,33 | ||||
| 2026-02-11 | 13F | Franklin Resources Inc | 95.806 | 0,55 | 1.875 | 8,39 | ||||
| 2025-11-21 | 13F | Nebula Research & Development LLC | 0 | -100,00 | 0 | |||||
| 2026-02-09 | 13F | Optimize Financial Inc | 26.292 | 1,45 | 515 | 9,36 | ||||
| 2026-02-17 | 13F | Northern Trust Corp | 306.808 | -15,72 | 6.004 | -9,11 | ||||
| 2026-02-17 | 13F | Polymer Capital Management (US) LLC | 19.797 | 38,32 | 387 | 49,42 | ||||
| 2026-02-17 | 13F | Bank Of America Corp /de/ | 118.290 | -8,63 | 2.315 | -1,49 | ||||
| 2026-02-06 | 13F | Pnc Financial Services Group, Inc. | 5 | 0 | ||||||
| 2026-02-12 | 13F | BlackRock, Inc. | 3.394.669 | -0,66 | 66.434 | 7,12 | ||||
| 2026-02-11 | 13F | LPL Financial LLC | 24.495 | -17,06 | 479 | -10,63 | ||||
| 2026-02-13 | 13F | C M Bidwell & Associates Ltd | 0 | -100,00 | 0 | |||||
| 2026-02-17 | 13F | Lighthouse Investment Partners, LLC | 43.637 | -53,84 | 854 | -50,26 | ||||
| 2026-02-05 | 13F | Allworth Financial LP | 1.028 | 47,91 | 20 | 66,67 | ||||
| 2025-11-14 | 13F | Ghisallo Capital Management LLC | 0 | -100,00 | 0 | |||||
| 2026-02-17 | 13F | Susquehanna Fundamental Investments, Llc | 59.699 | 1.168 | ||||||
| 2025-11-14 | 13F | Lazard Asset Management Llc | 0 | -100,00 | 0 | -100,00 | ||||
| 2026-02-10 | 13F | Envestnet Asset Management Inc | 0 | -100,00 | 0 | |||||
| 2026-02-05 | 13F | Amalgamated Bank | 1.758 | -1,18 | 0 | |||||
| 2026-04-22 | 13F | Sterling Capital Management LLC | 1.822 | -43,49 | 35 | -46,03 | ||||
| 2026-02-17 | 13F | Clough Capital Partners L P | 0 | -100,00 | 0 | |||||
| 2026-02-17 | 13F | XTX Topco Ltd | 129.220 | 2.529 | ||||||
| 2026-02-17 | 13F | Optiver Holding B.V. | 514 | 1,98 | 10 | 11,11 | ||||
| 2026-02-11 | 13F | Jpmorgan Chase & Co | 623.116 | 26,10 | 12.194 | 35,97 | ||||
| 2025-11-14 | 13F | Susquehanna International Group, Llp | 0 | -100,00 | 0 | -100,00 | ||||
| 2025-11-10 | 13F | Empirical Financial Services, LLC d.b.a. Empirical Wealth Management | 0 | -100,00 | 0 | |||||
| 2026-02-13 | 13F | American Century Companies Inc | 1.409.833 | -36,55 | 27.590 | -31,59 | ||||
| 2026-02-17 | 13F | Mercer Global Advisors Inc /adv | 11.015 | 216 | ||||||
| 2026-02-17 | 13F | ExodusPoint Capital Management, LP | 0 | -100,00 | 0 | -100,00 | ||||
| 2026-02-11 | 13F | Cerity Partners LLC | 149.488 | 2.925 | ||||||
| 2026-02-09 | 13F | Hartland & Co., LLC | 2 | -98,44 | 0 | -100,00 | ||||
| 2026-02-13 | 13F | Smartleaf Asset Management LLC | 100 | 2 | ||||||
| 2026-02-11 | 13F | Fox Run Management, L.l.c. | 45.059 | 882 | ||||||
| 2026-02-06 | 13F | Covestor Ltd | 8 | 0,00 | 0 | |||||
| 2026-02-13 | 13F | Mariner, LLC | 24.585 | 78,00 | 481 | 92,40 | ||||
| 2026-01-27 | 13F | WealthCollab, LLC | 627 | 0,00 | 12 | 9,09 | ||||
| 2026-02-13 | 13F | Morgan Stanley | 516.260 | -34,94 | 10.103 | -29,85 | ||||
| 2026-02-13 | 13F | Entropy Technologies, LP | 15.012 | 294 | ||||||
| 2026-02-17 | 13F | State Of Wisconsin Investment Board | 74.674 | -0,13 | 1.461 | 7,66 | ||||
| 2026-02-13 | 13F | Wells Fargo & Company/mn | 63.164 | 41,46 | 1.236 | 52,59 | ||||
| 2026-02-17 | 13F | Advisory Services Network, LLC | 15.215 | -48,89 | 298 | -45,00 | ||||
| 2026-02-13 | 13F | Barclays Plc | 144.889 | 4,47 | 2.835 | 12,63 | ||||
| 2026-02-17 | 13F | Adage Capital Partners Gp, L.l.c. | 0 | -100,00 | 0 | |||||
| 2026-04-07 | 13F | Eastern Bank | 421 | 0,00 | 8 | 0,00 | ||||
| 2026-02-17 | 13F | Wellington Management Group Llp | 1.041.811 | -13,03 | 20.388 | -6,23 | ||||
| 2026-02-17 | 13F | Jump Financial, LLC | 47.343 | 927 | ||||||
| 2026-01-28 | 13F | CAPROCK Group, Inc. | 16.228 | 0,07 | 318 | 12,01 | ||||
| 2025-11-06 | 13F | Assetmark, Inc | 0 | -100,00 | 0 | |||||
| 2026-04-13 | 13F | Wedge Capital Management L L P/nc | 66.698 | 1,05 | 1.275 | -1,32 | ||||
| 2026-04-16 | 13F | SG Americas Securities, LLC | 44.821 | 179,08 | 1 | |||||
| 2026-02-11 | 13F | Strategic Advocates LLC | 136 | 0,00 | 3 | 0,00 | ||||
| 2026-02-17 | 13F | Bridgeway Capital Management Inc | 775.245 | 2,18 | 15.172 | 10,18 | ||||
| 2026-02-12 | 13F | Hrt Financial Lp | 306.195 | 52,35 | 6 | 66,67 | ||||
| 2025-12-16 | 13F | Garde Capital, Inc. | 0 | -100,00 | 0 | |||||
| 2026-02-17 | 13F | Tower Research Capital LLC (TRC) | 3.258 | -35,00 | 64 | -30,00 | ||||
| 2026-02-06 | 13F | Tortoise Investment Management, LLC | 0 | -100,00 | 0 | |||||
| 2026-02-17 | 13F | Royal Bank Of Canada | 17.792 | -45,96 | 348 | -41,81 | ||||
| 2026-02-10 | 13F | Natixis Advisors, L.p. | 16.191 | -3,53 | 0 | |||||
| 2026-04-08 | 13F | Wealth Enhancement Advisory Services, Llc | 12.192 | 3,97 | 233 | 3,10 | ||||
| 2026-02-17 | 13F | Russell Investments Group, Ltd. | 258.379 | -23,78 | 5.056 | -17,82 | ||||
| 2025-11-13 | 13F | Parallel Advisors, LLC | 0 | -100,00 | 0 | |||||
| 2025-11-14 | 13F | Philadelphia Financial Management of San Francisco, LLC | 0 | -100,00 | 0 | |||||
| 2026-02-11 | 13F | NFC Investments, LLC | 809.454 | 50,91 | 16 | 66,67 | ||||
| 2026-02-09 | 13F | Geode Capital Management, Llc | 677.366 | -4,57 | 13.256 | 2,90 | ||||
| 2026-02-12 | 13F | Dimensional Fund Advisors Lp | 2.787.134 | 6,24 | 54.545 | 14,56 | ||||
| 2026-01-26 | 13F | Cwm, Llc | 21.467 | 44,12 | 0 | |||||
| 2026-02-13 | 13F | Parkside Financial Bank & Trust | 30 | 0,00 | 1 | |||||
| 2026-02-13 | 13F | Arrowstreet Capital, Limited Partnership | 162.218 | 3.175 | ||||||
| 2026-02-06 | 13F | EverSource Wealth Advisors, LLC | 1.030 | 43,45 | 20 | 53,85 | ||||
| 2026-04-24 | 13F | Root Financial Partners, LLC | 135 | 3 | ||||||
| 2026-02-17 | 13F | Advisor Group Holdings, Inc. | 990 | 7,61 | 19 | 18,75 | ||||
| 2026-02-12 | 13F | Federated Hermes, Inc. | 1.581 | 20,96 | 31 | 30,43 | ||||
| 2026-01-29 | 13F | UBS Group AG | 332.806 | -30,13 | 6.513 | -24,66 | ||||
| 2026-02-11 | 13F | CSM Advisors, LLC | 379.567 | 5,25 | 7 | 16,67 | ||||
| 2026-02-18 | 13F/A | Empowered Funds, LLC | 483.245 | 3,55 | 9.457 | 11,65 | ||||
| 2026-02-17 | 13F | Trexquant Investment LP | 166.941 | 3,80 | 3.267 | 11,96 | ||||
| 2026-02-10 | 13F | Bank of New York Mellon Corp | 156.502 | -6,16 | 3.063 | 1,16 | ||||
| 2026-02-17 | 13F | Alliancebernstein L.p. | 60.010 | 0,00 | 1.174 | 7,81 | ||||
| 2025-11-13 | 13F | Winton Capital Group Ltd | 0 | -100,00 | 0 | -100,00 | ||||
| 2026-02-17 | 13F | Doma Perpetual Capital Management LLC | 636.912 | 0,00 | 12.464 | 7,83 | ||||
| 2025-11-14 | 13F | Graham Capital Management, L.P. | 0 | -100,00 | 0 | |||||
| 2026-02-17 | 13F | CVC Management Holdings II Ltd. | 8.597.170 | -32,16 | 168.247 | -26,85 | ||||
| 2026-02-17 | 13F | Cooperman Leon G | 7.041.751 | 5,69 | 137.807 | 13,96 | ||||
| 2025-11-14 | 13F | Quarry LP | 0 | -100,00 | 0 | |||||
| 2026-02-19 | 13F | Invesco Ltd. | 85.052 | -7,86 | 1.664 | -0,66 | ||||
| 2026-02-13 | 13F | Colony Group, LLC | 0 | -100,00 | 0 | -100,00 | ||||
| 2025-11-05 | 13F | Renaissance Group Llc | 0 | -100,00 | 0 | -100,00 | ||||
| 2026-04-28 | 13F | Harbor Capital Advisors, Inc. | 0 | -100,00 | 0 | |||||
| 2026-02-17 | 13F | Voloridge Investment Management, Llc | 260.498 | 246,72 | 5.098 | 273,95 | ||||
| 2026-02-12 | 13F | Renaissance Technologies Llc | 27.100 | -88,37 | 530 | -87,47 | ||||
| 2026-02-17 | 13F | Engineers Gate Manager LP | 0 | -100,00 | 0 | |||||
| 2026-02-12 | 13F | Jane Street Group, Llc | 409.384 | 189,06 | 8.012 | 211,71 | ||||
| 2026-02-13 | 13F | Citigroup Inc | 54.629 | 1,76 | 1.069 | 9,75 | ||||
| 2026-04-17 | 13F | Brown, Lisle/cummings, Inc. | 75 | 1 | ||||||
| 2026-04-30 | 13F | Nuveen, LLC | 533.821 | -0,05 | 10.201 | -2,40 | ||||
| 2026-04-13 | 13F | IFP Advisors, Inc | 413 | 0,49 | 8 | -12,50 | ||||
| 2026-02-17 | 13F | Tudor Investment Corp Et Al | 54.511 | 1.067 | ||||||
| 2026-04-06 | 13F | GAMMA Investing LLC | 197 | 29,61 | 4 | 50,00 | ||||
| 2026-02-06 | 13F | Lsv Asset Management | 4.377.732 | 46,15 | 86 | 57,41 | ||||
| 2026-02-10 | 13F | Savant Capital, LLC | 34.754 | 82,66 | 680 | 97,10 | ||||
| 2026-02-13 | 13F | Verition Fund Management LLC | 21.803 | -11,01 | 427 | -4,05 | ||||
| 2026-04-23 | 13F | SJS Investment Consulting Inc. | 44 | 1.000,00 | 1 | |||||
| 2026-02-06 | 13F | Gsa Capital Partners Llp | 55.886 | 1 | ||||||
| 2026-02-13 | 13F | State Street Corp | 871.614 | -2,08 | 17.057 | 5,58 |
Other Listings
| US:FIHL | 21,13 $ |