Grundlæggende statistik
| Institutionelle ejere | 115 total, 114 long only, 0 short only, 1 long/short - change of -21,77% MRQ |
| Del pris | 2,36 |
| Gennemsnitlig porteføljeallokering | 0.0495 % - change of -62,40% MRQ |
| Institutionelle aktier (lange) | 134.997.982 (ex 13D/G) - change of -126,98MM shares -48,47% MRQ |
| Institutionel værdi (lang) | $ 353.555 USD ($1000) |
Institutionelt ejerskab og aktionærer
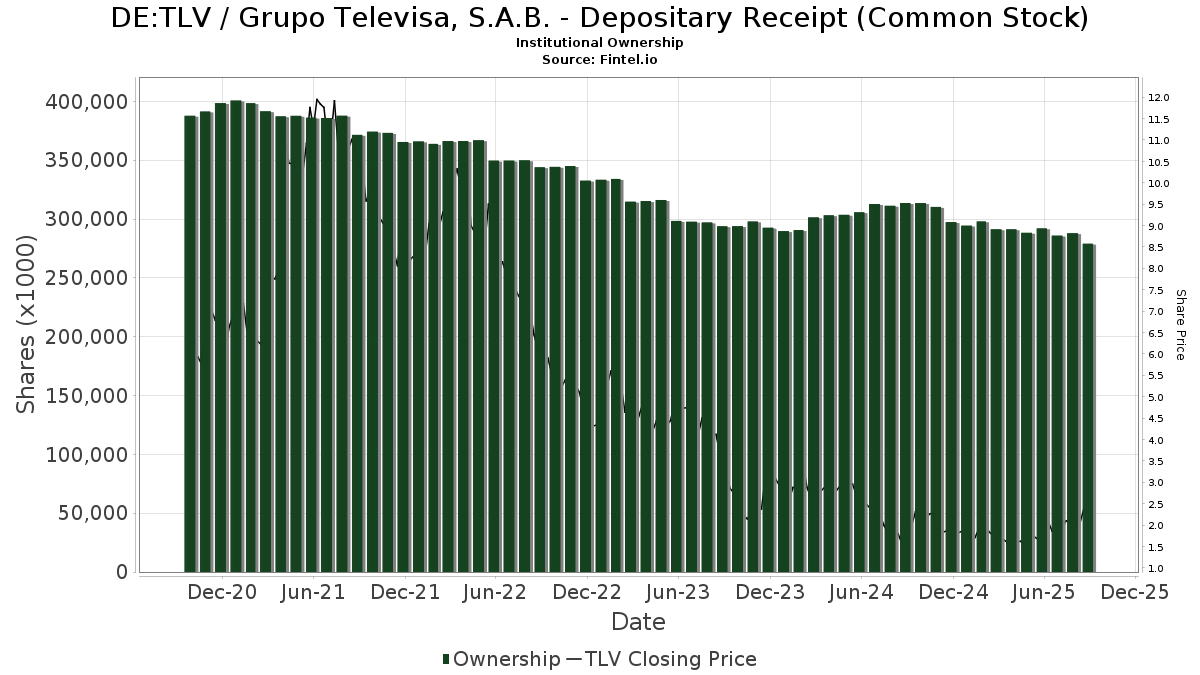
Grupo Televisa, S.A.B. - Depositary Receipt (Common Stock) (DE:TLV) har 115 institutionelle ejere og aktionærer, der har indsendt 13D/G- eller 13F-formularer til Securities Exchange Commission (SEC). Disse institutioner har i alt 134,997,982 aktier. Største aktionærer omfatter Jpmorgan Chase & Co, Discovery Capital Management, Llc / Ct, Gamco Investors, Inc. Et Al, Acadian Asset Management Llc, Delaware Management Holdings, Inc., Gabelli Funds Llc, Morgan Stanley, Fmr Llc, American Century Companies Inc, and Dimensional Fund Advisors Lp .
Grupo Televisa, S.A.B. - Depositary Receipt (Common Stock) (DB:TLV) institutionel ejerskabsstruktur viser aktuelle positioner i virksomheden efter institutioner og fonde, samt seneste ændringer i positionsstørrelse. Større aktionærer kan omfatte individuelle investorer, investeringsforeninger, hedgefonde eller institutioner. Skema 13D angiver, at investoren besidder (eller besidder) mere end 5 % af virksomheden og har til hensigt (eller har til hensigt at) aktivt at forfølge en ændring i forretningsstrategi. Skema 13G indikerer en passiv investering på over 5%.
The share price as of April 30, 2026 is 2,36 / share. Previously, on May 5, 2025, the share price was 1,52 / share. This represents an increase of 55,26% over that period.
Fondens stemningsscore
Fund Sentiment Score (fka Ownership Accumulation Score) finder de aktier, der bliver mest købt af fonde. Det er resultatet af en sofistikeret, multi-faktor kvantitativ model, der identificerer virksomheder med de højeste niveauer af institutionel akkumulering. Scoringsmodellen bruger en kombination af den samlede stigning i oplyste ejere, ændringerne i porteføljeallokeringer i disse ejere og andre målinger. Tallet går fra 0 til 100, hvor højere tal indikerer et højere niveau af akkumulering for sine jævnaldrende, og 50 er gennemsnittet.
Opdateringsfrekvens: Dagligt
Se Ownership Explorer, som giver en liste over højest rangerende virksomheder.
AI+ Ask Fintel’s AI assistant about Grupo Televisa, S.A.B. - Depositary Receipt (Common Stock).
Select a question to share a public post with an AI-crafted answer.
Thinking of good questions…
13F og NPORT arkivering
Detaljer om 13F-arkivering er gratis. Detaljer om NP-ansøgninger kræver et premium-medlemskab. Grønne rækker angiver nye positioner. Røde rækker angiver lukkede positioner. Klik på linket ikon for at se den fulde transaktionshistorik.
Opgrader
for at låse premium-data op og eksportere til Excel ![]() .
.
| Fil dato | Kilde | Investor | Type | Gennemsnitlig pris (Øst) |
Aktier | Δ Aktier (%) |
Rapporteret Værdi ($1000) |
Δ Værdi (%) |
Port Alloc (%) |
|
|---|---|---|---|---|---|---|---|---|---|---|
| 2026-02-18 | 13F | Vident Advisory, LLC | 19.358 | -2,99 | 56 | 5,66 | ||||
| 2026-04-21 | 13F | SmartHarvest Portfolios, LLC | 10.428 | 30 | ||||||
| 2026-02-13 | 13F | Macquarie Group Ltd | 0 | -100,00 | 0 | -100,00 | ||||
| 2026-02-17 | 13F | Delaware Management Holdings, Inc. | 7.704.219 | 22.419 | ||||||
| 2026-02-19 | 13F | Invesco Ltd. | 165.287 | 12,10 | 481 | 21,21 | ||||
| 2026-02-17 | 13F | Millennium Management Llc | 122.927 | -37,23 | 358 | -32,13 | ||||
| 2026-02-10 | 13F | Natixis Advisors, L.p. | 0 | -100,00 | 0 | |||||
| 2026-02-05 | 13F | Allworth Financial LP | 8.437 | 5,08 | 25 | 14,29 | ||||
| 2026-04-07 | 13F | Central Pacific Bank - Trust Division | 15.000 | 0,00 | 44 | 0,00 | ||||
| 2026-02-10 | 13F | Envestnet Asset Management Inc | 227.943 | 36,02 | 663 | 47,33 | ||||
| 2026-02-17 | 13F | Northern Trust Corp | 174.331 | -10,04 | 507 | -2,69 | ||||
| 2026-02-05 | 13F | Bessemer Group Inc | 1.081 | 0 | ||||||
| 2026-02-12 | 13F | Hrt Financial Lp | 274.710 | 248,52 | 1 | |||||
| 2026-02-13 | 13F | MAI Capital Management | 371 | 0,00 | 1 | |||||
| 2026-02-17 | 13F | Public Employees Retirement System Of Ohio | 0 | -100,00 | 0 | |||||
| 2026-02-17 | 13F | SageView Advisory Group, LLC | 10.000 | 0,00 | 29 | 11,54 | ||||
| 2026-02-17 | 13F | Aqr Capital Management Llc | 1.560.539 | -27,01 | 4.541 | -21,03 | ||||
| 2025-11-14 | 13F | Prudential Plc | 0 | -100,00 | 0 | |||||
| 2026-02-13 | 13F | Aigen Investment Management, Lp | 13.063 | 38 | ||||||
| 2026-02-17 | 13F | CastleKnight Management LP | 425.000 | 0,00 | 1.237 | 8,14 | ||||
| 2025-11-13 | 13F | Banco BTG Pactual S.A. | 0 | -100,00 | 0 | |||||
| 2026-02-11 | 13F | Parallel Advisors, LLC | 2.270 | 0,00 | 7 | 0,00 | ||||
| 2026-02-12 | 13F | Dimensional Fund Advisors Lp | 1.941.796 | -5,50 | 5.651 | 2,24 | ||||
| 2026-02-13 | 13F | Healthcare Of Ontario Pension Plan Trust Fund | 588.500 | 0,00 | 1.713 | 8,15 | ||||
| 2026-01-30 | 13F | Harbor Advisors LLC | 24.628 | 0,00 | 72 | 7,58 | ||||
| 2026-04-30 | 13F | GFS Advisors, LLC | 0 | -100,00 | 0 | |||||
| 2026-02-17 | 13F | Two Sigma Securities, Llc | 0 | -100,00 | 0 | |||||
| 2026-02-12 | 13F | Principal Securities, Inc. | 0 | -100,00 | 0 | -100,00 | ||||
| 2026-02-17 | 13F | Citadel Advisors Llc | Put | 10.700 | 31 | |||||
| 2026-02-10 | 13F | Goldman Sachs Group Inc | 730.308 | 117,68 | 2.125 | 135,59 | ||||
| 2026-02-12 | 13F | New York State Common Retirement Fund | 48.648 | 142 | ||||||
| 2026-02-17 | 13F | Lazard Asset Management Llc | 19.473 | 0,00 | 57 | 7,69 | ||||
| 2026-02-17 | 13F | Citadel Advisors Llc | 1.529.767 | 41,17 | 4.452 | 52,75 | ||||
| 2026-04-07 | 13F | Farther Finance Advisors, LLC | 3.627 | 20,74 | 11 | 25,00 | ||||
| 2026-02-17 | 13F | Citadel Advisors Llc | Call | 54.500 | 159 | |||||
| 2026-02-17 | 13F | Advisor Group Holdings, Inc. | 100 | -95,46 | 0 | -100,00 | ||||
| 2026-02-10 | 13F | Axq Capital, Lp | 12.086 | 35 | ||||||
| 2026-02-17 | 13F | Engineers Gate Manager LP | 108.615 | -18,72 | 316 | -11,98 | ||||
| 2026-04-06 | 13F | GAMMA Investing LLC | 1.943 | 93,14 | 6 | 150,00 | ||||
| 2026-02-06 | 13F | EverSource Wealth Advisors, LLC | 4.842 | 47,26 | 14 | 75,00 | ||||
| 2026-04-30 | 13F | Private Trust Co Na | 1.284 | 30,49 | 4 | 50,00 | ||||
| 2025-11-06 | 13F | Abc Arbitrage Sa | 0 | -100,00 | 0 | -100,00 | ||||
| 2026-04-23 | 13F | Oppenheimer & Co Inc | 24.361 | 0,00 | 71 | 0,00 | ||||
| 2026-02-17 | 13F | Coastal Bridge Advisors, LLC | 151.093 | 0,00 | 440 | 8,13 | ||||
| 2026-02-12 | 13F | Hm Payson & Co | 0 | -100,00 | 0 | |||||
| 2026-02-13 | 13F | Dodge & Cox | 0 | -100,00 | 0 | |||||
| 2026-03-05 | 13F/A | Banco Santander, S.A. | 0 | -100,00 | 0 | |||||
| 2026-01-12 | 13F | Byrne Asset Management LLC | 0 | -100,00 | 0 | |||||
| 2026-02-17 | 13F | Captrust Financial Advisors | 14.000 | 0,00 | 41 | 8,11 | ||||
| 2026-05-01 | 13F | Commonwealth Of Pennsylvania Public School Empls Retrmt Sys | 11.002 | 0,00 | 32 | 0,00 | ||||
| 2026-02-13 | 13F | Rhumbline Advisers | 261 | 0,00 | 1 | |||||
| 2026-02-17 | 13F | Voleon Capital Management Lp | 210.400 | 612 | ||||||
| 2026-02-05 | 13F | GABELLI & Co INVESTMENT ADVISERS, INC. | 394.950 | 3,95 | 1.149 | 12,43 | ||||
| 2026-02-17 | 13F | XTX Topco Ltd | 317.327 | 972,85 | 923 | 1.068,35 | ||||
| 2026-02-12 | 13F | CIBC Private Wealth Group, LLC | 376 | 1 | ||||||
| 2026-02-17 | 13F | Susquehanna International Group, Llp | 158.793 | 14,67 | 462 | 24,19 | ||||
| 2026-05-01 | 13F | Gables Capital Management Inc. | 500 | 0,00 | 1 | 0,00 | ||||
| 2026-02-13 | 13F | American Century Companies Inc | 2.644.491 | 13,93 | 7.695 | 23,24 | ||||
| 2026-02-13 | 13F | Headlands Technologies LLC | 87.235 | -8,52 | 254 | -1,17 | ||||
| 2026-04-07 | 13F | Signaturefd, Llc | 15.925 | 0,00 | 46 | 0,00 | ||||
| 2026-02-17 | 13F | Fmr Llc | 4.032.683 | -42,15 | 11.735 | -37,41 | ||||
| 2026-02-12 | 13F | Brown Brothers Harriman & Co | 414 | 0,00 | 1 | 0,00 | ||||
| 2026-04-21 | 13F | Pinnacle Associates Ltd | 74.696 | -0,14 | 217 | 0,00 | ||||
| 2025-11-14 | 13F | Raymond James Financial Inc | 0 | -100,00 | 0 | |||||
| 2026-02-13 | 13F | JustInvest LLC | 0 | -100,00 | 0 | |||||
| 2026-04-24 | 13F | UMA Financial Services, Inc. | 346 | 0,00 | 1 | 0,00 | ||||
| 2026-02-17 | 13F | Capstone Financial Advisors, Inc. | 50.000 | 0,00 | 146 | 8,21 | ||||
| 2026-02-17 | 13F | Quadrature Capital Ltd | 189.405 | 551 | ||||||
| 2026-02-11 | 13F | LPL Financial LLC | 129.184 | 12,26 | 376 | 21,36 | ||||
| 2026-02-13 | 13F | Bleichroeder LP | 0 | -100,00 | 0 | |||||
| 2026-02-12 | 13F | Jane Street Group, Llc | 879.963 | 727,49 | 2.561 | 795,10 | ||||
| 2026-02-17 | 13F | Bank Of America Corp /de/ | 228.942 | -35,59 | 666 | -30,33 | ||||
| 2026-02-12 | 13F | Jane Street Group, Llc | Call | 36.500 | 106 | |||||
| 2026-02-06 | 13F | Global Retirement Partners, LLC | 10.520 | 20,92 | 31 | 30,43 | ||||
| 2025-11-14 | 13F | Lido Advisors, LLC | 0 | -100,00 | 0 | |||||
| 2026-02-10 | 13F/A | Northwestern Mutual Wealth Management Co | 158.888 | -16,16 | 462 | -9,23 | ||||
| 2026-02-11 | 13F | Simplex Trading, Llc | 57.704 | 33,48 | 168 | |||||
| 2026-02-13 | 13F | National Bank Of Canada /fi/ | 327 | 108,28 | 1 | |||||
| 2025-11-04 | 13F | Jones Financial Companies Lllp | 0 | -100,00 | 0 | |||||
| 2026-04-27 | 13F | Td Private Client Wealth Llc | 13.493 | -4,38 | 39 | -4,88 | ||||
| 2026-02-13 | 13F | Caitong International Asset Management Co., Ltd | 16 | -99,76 | 0 | -100,00 | ||||
| 2025-11-10 | 13F | Michels Family Financial, LLC | 0 | -100,00 | 0 | |||||
| 2026-02-12 | 13F | Barometer Capital Management Inc. | 8.500 | -97,35 | 1.197 | 39,02 | ||||
| 2026-02-06 | 13F | Vestmark Advisory Solutions, Inc. | 340.774 | 992 | ||||||
| 2026-02-17 | 13F | Royal Bank Of Canada | 40.309 | -61,45 | 118 | -58,01 | ||||
| 2026-02-05 | 13F | Gabelli Funds Llc | 7.686.600 | 9,82 | 22.368 | 18,81 | ||||
| 2026-02-13 | 13F | Centiva Capital, LP | 34.257 | -53,21 | 100 | -49,49 | ||||
| 2026-02-14 | 13F | Rockefeller Capital Management L.P. | 148.000 | -56,47 | 431 | -52,95 | ||||
| 2026-04-22 | 13F | Pinnacle Bancorp, Inc. | 1.302 | 0,00 | 4 | 0,00 | ||||
| 2026-02-13 | 13F | Marshall Wace, Llp | 1.447.810 | 4.213 | ||||||
| 2026-04-20 | 13F | North of South Capital LLP | 100.000 | 0,00 | 291 | 0,00 | ||||
| 2026-04-21 | 13F | Robeco Institutional Asset Management B.V. | 1.320.020 | 3,43 | 3.841 | 3,45 | ||||
| 2026-01-30 | 13F | Mitsubishi UFJ Trust & Banking Corp | 757.171 | -13,30 | 2.203 | -6,22 | ||||
| 2026-02-06 | 13F | HighTower Advisors, LLC | 28.404 | 1,31 | 83 | 9,33 | ||||
| 2026-02-13 | 13F | Pinnacle Wealth Planning Services, Inc. | 240 | 1 | ||||||
| 2026-02-17 | 13F | Mirabella Financial Services Llp | 276.811 | 59,44 | 806 | 72,38 | ||||
| 2026-02-11 | 13F | Jpmorgan Chase & Co | 27.315.447 | 21,80 | 79.488 | 31,76 | ||||
| 2026-02-17 | 13F | one8zero8, LLC | 15.000 | 0,00 | 44 | 7,50 | ||||
| 2026-02-17 | 13F | Man Group plc | 0 | -100,00 | 0 | |||||
| 2025-11-14 | 13F | Amundi | 0 | -100,00 | 0 | |||||
| 2026-02-17 | 13F | Parvin Asset Management, LLC | 0 | -100,00 | 0 | |||||
| 2026-02-13 | 13F | Wells Fargo & Company/mn | 329.989 | 185,69 | 960 | 209,68 | ||||
| 2026-02-19 | 13F | CI Private Wealth, LLC | 239.152 | 0,12 | 696 | 8,26 | ||||
| 2026-02-13 | 13F | Johnson Investment Counsel Inc | 0 | -100,00 | 0 | |||||
| 2025-11-13 | 13F | EntryPoint Capital, LLC | 0 | -100,00 | 0 | |||||
| 2026-02-13 | 13F | Itau Unibanco Holding S.A. | 302.942 | 2.251,67 | 887 | 2.508,82 | ||||
| 2026-02-17 | 13F | Tower Research Capital LLC (TRC) | 0 | -100,00 | 0 | |||||
| 2026-02-17 | 13F | Creative Planning | 45.930 | 2,25 | 134 | 10,83 | ||||
| 2026-04-16 | 13F | SG Americas Securities, LLC | 28.622 | -6,70 | 0 | |||||
| 2026-02-13 | 13F | Sei Investments Co | 54.000 | 37,76 | 157 | 49,52 | ||||
| 2026-02-11 | 13F | Cerity Partners LLC | 34.600 | 91,16 | 101 | 108,33 | ||||
| 2026-02-17 | 13F | Schonfeld Strategic Advisors LLC | 148.399 | 432 | ||||||
| 2026-04-29 | 13F | R Squared Ltd | 11.830 | -78,32 | 34 | -78,48 | ||||
| 2026-01-27 | 13F | Evergreen Capital Management Llc | 13.031 | 0,00 | 38 | 5,71 | ||||
| 2026-02-13 | 13F | Morgan Stanley | 7.623.020 | 80,58 | 22.183 | 95,35 | ||||
| 2026-02-12 | 13F | BlackRock, Inc. | 553.111 | 19,10 | 1.610 | 28,82 | ||||
| 2026-02-13 | 13F | Citigroup Inc | 23.487 | 4.442,94 | 68 | 6.700,00 | ||||
| 2026-02-10 | 13F | Acadian Asset Management Llc | 13.484.011 | 14,48 | 39 | 25,81 | ||||
| 2026-02-05 | 13F | Gamco Investors, Inc. Et Al | 20.897.253 | 10,44 | 60.811 | 19,47 | ||||
| 2025-11-12 | 13F | Huntington National Bank | 0 | -100,00 | 0 | |||||
| 2026-02-13 | 13F | Transamerica Financial Advisors, Inc. | 246 | 1 | ||||||
| 2025-11-13 | 13F | Canada Pension Plan Investment Board | 0 | -100,00 | 0 | |||||
| 2026-04-16 | 13F | Diversified Trust Co | 12.906 | 0,00 | 38 | 0,00 | ||||
| 2026-02-18 | 13F | GWM Advisors LLC | 9.396 | -81,29 | 27 | -80,00 | ||||
| 2026-01-27 | 13F | Asset Management One Co., Ltd. | 89.229 | 0,00 | 261 | 8,33 | ||||
| 2026-02-17 | 13F | Discovery Capital Management, Llc / Ct | 21.819.041 | 20,43 | 63.493 | 30,28 | ||||
| 2026-02-13 | 13F | BNP Paribas Asset Management Holding S.A. | 9.402 | 0 | ||||||
| 2025-11-14 | 13F | Susquehanna International Group, Llp | Call | 0 | -100,00 | 0 | -100,00 | |||
| 2026-04-22 | 13F | Onyx Bridge Wealth Group LLC | 0 | -100,00 | 0 | |||||
| 2026-04-27 | 13F | Qrg Capital Management, Inc. | 17.440 | 51 | ||||||
| 2026-02-10 | 13F | Bnp Paribas Arbitrage, Sa | 477.393 | 336,77 | 1.389 | 372,45 | ||||
| 2026-02-13 | 13F | Barclays Plc | 129.573 | 173,84 | 377 | 196,85 | ||||
| 2026-02-23 | 13F | Virtu Financial LLC | 56.003 | 96,10 | 0 | |||||
| 2026-01-29 | 13F | UBS Group AG | 1.161.678 | 216,39 | 3.380 | 242,45 | ||||
| 2026-02-13 | 13F | Mml Investors Services, Llc | 10.170 | 1,21 | 30 | 7,41 | ||||
| 2026-02-17 | 13F | Aquatic Capital Management LLC | 56.069 | 37,15 | 163 | 49,54 | ||||
| 2026-04-29 | 13F | Strid Group, LLC | 10.000 | 0,00 | 29 | 0,00 | ||||
| 2026-02-12 | 13F | Quadrant Capital Group Llc | 1.092 | 0,00 | 3 | 50,00 | ||||
| 2026-02-09 | 13F | Employees Retirement System of Texas | 49.904 | 0,00 | 0 | |||||
| 2026-04-07 | 13F | Retirement Wealth Solutions LLC | 120 | 0,00 | 0 | |||||
| 2026-02-11 | 13F | Group One Trading, L.p. | 14.567 | 489,28 | 42 | 600,00 | ||||
| 2026-03-06 | 13F | Hsbc Holdings Plc | 12.629 | 0,00 | 37 | 9,09 | ||||
| 2026-02-13 | 13F | Squarepoint Ops LLC | 38.683 | 22,78 | 113 | 33,33 | ||||
| 2026-01-30 | 13F | Us Bancorp \de\ | 248.713 | 14,58 | 724 | 24,01 | ||||
| 2026-01-23 | 13F | Assetmark, Inc | 53.042 | 32,24 | 154 | 43,93 | ||||
| 2026-02-03 | 13F | Ballentine Partners, LLC | 19.278 | 5,62 | 56 | 14,29 | ||||
| 2026-02-17 | 13F | Alua Capital Management LP | 1.783.510 | -78,81 | 5.190 | -77,08 |
Other Listings
| US:TV | 2,90 $ |