Grundlæggende statistik
| Institutionelle aktier (lange) | 68.866.950 - 28,90% (ex 13D/G) - change of 33,33MM shares 93,81% MRQ |
| Institutionel værdi (lang) | $ 233.418 USD ($1000) |
Institutionelt ejerskab og aktionærer
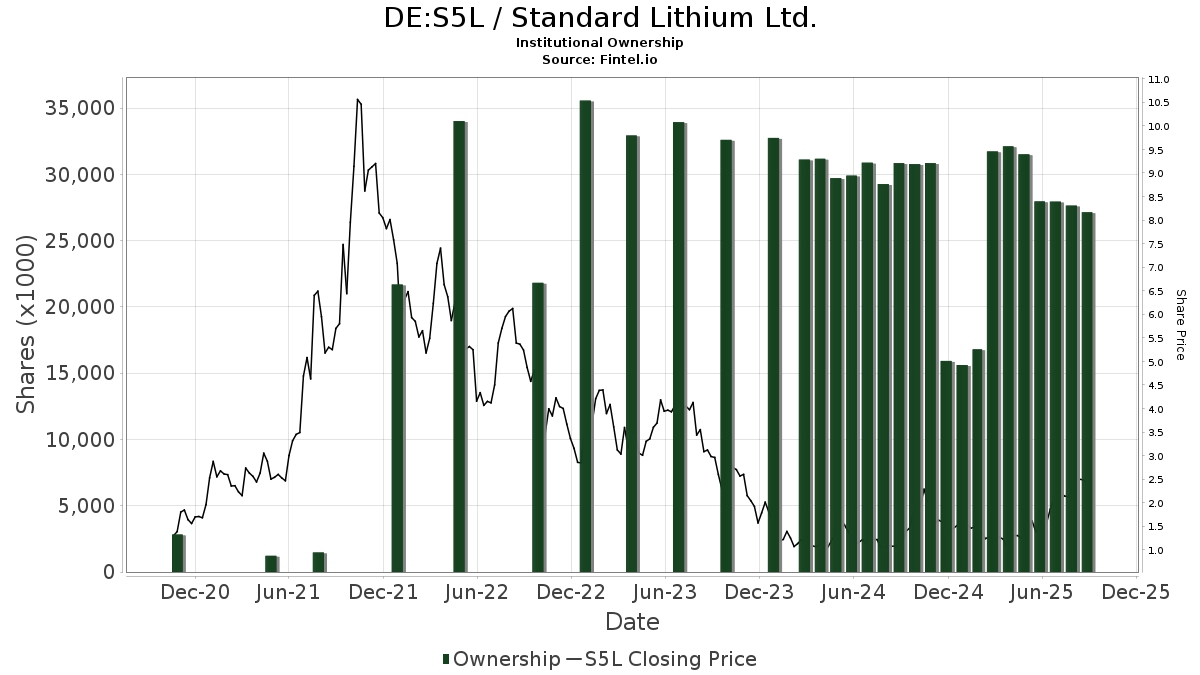
Standard Lithium Ltd. (DE:S5L) har 143 institutionelle ejere og aktionærer, der har indsendt 13D/G- eller 13F-formularer til Securities Exchange Commission (SEC). Disse institutioner har i alt 68,866,950 aktier. Største aktionærer omfatter Van Eck Associates Corp, Koch, Inc., Encompass Capital Advisors LLC, Merewether Investment Management, LP, Morgan Stanley, Invesco Ltd., PBW - Invesco WilderHill Clean Energy ETF, Burkehill Global Management, LP, LIT - Global X Lithium & Battery Tech ETF, and Goldman Sachs Group Inc .
Standard Lithium Ltd. (DB:S5L) institutionel ejerskabsstruktur viser aktuelle positioner i virksomheden efter institutioner og fonde, samt seneste ændringer i positionsstørrelse. Større aktionærer kan omfatte individuelle investorer, investeringsforeninger, hedgefonde eller institutioner. Skema 13D angiver, at investoren besidder (eller besidder) mere end 5 % af virksomheden og har til hensigt (eller har til hensigt at) aktivt at forfølge en ændring i forretningsstrategi. Skema 13G indikerer en passiv investering på over 5%.
The share price as of March 24, 2026 is 3,17 / share. Previously, on March 27, 2025, the share price was 1,27 / share. This represents an increase of 150,39% over that period.
Fondens stemningsscore
Fund Sentiment Score (fka Ownership Accumulation Score) finder de aktier, der bliver mest købt af fonde. Det er resultatet af en sofistikeret, multi-faktor kvantitativ model, der identificerer virksomheder med de højeste niveauer af institutionel akkumulering. Scoringsmodellen bruger en kombination af den samlede stigning i oplyste ejere, ændringerne i porteføljeallokeringer i disse ejere og andre målinger. Tallet går fra 0 til 100, hvor højere tal indikerer et højere niveau af akkumulering for sine jævnaldrende, og 50 er gennemsnittet.
Opdateringsfrekvens: Dagligt
Se Ownership Explorer, som giver en liste over højest rangerende virksomheder.
AI+ Ask Fintel’s AI assistant about Standard Lithium Ltd..
Select a question to share a public post with an AI-crafted answer.
Thinking of good questions…
13F og NPORT arkivering
Detaljer om 13F-arkivering er gratis. Detaljer om NP-ansøgninger kræver et premium-medlemskab. Grønne rækker angiver nye positioner. Røde rækker angiver lukkede positioner. Klik på linket ikon for at se den fulde transaktionshistorik.
Opgrader
for at låse premium-data op og eksportere til Excel ![]() .
.
| Fil dato | Kilde | Investor | Type | Gennemsnitlig pris (Øst) |
Aktier | Δ Aktier (%) |
Rapporteret Værdi ($1000) |
Δ Værdi (%) |
Port Alloc (%) |
|
|---|---|---|---|---|---|---|---|---|---|---|
| 2026-02-10 | 13F | Envestnet Asset Management Inc | 20.000 | -33,27 | 89 | -11,00 | ||||
| 2026-01-21 | 13F | MBA Advisors LLC | 34.800 | -5,43 | 156 | 25,00 | ||||
| 2026-02-17 | 13F | Mercer Global Advisors Inc /adv | 108.455 | 5,31 | 485 | 39,48 | ||||
| 2026-02-17 | 13F | XTX Topco Ltd | 0 | -100,00 | 0 | |||||
| 2026-02-19 | 13F | Invesco Ltd. | 2.205.586 | -12,39 | 9.859 | 16,21 | ||||
| 2026-01-27 | 13F | Regions Financial Corp | 51.000 | 0,00 | 228 | 32,75 | ||||
| 2026-02-03 | 13F | SBI Securities Co., Ltd. | 61 | -3,17 | 0 | |||||
| 2026-02-17 | 13F | Citadel Advisors Llc | Put | 86.500 | 28,53 | 387 | 70,80 | |||
| 2026-02-13 | 13F | Uniting Wealth Partners, LLC | 20.000 | 0,00 | 89 | 32,84 | ||||
| 2026-02-17 | 13F | Citadel Advisors Llc | Call | 189.100 | 330,75 | 845 | 474,83 | |||
| 2026-01-26 | 13F | Cwm, Llc | 3.137 | 460,18 | 0 | |||||
| 2026-02-12 | 13F | Jane Street Group, Llc | 893.716 | 26,98 | 3.995 | 68,45 | ||||
| 2026-02-17 | 13F | Citadel Advisors Llc | 500.000 | -56,04 | 2.235 | -41,68 | ||||
| 2026-02-13 | 13F | National Bank Of Canada /fi/ | 1.184 | 448,15 | 5 | |||||
| 2026-02-12 | 13F | Jane Street Group, Llc | Put | 85.300 | 25,26 | 381 | 66,38 | |||
| 2026-02-12 | 13F | CIBC Private Wealth Group, LLC | 5.000 | 22 | ||||||
| 2026-02-10 | 13F/A | MJT & Associates Financial Advisory Group, Inc. | 877 | 0,00 | 4 | 50,00 | ||||
| 2026-02-13 | 13F | Walleye Capital LLC | 489.276 | 375,48 | 2.187 | 532,08 | ||||
| 2026-02-13 | 13F | Toroso Investments, LLC | 41.624 | 74,12 | 186 | 132,50 | ||||
| 2026-02-19 | 13F | TMB Capital Partners, LLC | 56.839 | 254 | ||||||
| 2025-11-06 | 13F | Compagnie Lombard Odier SCmA | 0 | -100,00 | 0 | -100,00 | ||||
| 2026-02-05 | 13F | Simmons Bank | 111.236 | -5,92 | 497 | 24,87 | ||||
| 2026-02-06 | 13F | Americana Partners, LLC | 66.667 | 0,00 | 298 | 33,04 | ||||
| 2026-02-06 | 13F | Larson Financial Group LLC | 25 | 0 | ||||||
| 2026-02-17 | 13F | Hartree Partners, LP | 0 | -100,00 | 0 | |||||
| 2026-01-21 | 13F | MBL Wealth, LLC | 306.000 | 0,00 | 1.368 | 32,59 | ||||
| 2026-01-14 | 13F | Wolff Wiese Magana Llc | 5.000 | 0,00 | 22 | 37,50 | ||||
| 2026-02-17 | 13F | Two Sigma Securities, Llc | 0 | -100,00 | 0 | |||||
| 2026-02-18 | 13F | Caitlin John, LLC | 0 | -100,00 | 0 | |||||
| 2026-01-13 | 13F | Cadent Capital Advisors, LLC | 10.000 | 0,00 | 45 | 33,33 | ||||
| 2026-01-29 | 13F | UBS Group AG | 143.917 | 441,61 | 643 | 622,47 | ||||
| 2026-02-11 | 13F | Jpmorgan Chase & Co | 24.984 | -23,07 | 138 | 26,61 | ||||
| 2026-02-17 | 13F | D. E. Shaw & Co., Inc. | 824.536 | -33,94 | 3.686 | -12,39 | ||||
| 2026-02-17 | 13F | Bank Of America Corp /de/ | 159.021 | 15,60 | 711 | 53,35 | ||||
| 2025-11-12 | 13F | Transce3nd, LLC | 0 | -100,00 | 0 | |||||
| 2026-02-02 | 13F | Fifth Third Bancorp | 0 | -100,00 | 0 | |||||
| 2026-02-17 | 13F | MIRAE ASSET GLOBAL ETFS HOLDINGS Ltd. | 1.088.839 | -33,67 | 4.824 | -14,43 | ||||
| 2026-02-13 | 13F | Bard Associates Inc | 4.770 | -66,81 | 21 | -56,25 | ||||
| 2026-02-17 | 13F | Susquehanna International Group, Llp | Put | 296.300 | 33,41 | 1.324 | 77,01 | |||
| 2026-02-06 | 13F | IFP Advisors, Inc | 10.000 | 0,00 | 45 | 33,33 | ||||
| 2026-02-10 | 13F | Murphy & Mullick Capital Management Corp | 1.000 | 0,00 | 4 | 33,33 | ||||
| 2026-02-11 | 13F | Cedar Mountain Advisors, LLC | 0 | -100,00 | 0 | |||||
| 2026-02-17 | 13F | Susquehanna International Group, Llp | Call | 317.300 | 224,11 | 1.418 | 331,00 | |||
| 2026-02-17 | 13F | Cetera Investment Advisers | 57.506 | 8,20 | 257 | 43,58 | ||||
| 2026-02-17 | 13F | Susquehanna International Group, Llp | 668.487 | 35,26 | 2.988 | 79,46 | ||||
| 2026-02-11 | 13F | LPL Financial LLC | 110.342 | 8,00 | 493 | 43,31 | ||||
| 2026-02-17 | 13F | Burkehill Global Management, LP | 2.000.000 | 8.940 | ||||||
| 2026-01-12 | 13F | Thompson Davis & Co., Inc. | 11.250 | -8,16 | 50 | 21,95 | ||||
| 2025-11-14 | 13F | Strategic Wealth Partners, Ltd. | 19.074 | 0,00 | 64 | 72,97 | ||||
| 2026-01-16 | 13F | Legacy Capital Wealth Partners, LLC | 58.322 | -6,19 | 261 | 24,40 | ||||
| 2026-02-12 | 13F | Groupe la Francaise | 0 | -100,00 | 0 | |||||
| 2026-02-10 | 13F | Sittner & Nelson, Llc | 1.630 | 0,00 | 7 | 40,00 | ||||
| 2026-01-23 | 13F | Farther Finance Advisors, LLC | 1.700 | 0,00 | 8 | 40,00 | ||||
| 2026-02-09 | 13F | Harbour Investments, Inc. | 4.975 | 0,00 | 22 | 37,50 | ||||
| 2026-02-17 | 13F | Soviero Asset Management, LP | 460.000 | 2.056 | ||||||
| 2026-01-13 | 13F | CoreCap Advisors, LLC | 1.215 | 0,00 | 5 | 25,00 | ||||
| 2026-02-17 | 13F | Millennium Management Llc | 1.191.867 | 280,11 | 5.328 | 404,45 | ||||
| 2026-01-28 | 13F | U S Global Investors Inc | 75.000 | 0,00 | 335 | 32,94 | ||||
| 2026-02-20 | 13F | Kovitz Investment Group Partners, LLC | 0 | -100,00 | 0 | |||||
| 2026-02-09 | 13F | HBK Sorce Advisory LLC | 0 | -100,00 | 0 | -100,00 | ||||
| 2026-02-10 | 13F | Bnp Paribas Arbitrage, Sa | 0 | -100,00 | 0 | |||||
| 2026-02-13 | 13F | Kestra Advisory Services, LLC | 0 | -100,00 | 0 | |||||
| 2026-01-23 | 13F | Gilliland Jeter Wealth Management LLC | 12.384 | 0,00 | 55 | 34,15 | ||||
| 2026-02-17 | 13F | Two Sigma Investments, Lp | 45.470 | -4,46 | 203 | 26,88 | ||||
| 2026-02-13 | 13F | Colony Group, LLC | 14.723 | 66 | ||||||
| 2026-02-12 | 13F | Alps Advisors Inc | 694.793 | 26,65 | 3.106 | 68,02 | ||||
| 2026-01-14 | 13F | Meriwether Wealth & Planning, LLC | 46.098 | 15,97 | 206 | 54,89 | ||||
| 2025-09-29 | NP | PBW - Invesco WilderHill Clean Energy ETF This fund is a listed as child fund of Invesco Ltd. and if that institution has disclosed ownership in this security, then these positions will not be double counted when calculating total shares and total value | 2.204.266 | -22,66 | 5.224 | 23,88 | ||||
| 2026-02-17 | 13F | Quadrature Capital Ltd | 0 | -100,00 | 0 | |||||
| 2026-01-27 | 13F | Retirement Income Solutions, Inc | 53.300 | 0,00 | 238 | 32,96 | ||||
| 2026-02-04 | 13F | Independent Advisor Alliance | 11.440 | 0,00 | 51 | 34,21 | ||||
| 2026-02-17 | 13F | Aquatic Capital Management LLC | 81.822 | 977,74 | 366 | 1.360,00 | ||||
| 2026-01-23 | 13F | Burney Co/ | 10.000 | 45 | ||||||
| 2026-02-05 | 13F | Millennium Capital Advisors, LLC | 237.050 | -2,23 | 1.060 | 29,62 | ||||
| 2026-01-21 | 13F | Sound Income Strategies, LLC | 13.700 | 44,21 | 70 | 68,29 | ||||
| 2026-02-10 | 13F | Acadian Asset Management Llc | 289.100 | 49,25 | 1 | |||||
| 2025-11-14 | 13F | Cubist Systematic Strategies, LLC | 5.123 | 17 | ||||||
| 2026-02-03 | 13F | International Assets Investment Management, Llc | 286.650 | 1,99 | 1.281 | 124,74 | ||||
| 2026-02-05 | 13F | Allworth Financial LP | 270 | 0,00 | 1 | |||||
| 2026-01-09 | 13F | Scott & Selber, Inc. | 10.669 | 0,00 | 48 | 34,29 | ||||
| 2026-02-17 | 13F | Tudor Investment Corp Et Al | 709.204 | 31,63 | 3.170 | 74,66 | ||||
| 2026-02-05 | 13F | Baader Bank INC | 0 | -100,00 | 0 | |||||
| 2026-02-10 | 13F | Goldman Sachs Group Inc | 1.298.043 | 429,46 | 5.802 | 602,42 | ||||
| 2026-02-12 | 13F | Colonial Trust Advisors | 200 | 0,00 | 1 | |||||
| 2026-02-13 | 13F | Wells Fargo & Company/mn | 52.685 | 41,03 | 233 | 82,03 | ||||
| 2026-01-21 | 13F | Sowell Financial Services LLC | 28.500 | 3,64 | 127 | 38,04 | ||||
| 2026-02-12 | 13F | Federation des caisses Desjardins du Quebec | 1.600 | 0,00 | 7 | 20,00 | ||||
| 2026-02-11 | 13F | Cerity Partners LLC | 83.691 | 343,56 | 374 | 493,65 | ||||
| 2026-02-12 | 13F | Greenfield Seitz Capital Management, LLC | 58.700 | 262 | ||||||
| 2026-02-17 | 13F | Ameriprise Financial Inc | 12.660 | 57 | ||||||
| 2026-02-14 | 13F | Howe & Rusling Inc | 20.000 | 89 | ||||||
| 2026-01-21 | 13F | Flagship Harbor Advisors, Llc | 1.000 | 4 | ||||||
| 2026-02-13 | 13F | Dynamic Technology Lab Private Ltd | 18.564 | -49,01 | 83 | -31,97 | ||||
| 2026-01-29 | 13F | Concord Wealth Partners | 1.000 | 0,00 | 4 | 33,33 | ||||
| 2026-01-23 | 13F | Mustard Seed Financial, LLC | 92.253 | 18,18 | 412 | 56,65 | ||||
| 2026-01-08 | 13F | Wealth Enhancement Advisory Services, Llc | 156.211 | -7,72 | 804 | 14,20 | ||||
| 2026-02-06 | 13F | Global Retirement Partners, LLC | 150 | 0,00 | 1 | |||||
| 2026-02-13 | 13F | Caitong International Asset Management Co., Ltd | 0 | -100,00 | 0 | |||||
| 2026-01-23 | 13F | Stanley-Laman Group, Ltd. | 892.195 | 3,35 | 3.988 | 37,09 | ||||
| 2026-02-11 | 13F | Simplex Trading, Llc | 1.700 | -99,07 | 8 | |||||
| 2026-01-27 | 13F | TD Waterhouse Canada Inc. | 12.500 | 400,00 | 55 | 500,00 | ||||
| 2026-02-02 | 13F | Highland Capital Management, Llc | 20.000 | 0,00 | 89 | 32,84 | ||||
| 2026-02-09 | 13F | Hartland & Co., LLC | 643 | 3 | ||||||
| 2026-02-18 | 13F | GWM Advisors LLC | 122.402 | 0,02 | 547 | 32,77 | ||||
| 2026-02-17 | 13F | Qube Research & Technologies Ltd | 0 | -100,00 | 0 | |||||
| 2026-02-12 | 13F | Hrt Financial Lp | 0 | -100,00 | 0 | |||||
| 2026-02-17 | 13F | Balyasny Asset Management Llc | 1.287.718 | 5.756 | ||||||
| 2026-02-11 | 13F | Koch, Inc. | 13.480.083 | 0,00 | 60.256 | 32,64 | ||||
| 2026-02-13 | 13F | Centiva Capital, LP | 362.387 | 1.620 | ||||||
| 2026-02-13 | 13F | State Street Corp | 98.252 | -1,55 | 439 | 30,65 | ||||
| 2026-02-13 | 13F | MAI Capital Management | 62.716 | 2,62 | 280 | 36,59 | ||||
| 2026-02-13 | 13F | Van Eck Associates Corp | 15.539.435 | 69 | ||||||
| 2026-03-11 | 13F | Leonteq Securities AG | 0 | -100,00 | 0 | |||||
| 2026-02-12 | 13F | Commonwealth Equity Services, Llc | 117.764 | -30,37 | 526 | |||||
| 2026-02-11 | 13F | Empowered Funds, LLC | 27.995 | 125 | ||||||
| 2026-02-13 | 13F | Pathstone Holdings, LLC | 40.190 | 33,97 | 180 | 77,23 | ||||
| 2026-02-19 | 13F | CI Private Wealth, LLC | 0 | -100,00 | 0 | |||||
| 2026-02-12 | 13F | Renaissance Technologies Llc | 0 | -100,00 | 0 | |||||
| 2026-02-23 | 13F | Virtu Financial LLC | 49.086 | 32,21 | 0 | |||||
| 2025-11-14 | 13F | Wolverine Trading, Llc | Put | 28.300 | 96 | |||||
| 2026-02-05 | 13F | Cambridge Investment Research Advisors, Inc. | 24.139 | 0 | ||||||
| 2026-02-06 | 13F | Quantify Chaos Advisors, Llc | 44.095 | 197 | ||||||
| 2026-02-13 | 13F | Mariner, LLC | 56.873 | 182,71 | 254 | 279,10 | ||||
| 2026-02-17 | 13F | Lighthouse Investment Partners, LLC | 735.000 | 568,18 | 3.285 | 787,84 | ||||
| 2026-01-23 | 13F | Gainplan LLC | 20.260 | 29,89 | 91 | 73,08 | ||||
| 2026-02-04 | 13F | Nwam Llc | 50.602 | -27,92 | 266 | -11,92 | ||||
| 2026-02-06 | 13F | New Millennium Group LLC | 350 | 0,00 | 2 | 0,00 | ||||
| 2025-11-14 | 13F | Wolverine Trading, Llc | 23.963 | 95,76 | 81 | 252,17 | ||||
| 2026-02-12 | 13F | Principal Securities, Inc. | 21.000 | -29,22 | 94 | -6,06 | ||||
| 2025-11-14 | 13F | Wolverine Trading, Llc | Call | 34.500 | 28,25 | 117 | 132,00 | |||
| 2026-02-17 | 13F | Jump Financial, LLC | 19.635 | 88 | ||||||
| 2026-02-17 | 13F | Merewether Investment Management, LP | 4.037.000 | 18.045 | ||||||
| 2026-02-12 | 13F | Marex Group plc | 225.171 | 1.007 | ||||||
| 2026-02-05 | 13F | Stephens Inc /ar/ | 157.355 | -39,67 | 703 | -19,93 | ||||
| 2026-01-09 | 13F | SG Americas Securities, LLC | 29.986 | -37,08 | 0 | |||||
| 2026-02-17 | 13F | Hancock Whitney Corp | 13.930 | 0,00 | 62 | 34,78 | ||||
| 2026-02-13 | 13F | OMERS ADMINISTRATION Corp | 0 | -100,00 | 0 | |||||
| 2026-01-16 | 13F | Empirical Financial Services, LLC d.b.a. Empirical Wealth Management | 0 | -100,00 | 0 | |||||
| 2026-02-06 | 13F | Banque Cantonale Vaudoise | 26.800 | 109,38 | 119 | |||||
| 2026-02-17 | 13F | Tower Research Capital LLC (TRC) | 1.778 | -82,75 | 8 | -79,41 | ||||
| 2025-10-27 | 13F | Kiker Wealth Management, LLC | 0 | -100,00 | 0 | |||||
| 2026-02-17 | 13F | Encompass Capital Advisors LLC | 8.053.722 | 36.000 | ||||||
| 2026-02-13 | 13F | Citigroup Inc | 1 | 0 | ||||||
| 2026-02-17 | 13F | Jones Financial Companies Lllp | 16.593 | 1,49 | 74 | 21,31 | ||||
| 2026-01-23 | 13F | U.S. Capital Wealth Advisors, LLC | 37.000 | 57,45 | 165 | 108,86 | ||||
| 2026-01-30 | 13F | Kohmann Bosshard Financial Services, LLC | 1.000 | 4 | ||||||
| 2026-02-06 | 13F | HighTower Advisors, LLC | 24.232 | 1,15 | 108 | 35,00 | ||||
| 2026-01-14 | 13F | Spire Wealth Management | 151 | 1 | ||||||
| 2026-02-11 | 13F | Group One Trading, L.p. | 130.568 | -53,96 | 584 | -38,95 | ||||
| 2026-01-21 | 13F | Stone House Investment Management, LLC | 8.343 | 734,30 | 37 | 1.133,33 | ||||
| 2026-02-11 | 13F | Argent Advisors, Inc. | 10.710 | 48 | ||||||
| 2026-02-17 | 13F | Royal Bank Of Canada | 4.710 | -95,94 | 21 | -94,62 | ||||
| 2026-02-17 | 13F | Blair William & Co/il | 18.500 | 0,00 | 83 | 32,26 | ||||
| 2026-01-29 | 13F | KC Investment Advisors, LLC | 10.630 | -19,95 | 48 | -16,07 | ||||
| 2026-02-10 | 13F | Quantbot Technologies LP | 0 | -100,00 | 0 | |||||
| 2026-01-21 | 13F | Naviter Wealth, LLC | 29.824 | 133 | ||||||
| 2026-02-17 | 13F | Susquehanna Advisors Group, Inc. | 10.700 | 48 | ||||||
| 2026-01-29 | 13F | IMC-Chicago, LLC | 61.689 | 276 | ||||||
| 2026-02-17 | 13F | Advisor Group Holdings, Inc. | 114.708 | -6,59 | 513 | 25,49 | ||||
| 2026-02-17 | 13F | Raymond James Financial Inc | 326.473 | 46,77 | 1.459 | 94,79 | ||||
| 2026-01-21 | 13F | Apella Capital, LLC | 10.000 | 0,00 | 45 | -16,98 | ||||
| 2026-02-13 | 13F | Morgan Stanley | 3.019.423 | 58,18 | 13.497 | 109,83 | ||||
| 2026-02-12 | 13F | BlackRock, Inc. | 259.573 | -2,11 | 1.160 | 29,90 | ||||
| 2026-02-14 | 13F | Rockefeller Capital Management L.P. | 2.217 | 10 | ||||||
| 2026-02-17 | 13F | Point72 Asset Management, L.P. | 0 | -100,00 | 0 | |||||
| 2026-02-13 | 13F | Barclays Plc | 100.710 | 0,00 | 450 | 32,74 | ||||
| 2026-01-23 | 13F | First PREMIER Bank | 6.000 | 0,00 | 0 | |||||
| 2026-02-10 | 13F/A | Northwestern Mutual Wealth Management Co | 11.000 | 10,00 | 49 | 48,48 | ||||
| 2026-02-11 | 13F | Winton Capital Group Ltd | 19.235 | 86 | ||||||
| 2026-02-17 | 13F | Amundi | 1.079.000 | 4.823 | ||||||
| 2026-02-11 | 13F | Parallel Advisors, LLC | 11.000 | 1.000,00 | 49 | 1.533,33 | ||||
| 2026-03-06 | 13F | Hsbc Holdings Plc | 23.572 | 107 | ||||||
| 2026-02-17 | 13F | Cambria Investment Management, L.P. | 27.995 | 125 | ||||||
| 2025-09-29 | NP | LIT - Global X Lithium & Battery Tech ETF This fund is a listed as child fund of Mirae Asset Global Investments Co., Ltd. and if that institution has disclosed ownership in this security, then these positions will not be double counted when calculating total shares and total value | 1.520.150 | 7,91 | 3.540 | 70,19 | ||||
| 2026-02-17 | 13F | SummitTX Capital, L.P. | 50.000 | 224 | ||||||
| 2026-02-17 | 13F | Engineers Gate Manager LP | 68.547 | 306 |