Grundlæggende statistik
| Institutionelle aktier (lange) | 27.075.526 - 39,26% (ex 13D/G) - change of 7,68MM shares 39,57% MRQ |
| Institutionel værdi (lang) | $ 54.346 USD ($1000) |
Institutionelt ejerskab og aktionærer
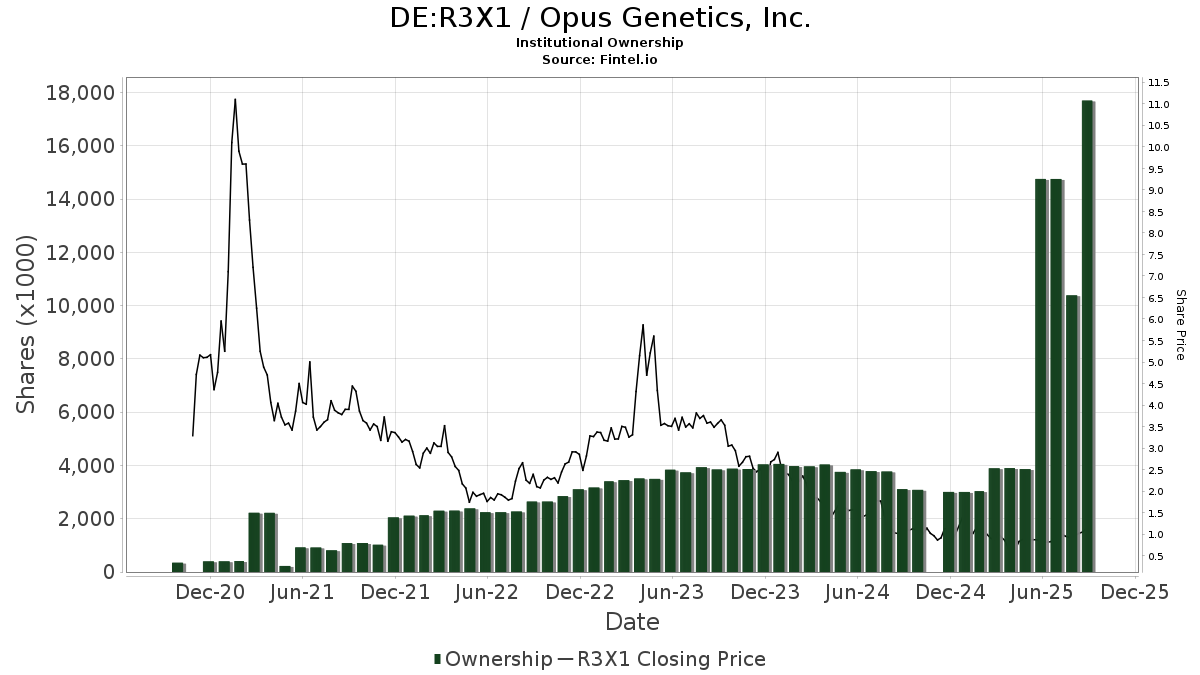
Opus Genetics, Inc. (DE:R3X1) har 58 institutionelle ejere og aktionærer, der har indsendt 13D/G- eller 13F-formularer til Securities Exchange Commission (SEC). Disse institutioner har i alt 27,075,526 aktier. Største aktionærer omfatter Nantahala Capital Management, LLC, Perceptive Advisors Llc, BIOS Capital Management, LP, Balyasny Asset Management Llc, Vanguard Group Inc, Millennium Management Llc, Mink Brook Asset Management LLC, Opaleye Management Inc., Adage Capital Partners Gp, L.l.c., and Geode Capital Management, Llc .
Opus Genetics, Inc. (DB:R3X1) institutionel ejerskabsstruktur viser aktuelle positioner i virksomheden efter institutioner og fonde, samt seneste ændringer i positionsstørrelse. Større aktionærer kan omfatte individuelle investorer, investeringsforeninger, hedgefonde eller institutioner. Skema 13D angiver, at investoren besidder (eller besidder) mere end 5 % af virksomheden og har til hensigt (eller har til hensigt at) aktivt at forfølge en ændring i forretningsstrategi. Skema 13G indikerer en passiv investering på over 5%.
The share price as of March 5, 2026 is 4,10 / share. Previously, on March 7, 2025, the share price was 0,90 / share. This represents an increase of 357,54% over that period.
Fondens stemningsscore
Fund Sentiment Score (fka Ownership Accumulation Score) finder de aktier, der bliver mest købt af fonde. Det er resultatet af en sofistikeret, multi-faktor kvantitativ model, der identificerer virksomheder med de højeste niveauer af institutionel akkumulering. Scoringsmodellen bruger en kombination af den samlede stigning i oplyste ejere, ændringerne i porteføljeallokeringer i disse ejere og andre målinger. Tallet går fra 0 til 100, hvor højere tal indikerer et højere niveau af akkumulering for sine jævnaldrende, og 50 er gennemsnittet.
Opdateringsfrekvens: Dagligt
Se Ownership Explorer, som giver en liste over højest rangerende virksomheder.
AI+ Ask Fintel’s AI assistant about Opus Genetics, Inc..
Select a question to share a public post with an AI-crafted answer.
Thinking of good questions…
13F og NPORT arkivering
Detaljer om 13F-arkivering er gratis. Detaljer om NP-ansøgninger kræver et premium-medlemskab. Grønne rækker angiver nye positioner. Røde rækker angiver lukkede positioner. Klik på linket ikon for at se den fulde transaktionshistorik.
Opgrader
for at låse premium-data op og eksportere til Excel ![]() .
.
| Fil dato | Kilde | Investor | Type | Gennemsnitlig pris (Øst) |
Aktier | Δ Aktier (%) |
Rapporteret Værdi ($1000) |
Δ Værdi (%) |
Port Alloc (%) |
|
|---|---|---|---|---|---|---|---|---|---|---|
| 2026-02-13 | 13F | Marshall Wace, Llp | 157.648 | 317 | ||||||
| 2026-02-13 | 13F | Voss Capital, LLC | 441.891 | -21,42 | 888 | -4,21 | ||||
| 2026-02-17 | 13F | Adage Capital Partners Gp, L.l.c. | 1.104.996 | 15,71 | 2.221 | 41,02 | ||||
| 2026-02-17 | 13F | Royal Bank Of Canada | 299 | 896,67 | 1 | |||||
| 2026-02-17 | 13F | Perceptive Advisors Llc | 4.325.000 | 0,00 | 8.693 | 21,82 | ||||
| 2026-02-17 | 13F | ADAR1 Capital Management, LLC | 40.000 | 80 | ||||||
| 2026-02-17 | 13F | Stokes Family Office, LLC | 12.120 | 0,00 | 24 | 26,32 | ||||
| 2026-02-17 | 13F | Creative Planning | 128.366 | 0,00 | 258 | 22,27 | ||||
| 2026-02-13 | 13F | Prudential Financial Inc | 0 | -100,00 | 0 | |||||
| 2026-02-23 | 13F | Virtu Financial LLC | 16.810 | 0 | ||||||
| 2026-02-17 | 13F | Bridgeway Capital Management Inc | 42.065 | 0,00 | 85 | 21,74 | ||||
| 2026-02-11 | 13F | Hilton Head Capital Partners, LLC | 4.472 | 9 | ||||||
| 2026-02-12 | 13F | Renaissance Technologies Llc | 126.309 | -27,33 | 254 | -11,54 | ||||
| 2026-02-17 | 13F | Blair William & Co/il | 27.466 | 12,26 | 55 | 37,50 | ||||
| 2025-11-14 | 13F | Sofos Investments, Inc. | 0 | -100,00 | 0 | -100,00 | ||||
| 2026-02-17 | 13F | Raymond James Financial Inc | 20.508 | -8,89 | 41 | 10,81 | ||||
| 2025-11-14 | 13F | Tower Research Capital LLC (TRC) | 0 | -100,00 | 0 | -100,00 | ||||
| 2026-02-13 | 13F | OMERS ADMINISTRATION Corp | 87.900 | 177 | ||||||
| 2026-02-05 | 13F | Allworth Financial LP | 5 | 0 | ||||||
| 2026-02-11 | 13F | Simplex Trading, Llc | 9.063 | -72,41 | 18 | |||||
| 2026-01-28 | 13F | Bedel Financial Consulting, Inc. | 15.000 | 0,00 | 30 | 25,00 | ||||
| 2025-11-14 | 13F | Citadel Advisors Llc | Call | 0 | -100,00 | 0 | -100,00 | |||
| 2026-02-17 | 13F | Occudo Quantitative Strategies Lp | 12.205 | 25 | ||||||
| 2026-02-17 | 13F | XTX Topco Ltd | 23.737 | -54,14 | 48 | -44,71 | ||||
| 2026-02-03 | 13F | International Assets Investment Management, Llc | 521 | 1 | ||||||
| 2026-02-17 | 13F | Balyasny Asset Management Llc | 2.718.029 | 5.463 | ||||||
| 2026-01-29 | 13F | Comerica Bank | 12.000 | 0,00 | 24 | 26,32 | ||||
| 2026-02-13 | 13F | BIOS Capital Management, LP | 3.683.429 | 0,00 | 7.404 | 12,29 | ||||
| 2026-02-13 | 13F | Nantahala Capital Management, LLC | 4.781.330 | 42,90 | 9.610 | 74,09 | ||||
| 2026-02-17 | 13F | Millennium Management Llc | 2.002.550 | 4.025 | ||||||
| 2026-02-13 | 13F | Johnson Investment Counsel Inc | 20.000 | 40 | ||||||
| 2026-02-09 | 13F | Texas Capital Bank Wealth Management Services Inc | 78.000 | 157 | ||||||
| 2026-02-09 | 13F | Geode Capital Management, Llc | 504.983 | 7,69 | 1.016 | 31,31 | ||||
| 2026-02-03 | 13F | SBI Securities Co., Ltd. | 2.574 | -0,31 | 5 | 25,00 | ||||
| 2026-02-17 | 13F | Bank Of America Corp /de/ | 2.186 | 470,76 | 4 | |||||
| 2026-01-29 | 13F | James Investment Research Inc | 16.364 | 0,00 | 33 | 18,52 | ||||
| 2026-02-13 | 13F | Citigroup Inc | 496 | 49.500,00 | 1 | |||||
| 2026-02-17 | 13F | Advisor Group Holdings, Inc. | 13.900 | -0,03 | 28 | 17,39 | ||||
| 2026-02-11 | 13F | Empowered Funds, LLC | 42.065 | 0,00 | 85 | 21,74 | ||||
| 2026-02-13 | 13F | MAI Capital Management | 0 | -100,00 | 0 | |||||
| 2026-02-13 | 13F | National Bank Of Canada /fi/ | 2.014 | 0,00 | 4 | 33,33 | ||||
| 2026-02-12 | 13F | BlackRock, Inc. | 141.897 | 207,84 | 285 | 275,00 | ||||
| 2026-02-10 | 13F | Regency Capital Management Inc.\DE | 46.000 | 92 | ||||||
| 2026-02-18 | 13F | GWM Advisors LLC | 16.364 | 0,00 | 33 | 18,52 | ||||
| 2026-01-14 | 13F | First City Capital Management, Inc. | 11.836 | 24 | ||||||
| 2026-02-17 | 13F | Two Sigma Securities, Llc | 0 | -100,00 | 0 | |||||
| 2026-02-12 | 13F | Annandale Capital, LLC | 10.000 | 0,00 | 0 | |||||
| 2026-02-06 | 13F | Reliant Investment Partners, LLC | 10.000 | 0,00 | 20 | 11,11 | ||||
| 2026-02-17 | 13F | Susquehanna International Group, Llp | Call | 46.200 | 93 | |||||
| 2026-01-29 | 13F | Vanguard Group Inc | 2.322.897 | 73,09 | 4.669 | 110,89 | ||||
| 2026-02-17 | 13F | Susquehanna International Group, Llp | 201.635 | 897,55 | 405 | 1.127,27 | ||||
| 2026-01-29 | 13F | UBS Group AG | 89.818 | 10.060,41 | 181 | 17.900,00 | ||||
| 2026-02-13 | 13F | Bleichroeder LP | 0 | -100,00 | 0 | |||||
| 2025-10-28 | 13F | CarsonAllaria Wealth Management, Ltd. | 0 | -100,00 | 0 | |||||
| 2026-02-13 | 13F | State Street Corp | 173.253 | 18,77 | 348 | 45,00 | ||||
| 2026-02-17 | 13F | Qube Research & Technologies Ltd | 39.978 | 80 | ||||||
| 2026-02-12 | 13F | Hrt Financial Lp | 0 | -100,00 | 0 | |||||
| 2026-02-13 | 13F | Morgan Stanley | 28.665 | 0,21 | 58 | 21,28 | ||||
| 2026-02-17 | 13F | Northern Trust Corp | 87.447 | 28,17 | 176 | 56,25 | ||||
| 2026-02-13 | 13F | Barclays Plc | 1.900 | 0,00 | 4 | 0,00 | ||||
| 2026-02-17 | 13F | Two Sigma Advisers, Lp | 0 | -100,00 | 0 | |||||
| 2026-02-13 | 13F | Wells Fargo & Company/mn | 241.871 | 6.290,25 | 486 | 8.000,00 | ||||
| 2026-02-17 | 13F | Citadel Advisors Llc | 180.721 | 59,34 | 363 | 94,12 | ||||
| 2026-02-12 | 13F | Miller Financial Services LLC | 10.000 | 20 | ||||||
| 2026-02-17 | 13F | Captrust Financial Advisors | 32.000 | 0,00 | 64 | 23,08 | ||||
| 2026-01-29 | 13F | Kestra Private Wealth Services, Llc | 16.000 | -15,79 | 32 | 3,23 | ||||
| 2026-02-13 | 13F | Mink Brook Asset Management LLC | 1.665.631 | 34,55 | 3.348 | 63,91 | ||||
| 2026-02-17 | 13F | Opaleye Management Inc. | 1.120.000 | 1,82 | 2.251 | 24,02 | ||||
| 2026-02-17 | 13F | Two Sigma Investments, Lp | 151.312 | 39,67 | 304 | 70,79 |
Other Listings
| US:IRD | 4,89 $ |