Grundlæggende statistik
| Institutionelle ejere | 90 total, 86 long only, 0 short only, 4 long/short - change of -34,78% MRQ |
| Gennemsnitlig porteføljeallokering | 0.0992 % - change of 13,36% MRQ |
| Institutionelle aktier (lange) | 7.318.561 (ex 13D/G) - change of -0,68MM shares -8,54% MRQ |
| Institutionel værdi (lang) | $ 104.719 USD ($1000) |
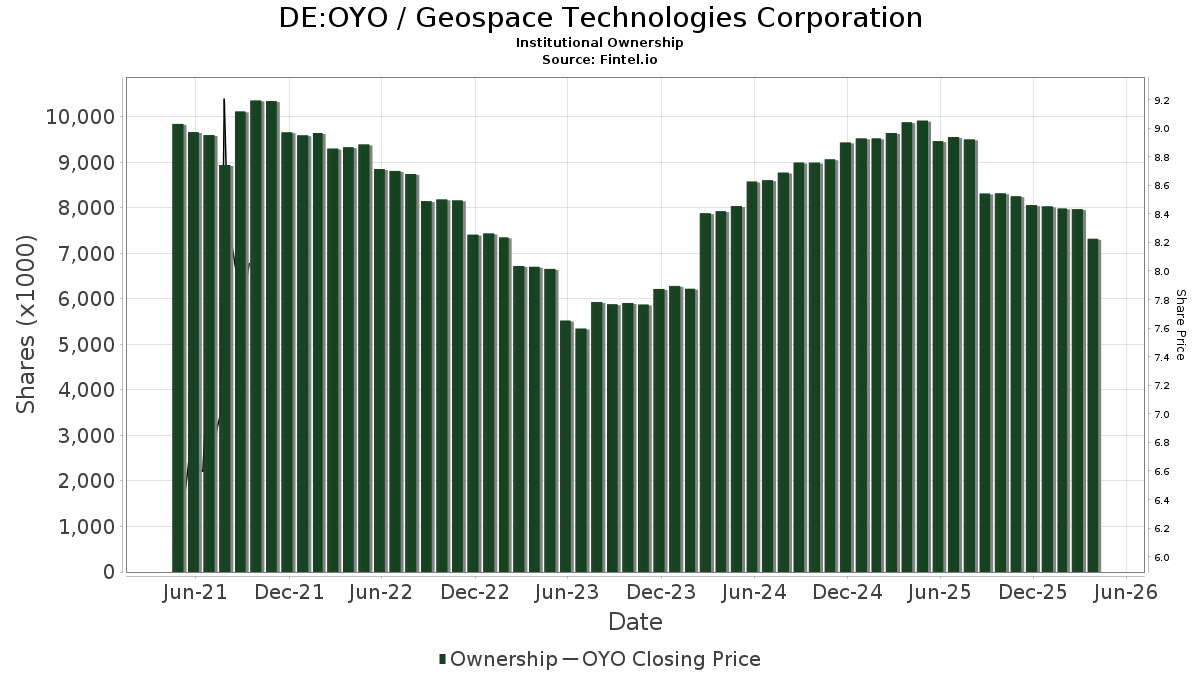
Institutionelt ejerskab og aktionærer
Geospace Technologies Corporation (DE:OYO) har 90 institutionelle ejere og aktionærer, der har indsendt 13D/G- eller 13F-formularer til Securities Exchange Commission (SEC). Disse institutioner har i alt 7,318,561 aktier. Største aktionærer omfatter Disciplined Growth Investors Inc /mn, Tieton Capital Management, LLC, Vanguard Group Inc, Moors & Cabot, Inc., Dimensional Fund Advisors Lp, Grace & White Inc /ny, First Eagle Investment Management, LLC, Susquehanna International Group, Llp, BlackRock, Inc., and Sei Investments Co .
Geospace Technologies Corporation (DB:OYO) institutionel ejerskabsstruktur viser aktuelle positioner i virksomheden efter institutioner og fonde, samt seneste ændringer i positionsstørrelse. Større aktionærer kan omfatte individuelle investorer, investeringsforeninger, hedgefonde eller institutioner. Skema 13D angiver, at investoren besidder (eller besidder) mere end 5 % af virksomheden og har til hensigt (eller har til hensigt at) aktivt at forfølge en ændring i forretningsstrategi. Skema 13G indikerer en passiv investering på over 5%.
Fondens stemningsscore
Fund Sentiment Score (fka Ownership Accumulation Score) finder de aktier, der bliver mest købt af fonde. Det er resultatet af en sofistikeret, multi-faktor kvantitativ model, der identificerer virksomheder med de højeste niveauer af institutionel akkumulering. Scoringsmodellen bruger en kombination af den samlede stigning i oplyste ejere, ændringerne i porteføljeallokeringer i disse ejere og andre målinger. Tallet går fra 0 til 100, hvor højere tal indikerer et højere niveau af akkumulering for sine jævnaldrende, og 50 er gennemsnittet.
Opdateringsfrekvens: Dagligt
Se Ownership Explorer, som giver en liste over højest rangerende virksomheder.
AI+ Ask Fintel’s AI assistant about Geospace Technologies Corporation.
Select a question to share a public post with an AI-crafted answer.
Thinking of good questions…
13F og NPORT arkivering
Detaljer om 13F-arkivering er gratis. Detaljer om NP-ansøgninger kræver et premium-medlemskab. Grønne rækker angiver nye positioner. Røde rækker angiver lukkede positioner. Klik på linket ikon for at se den fulde transaktionshistorik.
Opgrader
for at låse premium-data op og eksportere til Excel ![]() .
.
| Fil dato | Kilde | Investor | Type | Gennemsnitlig pris (Øst) |
Aktier | Δ Aktier (%) |
Rapporteret Værdi ($1000) |
Δ Værdi (%) |
Port Alloc (%) |
|
|---|---|---|---|---|---|---|---|---|---|---|
| 2026-02-13 | 13F | Essex Investment Management Co Llc | 13.636 | 0,00 | 231 | -10,85 | ||||
| 2026-02-13 | 13F | State Street Corp | 125.936 | 118,30 | 2.130 | 94,78 | ||||
| 2025-10-27 | 13F | First Horizon Corp | 0 | -100,00 | 0 | |||||
| 2026-02-04 | 13F | First Eagle Investment Management, LLC | 430.273 | -17,71 | 7.276 | -26,61 | ||||
| 2026-02-09 | 13F | Harbour Investments, Inc. | 5 | 0,00 | 0 | |||||
| 2026-02-12 | 13F | BlackRock, Inc. | 221.106 | 6,73 | 3.739 | -4,81 | ||||
| 2026-04-13 | 13F | IFP Advisors, Inc | 232 | 3 | ||||||
| 2026-02-12 | 13F | Renaissance Technologies Llc | 0 | -100,00 | 0 | |||||
| 2026-02-13 | 13F | Charles Schwab Investment Management Inc | 10.429 | 176 | ||||||
| 2026-01-07 | 13F | Aventura Private Wealth, LLC | 324 | -80,94 | 5 | -84,37 | ||||
| 2026-04-27 | 13F | Mount Yale Investment Advisors, LLC | 24.355 | 0,35 | 297 | -27,56 | ||||
| 2026-02-17 | 13F | Citadel Advisors Llc | Put | 33.500 | -57,76 | 566 | -62,34 | |||
| 2026-02-17 | 13F | Citadel Advisors Llc | 58.726 | 15,55 | 993 | 3,12 | ||||
| 2026-04-21 | 13F | Grace & White Inc /ny | 473.201 | 53,74 | 5.773 | 10,93 | ||||
| 2026-01-30 | 13F | Us Bancorp \de\ | 127.134 | 2,50 | 2.150 | -8,59 | ||||
| 2026-02-17 | 13F | Citadel Advisors Llc | Call | 33.800 | -52,46 | 572 | -57,64 | |||
| 2026-02-06 | 13F | Gsa Capital Partners Llp | 24.520 | 12,85 | 0 | |||||
| 2026-02-17 | 13F | Susquehanna International Group, Llp | Put | 22.200 | 4,23 | 375 | -6,95 | |||
| 2026-02-17 | 13F | Susquehanna International Group, Llp | Call | 59.700 | -77,57 | 1.010 | -80,01 | |||
| 2026-02-17 | 13F | Qube Research & Technologies Ltd | 32.251 | 545 | ||||||
| 2026-02-17 | 13F | Susquehanna International Group, Llp | 231.285 | 57,61 | 3.911 | 40,58 | ||||
| 2026-01-30 | 13F | Glenorchy Capital Ltd | 170.992 | -6,18 | 2.891 | -16,32 | ||||
| 2026-02-13 | 13F | Barclays Plc | 23.344 | 305,21 | 395 | 261,47 | ||||
| 2026-02-12 | 13F | Triumph Capital Management | 100 | 2 | ||||||
| 2025-11-14 | 13F | Jain Global LLC | 0 | -100,00 | 0 | |||||
| 2026-02-10 | 13F | EagleClaw Capital Managment, LLC | 61.150 | 0,00 | 1.034 | -10,79 | ||||
| 2026-02-13 | 13F | OMERS ADMINISTRATION Corp | 20.100 | 340 | ||||||
| 2026-02-11 | 13F | LPL Financial LLC | 13.200 | 223 | ||||||
| 2026-02-05 | 13F | Allworth Financial LP | 0 | -100,00 | 0 | |||||
| 2025-11-14 | 13F | Jane Street Group, Llc | Put | 0 | -100,00 | 0 | -100,00 | |||
| 2026-02-13 | 13F | De Lisle Partners LLP | 147.133 | 2,01 | 2.482 | -8,95 | ||||
| 2026-02-13 | 13F | Citigroup Inc | 3.309 | 689,74 | 56 | 685,71 | ||||
| 2026-02-20 | 13F | Sunbelt Securities, Inc. | 300 | 0,00 | 5 | 0,00 | ||||
| 2026-04-07 | 13F | CoreCap Advisors, LLC | 950 | 0,00 | 12 | -31,25 | ||||
| 2026-01-29 | 13F | UBS Group AG | 6.817 | 189,96 | 115 | 161,36 | ||||
| 2026-02-06 | 13F | Kingdom Financial Group LLC. | 194 | 3 | ||||||
| 2026-01-26 | 13F | Cwm, Llc | 204 | 234,43 | 0 | |||||
| 2026-02-10 | 13F | Goldman Sachs Group Inc | 60.136 | 229,13 | 1.017 | 193,64 | ||||
| 2026-02-13 | 13F | Squarepoint Ops LLC | 0 | -100,00 | 0 | |||||
| 2026-02-17 | 13F | Royal Bank Of Canada | 711 | -98,55 | 12 | -98,71 | ||||
| 2026-02-11 | 13F | Group One Trading, L.p. | 0 | -100,00 | 0 | -100,00 | ||||
| 2026-02-17 | 13F | Bridgeway Capital Management Inc | 114.707 | -17,25 | 1.940 | -26,22 | ||||
| 2026-02-06 | 13F | Mraz, Amerine & Associates, Inc. | 24.081 | 0,00 | 407 | -10,75 | ||||
| 2026-02-06 | 13F | FourThought Financial Partners, LLC | 16.339 | 276 | ||||||
| 2026-02-17 | 13F | Bank Of America Corp /de/ | 14.665 | -39,59 | 248 | -46,30 | ||||
| 2026-02-17 | 13F | Fmr Llc | 1.111 | 0,00 | 19 | -14,29 | ||||
| 2026-02-10 | 13F | Bnp Paribas Arbitrage, Sa | 796 | -76,95 | 13 | -80,00 | ||||
| 2026-02-17 | 13F | Tower Research Capital LLC (TRC) | 5.230 | 88 | ||||||
| 2026-02-11 | 13F | Empowered Funds, LLC | 40.291 | -37,24 | 681 | -44,04 | ||||
| 2025-11-14 | 13F | Wolverine Trading, Llc | Call | 25.200 | 483 | |||||
| 2026-01-29 | 13F | IMC-Chicago, LLC | 12.478 | 211 | ||||||
| 2026-01-29 | 13F | IMC-Chicago, LLC | Call | 12.000 | 203 | |||||
| 2026-02-12 | 13F | Dimensional Fund Advisors Lp | 544.099 | -13,42 | 9.201 | -22,77 | ||||
| 2026-02-10 | 13F | Moors & Cabot, Inc. | 575.950 | -19,42 | 9.739 | -28,13 | ||||
| 2026-02-17 | 13F | Disciplined Growth Investors Inc /mn | 1.131.568 | -1,91 | 19.135 | -12,52 | ||||
| 2026-02-12 | 13F | CIBC Private Wealth Group, LLC | 6.650 | -5,00 | 112 | -15,15 | ||||
| 2026-02-17 | 13F | Millennium Management Llc | 62.020 | -48,68 | 1.049 | -54,26 | ||||
| 2025-11-14 | 13F | Point72 (DIFC) Ltd | 27 | 1 | ||||||
| 2026-01-29 | 13F | Vanguard Group Inc | 648.222 | 2,17 | 10.961 | -8,88 | ||||
| 2026-02-17 | 13F | Northern Trust Corp | 38.938 | -1,98 | 658 | -12,62 | ||||
| 2026-02-03 | 13F | International Assets Investment Management, Llc | 700 | 12 | ||||||
| 2025-11-14 | 13F | Point72 Asia (Singapore) Pte. Ltd. | 5.371 | 102 | ||||||
| 2026-02-09 | 13F | Geode Capital Management, Llc | 146.107 | 2,46 | 2.472 | -8,58 | ||||
| 2026-02-17 | 13F | Advisor Group Holdings, Inc. | 2.365 | 127,84 | 40 | 105,26 | ||||
| 2026-02-17 | 13F | Parvin Asset Management, LLC | 750 | 13 | ||||||
| 2025-11-10 | 13F | EverSource Wealth Advisors, LLC | 0 | -100,00 | 0 | |||||
| 2026-02-10 | 13F | Tieton Capital Management, LLC | 884.176 | -0,47 | 15 | -12,50 | ||||
| 2025-11-14 | 13F | Raymond James Financial Inc | 0 | -100,00 | 0 | |||||
| 2025-11-14 | 13F | SummitTX Capital, L.P. | 0 | -100,00 | 0 | |||||
| 2026-02-13 | 13F | Wells Fargo & Company/mn | 10.908 | -28,36 | 184 | -36,11 | ||||
| 2026-02-17 | 13F | XTX Topco Ltd | 22.936 | 388 | ||||||
| 2026-02-12 | 13F | Skopos Labs, Inc. | 43.799 | 762 | ||||||
| 2026-02-12 | 13F | Jane Street Group, Llc | Call | 0 | -100,00 | 0 | -100,00 | |||
| 2025-11-14 | 13F | Cubist Systematic Strategies, LLC | 22.770 | 432 | ||||||
| 2026-02-11 | 13F | Simplex Trading, Llc | Put | 500 | -98,85 | 8 | ||||
| 2026-02-17 | 13F | Tannin Capital LLC | 13.545 | 229 | ||||||
| 2026-02-12 | 13F | Hrt Financial Lp | 0 | -100,00 | 0 | |||||
| 2026-02-13 | 13F | Arrowstreet Capital, Limited Partnership | 0 | -100,00 | 0 | |||||
| 2026-02-11 | 13F | Simplex Trading, Llc | 2.001 | 34 | ||||||
| 2026-02-11 | 13F | Simplex Trading, Llc | Call | 1.400 | -96,29 | 24 | ||||
| 2026-02-13 | 13F | Sei Investments Co | 196.956 | 3.331 | ||||||
| 2026-02-03 | 13F | SBI Securities Co., Ltd. | 1.290 | -11,83 | 22 | -22,22 | ||||
| 2026-04-16 | 13F | Capital Advisors, Ltd. LLC | 122 | 0,00 | 0 | |||||
| 2026-02-13 | 13F | Kestra Advisory Services, LLC | 3.952 | 67 | ||||||
| 2026-04-16 | 13F | Toth Financial Advisory Corp | 100 | 1 | ||||||
| 2026-02-05 | 13F | Cambridge Investment Research Advisors, Inc. | 58.174 | 582,87 | 1 | -100,00 | ||||
| 2026-01-28 | 13F | Peapod Lane Capital LLC | 37.817 | -55,51 | 639 | -60,36 | ||||
| 2026-02-17 | 13F | Two Sigma Investments, Lp | 58.288 | 57,64 | 986 | 40,51 | ||||
| 2026-02-10 | 13F | REAP Financial Group, LLC | 100 | 0,00 | 2 | 0,00 | ||||
| 2026-02-10 | 13F | Quantbot Technologies LP | 0 | -100,00 | 0 | |||||
| 2026-02-12 | 13F | Commonwealth Equity Services, Llc | 21.885 | 370 | ||||||
| 2026-04-07 | 13F | Signaturefd, Llc | 54 | 0,00 | 1 | |||||
| 2026-02-09 | 13F | Quest Partners LLC | 27.604 | 11,64 | 467 | -0,43 | ||||
| 2026-02-17 | 13F | Advisory Services Network, LLC | 0 | -100,00 | 0 | |||||
| 2026-02-10 | 13F | Hazlett, Burt & Watson, Inc. | 400 | 0 | ||||||
| 2026-02-13 | 13F | Marshall Wace, Llp | 11.785 | 199 | ||||||
| 2026-02-13 | 13F | Rhumbline Advisers | 439 | 0,00 | 7 | -12,50 | ||||
| 2025-10-31 | 13F | Y-Intercept (Hong Kong) Ltd | 0 | -100,00 | 0 | |||||
| 2026-02-13 | 13F | Morgan Stanley | 17.264 | 129,00 | 292 | 104,93 | ||||
| 2025-11-26 | 13F/A | Jpmorgan Chase & Co | 0 | -100,00 | 0 | |||||
| 2026-02-17 | 13F | Balyasny Asset Management Llc | 10.530 | 178 | ||||||
| 2026-02-12 | 13F | Jane Street Group, Llc | 24.918 | -30,70 | 421 | -38,18 | ||||
| 2026-02-13 | 13F | American Century Companies Inc | 30.141 | -64,76 | 510 | -68,60 | ||||
| 2025-11-14 | 13F | Brevan Howard Capital Management LP | 0 | -100,00 | 0 | |||||
| 2026-04-24 | 13F | Root Financial Partners, LLC | 34 | 0,00 | 0 | |||||
| 2026-02-13 | 13F | Hurley Capital, LLC | 206 | 3 | ||||||
| 2026-02-10 | 13F | Acadian Asset Management Llc | 22.058 | 55,98 | 0 | |||||
| 2026-02-12 | 13F | Ironwood Investment Management Llc | 36.776 | -0,22 | 622 | -11,03 | ||||
| 2026-02-17 | 13F | Optiver Holding B.V. | 6 | 0,00 | 0 | |||||
| 2026-02-12 | 13F | EAM Investors, LLC | 0 | -100,00 | 0 | |||||
| 2026-02-13 | 13F | Hudson Bay Capital Management LP | 18.714 | 316 | ||||||
| 2026-04-07 | 13F | Farther Finance Advisors, LLC | 192 | -83,73 | 2 | -89,47 | ||||
| 2026-02-17 | 13F | Jones Financial Companies Lllp | 580 | 329,63 | 10 | 350,00 | ||||
| 2026-02-17 | 13F | 683 Capital Management, LLC | 39.252 | 664 | ||||||
| 2025-11-12 | 13F | Victory Capital Management Inc | 0 | -100,00 | 0 | |||||
| 2026-02-06 | 13F | Vestmark Advisory Solutions, Inc. | 24.271 | 410 | ||||||
| 2026-02-11 | 13F | Group One Trading, L.p. | Put | 500 | 400,00 | 8 | 700,00 | |||
| 2026-02-11 | 13F | Group One Trading, L.p. | Call | 10.000 | 96,08 | 169 | 76,04 |
Other Listings
| US:GEOS | 10,15 $ |