Grundlæggende statistik
| Institutionelle aktier (lange) | 19.647.444 - 35,25% (ex 13D/G) - change of 5,13MM shares 35,29% MRQ |
| Institutionel værdi (lang) | $ 38.484 USD ($1000) |
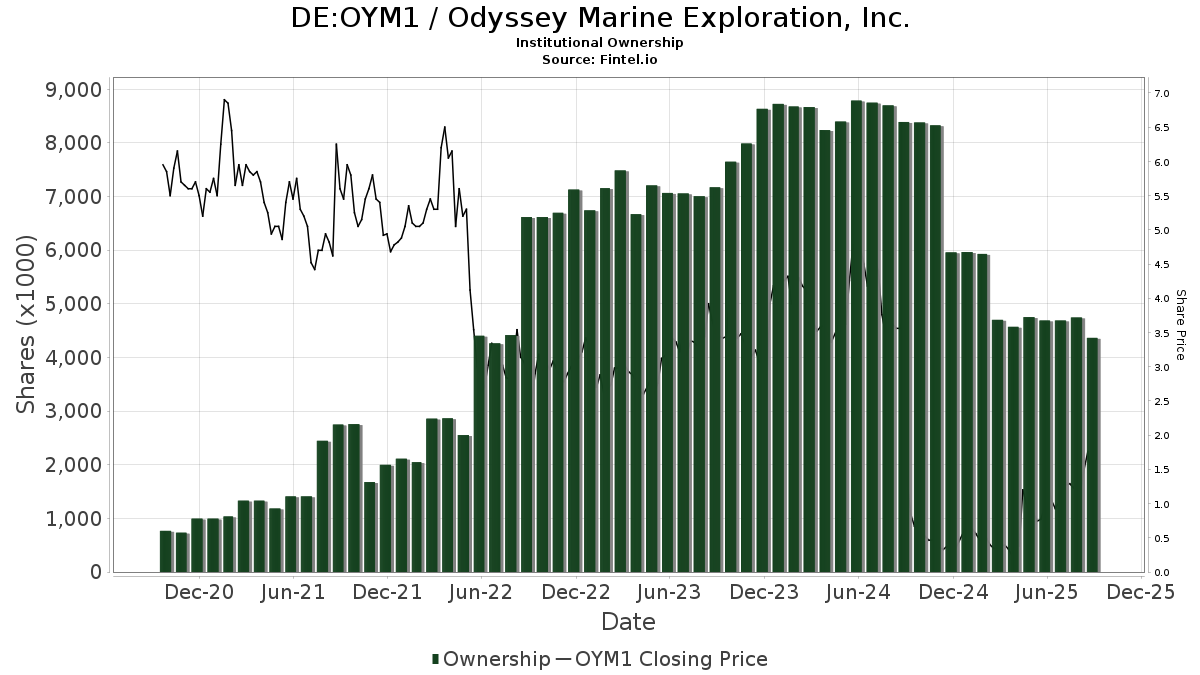
Institutionelt ejerskab og aktionærer
Odyssey Marine Exploration, Inc. (DE:OYM1) har 62 institutionelle ejere og aktionærer, der har indsendt 13D/G- eller 13F-formularer til Securities Exchange Commission (SEC). Disse institutioner har i alt 19,647,444 aktier. Største aktionærer omfatter Old West Investment Management, LLC, Two Seas Capital LP, Jefferies Financial Group Inc., Susquehanna International Group, Llp, Vanguard Group Inc, Rangeley Capital, LLC, Geode Capital Management, Llc, Renaissance Technologies Llc, Group One Trading, L.p., and Susquehanna International Group, Llp .
Odyssey Marine Exploration, Inc. (DB:OYM1) institutionel ejerskabsstruktur viser aktuelle positioner i virksomheden efter institutioner og fonde, samt seneste ændringer i positionsstørrelse. Større aktionærer kan omfatte individuelle investorer, investeringsforeninger, hedgefonde eller institutioner. Skema 13D angiver, at investoren besidder (eller besidder) mere end 5 % af virksomheden og har til hensigt (eller har til hensigt at) aktivt at forfølge en ændring i forretningsstrategi. Skema 13G indikerer en passiv investering på over 5%.
The share price as of March 11, 2026 is 1,40 / share. Previously, on March 17, 2025, the share price was 0,37 / share. This represents an increase of 276,34% over that period.
Fondens stemningsscore
Fund Sentiment Score (fka Ownership Accumulation Score) finder de aktier, der bliver mest købt af fonde. Det er resultatet af en sofistikeret, multi-faktor kvantitativ model, der identificerer virksomheder med de højeste niveauer af institutionel akkumulering. Scoringsmodellen bruger en kombination af den samlede stigning i oplyste ejere, ændringerne i porteføljeallokeringer i disse ejere og andre målinger. Tallet går fra 0 til 100, hvor højere tal indikerer et højere niveau af akkumulering for sine jævnaldrende, og 50 er gennemsnittet.
Opdateringsfrekvens: Dagligt
Se Ownership Explorer, som giver en liste over højest rangerende virksomheder.
AI+ Ask Fintel’s AI assistant about Odyssey Marine Exploration, Inc..
Select a question to share a public post with an AI-crafted answer.
Thinking of good questions…
13F og NPORT arkivering
Detaljer om 13F-arkivering er gratis. Detaljer om NP-ansøgninger kræver et premium-medlemskab. Grønne rækker angiver nye positioner. Røde rækker angiver lukkede positioner. Klik på linket ikon for at se den fulde transaktionshistorik.
Opgrader
for at låse premium-data op og eksportere til Excel ![]() .
.
| Fil dato | Kilde | Investor | Type | Gennemsnitlig pris (Øst) |
Aktier | Δ Aktier (%) |
Rapporteret Værdi ($1000) |
Δ Værdi (%) |
Port Alloc (%) |
|
|---|---|---|---|---|---|---|---|---|---|---|
| 2026-01-28 | 13F | CAPROCK Group, Inc. | 50.140 | 98 | ||||||
| 2026-02-11 | 13F | Simplex Trading, Llc | Call | 33.200 | -76,70 | 65 | ||||
| 2026-02-17 | 13F | Advisor Group Holdings, Inc. | 671 | -88,17 | 1 | -90,91 | ||||
| 2026-01-29 | 13F | UBS Group AG | 326.173 | 378,96 | 639 | 384,09 | ||||
| 2026-02-11 | 13F | Simplex Trading, Llc | Put | 256.900 | 139,42 | 504 | ||||
| 2026-02-03 | 13F | SBI Securities Co., Ltd. | 367 | 2.193,75 | 1 | |||||
| 2026-02-11 | 13F | Simplex Trading, Llc | 178.554 | 8.717,48 | 350 | |||||
| 2026-02-13 | 13F | Silicon Valley Capital Partners | 9 | 0,00 | 0 | |||||
| 2026-02-09 | 13F | Jefferies Financial Group Inc. | 1.500.000 | 275,00 | 2.940 | 276,92 | ||||
| 2026-01-28 | 13F | Papp L Roy & Associates | 152.461 | 0,00 | 299 | 0,34 | ||||
| 2025-11-03 | 13F | Stonegate Investment Group, LLC | 72.066 | -2,70 | 141 | 60,92 | ||||
| 2026-01-22 | 13F | Financial Consulate, Inc | 9 | 0,00 | 0 | |||||
| 2026-02-09 | 13F | Cary Street Partners Financial Llc | 19.000 | 0,00 | 37 | 0,00 | ||||
| 2026-01-29 | 13F | Concurrent Investment Advisors, LLC | 17.000 | 0,00 | 33 | 0,00 | ||||
| 2026-02-06 | 13F | Global Retirement Partners, LLC | 570 | 0,00 | 1 | 0,00 | ||||
| 2026-02-09 | 13F | SLT Holdings LLC | 291.250 | 4,86 | 571 | 5,36 | ||||
| 2026-02-09 | 13F | Geode Capital Management, Llc | 559.991 | 37,28 | 1.098 | 38,11 | ||||
| 2026-02-12 | 13F | BlackRock, Inc. | 415.069 | 25,49 | 814 | 26,24 | ||||
| 2025-11-14 | 13F | Jane Street Group, Llc | Put | 0 | -100,00 | 0 | -100,00 | |||
| 2026-01-12 | 13F | ARS Wealth Advisors Group, LLC | 17.730 | 0,00 | 35 | 0,00 | ||||
| 2025-11-14 | 13F | Wolverine Trading, Llc | Call | 91.100 | 231,27 | 175 | 480,00 | |||
| 2025-11-14 | 13F | Wolverine Trading, Llc | Put | 50.100 | 96 | |||||
| 2026-02-11 | 13F | Smithbridge Asset Management Inc/de | 36.010 | 200,08 | 71 | 204,35 | ||||
| 2026-02-12 | 13F | Jane Street Group, Llc | 271.455 | 258,36 | 532 | 261,90 | ||||
| 2026-01-22 | 13F | Apollon Wealth Management, LLC | 22.646 | 4,62 | 44 | 4,76 | ||||
| 2026-02-17 | 13F | Cetera Investment Advisers | 0 | -100,00 | 0 | -100,00 | ||||
| 2026-02-13 | 13F | Peak6 Llc | Call | 25.600 | -95,73 | 50 | -95,73 | |||
| 2026-02-12 | 13F | Jane Street Group, Llc | Call | 44.200 | 53,47 | 87 | 53,57 | |||
| 2025-11-14 | 13F | Raymond James Financial Inc | 0 | -100,00 | 0 | |||||
| 2026-01-29 | 13F | Vanguard Group Inc | 868.585 | 35,64 | 1.702 | 36,38 | ||||
| 2026-02-12 | 13F | Renaissance Technologies Llc | 488.599 | 1.428,93 | 958 | 1.443,55 | ||||
| 2026-02-17 | 13F | Sig Brokerage, Lp | Call | 10.600 | 21 | |||||
| 2026-01-14 | 13F | Tradewinds Capital Management, LLC | 13.600 | 27 | ||||||
| 2026-02-13 | 13F | State Street Corp | 195.512 | -8,43 | 383 | -7,93 | ||||
| 2026-02-11 | 13F | Jpmorgan Chase & Co | 26.987 | 53 | ||||||
| 2026-02-17 | 13F | Sender Co & Partners, Inc. | 0 | -100,00 | 0 | -100,00 | ||||
| 2026-02-13 | 13F | Wells Fargo & Company/mn | 1 | -99,93 | 0 | -100,00 | ||||
| 2026-02-17 | 13F | Mangrove Partners | 197.952 | 388 | ||||||
| 2026-02-17 | 13F | Sender Co & Partners, Inc. | Call | 0 | -100,00 | 0 | -100,00 | |||
| 2026-02-17 | 13F | Tower Research Capital LLC (TRC) | 1.177 | 2 | ||||||
| 2026-01-20 | 13F | Voisard Asset Management Group, Inc. | 70.000 | 65,48 | 137 | 67,07 | ||||
| 2026-02-13 | 13F | Morgan Stanley | 49.214 | 10.716,26 | 96 | |||||
| 2026-02-17 | 13F | XTX Topco Ltd | 100.135 | 196 | ||||||
| 2025-11-14 | 13F | National Bank Of Canada /fi/ | 0 | -100,00 | 0 | -100,00 | ||||
| 2025-11-14 | 13F | National Bank Of Canada /fi/ | Put | 0 | -100,00 | 0 | -100,00 | |||
| 2026-02-17 | 13F | Bank Of America Corp /de/ | 28.670 | 50,02 | 56 | 51,35 | ||||
| 2026-02-13 | 13F | Peak6 Llc | 0 | -100,00 | 0 | -100,00 | ||||
| 2026-02-17 | 13F | Qube Research & Technologies Ltd | 77.812 | 153 | ||||||
| 2026-01-23 | 13F | Avion Wealth | 875 | 0,00 | 0 | |||||
| 2026-02-11 | 13F | Group One Trading, L.p. | Call | 127.800 | 86,84 | 250 | 87,97 | |||
| 2026-02-11 | 13F | Group One Trading, L.p. | Put | 183.600 | 293,15 | 360 | 294,51 | |||
| 2026-01-30 | 13F | 5th Street Advisors, LLC | 13.621 | 0,00 | 27 | 0,00 | ||||
| 2026-02-11 | 13F | Group One Trading, L.p. | 457.719 | -34,87 | 897 | -34,53 | ||||
| 2026-02-10 | 13F | Goldman Sachs Group Inc | 0 | -100,00 | 0 | -100,00 | ||||
| 2026-02-13 | 13F | Citigroup Inc | 1 | -99,77 | 0 | |||||
| 2026-02-17 | 13F | Two Sigma Investments, Lp | 94.420 | 12,37 | 185 | 13,50 | ||||
| 2026-02-17 | 13F | Old West Investment Management, LLC | 5.496.448 | 49,49 | 10.773 | 50,27 | ||||
| 2025-11-12 | 13F | Barclays Plc | 0 | -100,00 | 0 | |||||
| 2026-02-18 | 13F | GWM Advisors LLC | 62.066 | 73.788,10 | 122 | |||||
| 2026-01-08 | 13F | True Wealth Design, LLC | 42 | 0 | ||||||
| 2026-02-04 | 13F | Valeo Financial Advisors, LLC | 30.028 | 59 | ||||||
| 2026-02-10 | 13F | Meramec Financial Planners, LLC | 63 | 0 | ||||||
| 2026-02-10 | 13F | Foundations Investment Advisors, LLC | 291.250 | 4,86 | 571 | 5,36 | ||||
| 2026-02-02 | 13F | GenTrust, LLC | 10.378 | 0,00 | 20 | 0,00 | ||||
| 2026-02-13 | 13F | Parkside Financial Bank & Trust | 1.010 | 10.000,00 | 2 | |||||
| 2026-01-23 | 13F | Farther Finance Advisors, LLC | 1.000 | 2 | ||||||
| 2026-02-13 | 13F | Stifel Financial Corp | 15.000 | 29 | ||||||
| 2026-01-29 | 13F | IMC-Chicago, LLC | Call | 256.700 | 503 | |||||
| 2026-02-13 | 13F | Centiva Capital, LP | 0 | -100,00 | 0 | -100,00 | ||||
| 2026-02-17 | 13F | Jones Financial Companies Lllp | 0 | -100,00 | 0 | |||||
| 2026-02-11 | 13F | Two Seas Capital LP | 5.185.029 | 13,46 | 10.163 | 14,04 | ||||
| 2026-02-17 | 13F | Citadel Advisors Llc | 16.673 | -89,38 | 33 | -89,54 | ||||
| 2026-02-17 | 13F | Citadel Advisors Llc | Put | 69.600 | 85,11 | 136 | 86,30 | |||
| 2026-02-17 | 13F | Citadel Advisors Llc | Call | 291.600 | 55,94 | 572 | 56,87 | |||
| 2026-02-17 | 13F | Parallax Volatility Advisers, L.P. | Call | 35.300 | 488,33 | 69 | 1.625,00 | |||
| 2026-02-05 | 13F | Allworth Financial LP | 292 | 0,00 | 1 | |||||
| 2026-02-17 | 13F | Northern Trust Corp | 117.441 | 21,33 | 230 | 22,34 | ||||
| 2025-11-14 | 13F | Wolverine Trading, Llc | 0 | -100,00 | 0 | -100,00 | ||||
| 2026-01-09 | 13F | SG Americas Securities, LLC | Call | 390.000 | 0 | |||||
| 2025-11-14 | 13F | Royal Bank Of Canada | 0 | -100,00 | 0 | |||||
| 2026-01-16 | 13F | FNY Investment Advisers, LLC | 0 | -100,00 | 0 | |||||
| 2026-01-16 | 13F | FNY Investment Advisers, LLC | Call | 0 | -100,00 | 0 | ||||
| 2026-02-12 | 13F | Commonwealth Equity Services, Llc | 23.553 | -0,78 | 46 | |||||
| 2026-02-13 | 13F | MAI Capital Management | 3.075 | 0,00 | 6 | 20,00 | ||||
| 2026-02-17 | 13F | Susquehanna International Group, Llp | Call | 388.500 | -25,66 | 761 | -25,32 | |||
| 2026-02-17 | 13F | Rangeley Capital, LLC | 608.749 | 26,96 | 1.193 | 27,73 | ||||
| 2026-01-26 | 13F | Northwest Financial Advisors | 0 | -100,00 | 0 | -100,00 | ||||
| 2026-02-17 | 13F | Susquehanna International Group, Llp | 1.169.296 | 74,23 | 2.292 | 75,15 | ||||
| 2026-02-17 | 13F | Susquehanna International Group, Llp | Put | 429.800 | 216,26 | 842 | 217,74 | |||
| 2025-11-13 | 13F | Total Investment Management Inc | 0 | -100,00 | 0 | -100,00 |
Other Listings
| US:OMEX | 1,53 $ |