Grundlæggende statistik
| Institutionelle aktier (lange) | 35.235.841 - 87,77% (ex 13D/G) - change of -4,49MM shares -11,31% MRQ |
| Institutionel værdi (lang) | $ 528.561 USD ($1000) |
Institutionelt ejerskab og aktionærer
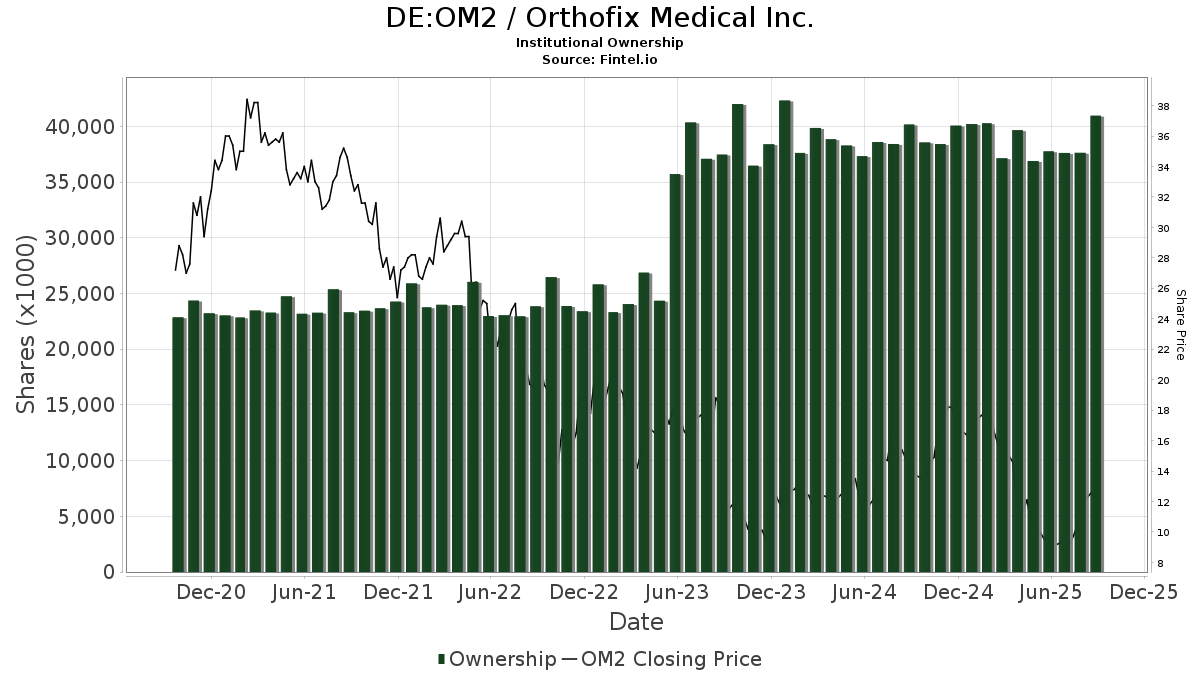
Orthofix Medical Inc. (DE:OM2) har 145 institutionelle ejere og aktionærer, der har indsendt 13D/G- eller 13F-formularer til Securities Exchange Commission (SEC). Disse institutioner har i alt 35,235,841 aktier. Største aktionærer omfatter Engine Capital Management, LP, Rubric Capital Management LP, Juniper Investment Company, LLC, Paradigm Capital Management Inc/ny, BlackRock, Inc., Armistice Capital, Llc, Vanguard Group Inc, Millennium Management Llc, Philosophy Capital Management LLC, and Dimensional Fund Advisors Lp .
Orthofix Medical Inc. (DB:OM2) institutionel ejerskabsstruktur viser aktuelle positioner i virksomheden efter institutioner og fonde, samt seneste ændringer i positionsstørrelse. Større aktionærer kan omfatte individuelle investorer, investeringsforeninger, hedgefonde eller institutioner. Skema 13D angiver, at investoren besidder (eller besidder) mere end 5 % af virksomheden og har til hensigt (eller har til hensigt at) aktivt at forfølge en ændring i forretningsstrategi. Skema 13G indikerer en passiv investering på over 5%.
The share price as of April 24, 2026 is 10,10 / share. Previously, on April 28, 2025, the share price was 12,40 / share. This represents a decline of 18,55% over that period.
Fondens stemningsscore
Fund Sentiment Score (fka Ownership Accumulation Score) finder de aktier, der bliver mest købt af fonde. Det er resultatet af en sofistikeret, multi-faktor kvantitativ model, der identificerer virksomheder med de højeste niveauer af institutionel akkumulering. Scoringsmodellen bruger en kombination af den samlede stigning i oplyste ejere, ændringerne i porteføljeallokeringer i disse ejere og andre målinger. Tallet går fra 0 til 100, hvor højere tal indikerer et højere niveau af akkumulering for sine jævnaldrende, og 50 er gennemsnittet.
Opdateringsfrekvens: Dagligt
Se Ownership Explorer, som giver en liste over højest rangerende virksomheder.
AI+ Ask Fintel’s AI assistant about Orthofix Medical Inc..
Select a question to share a public post with an AI-crafted answer.
Thinking of good questions…
13F og NPORT arkivering
Detaljer om 13F-arkivering er gratis. Detaljer om NP-ansøgninger kræver et premium-medlemskab. Grønne rækker angiver nye positioner. Røde rækker angiver lukkede positioner. Klik på linket ikon for at se den fulde transaktionshistorik.
Opgrader
for at låse premium-data op og eksportere til Excel ![]() .
.
| Fil dato | Kilde | Investor | Type | Gennemsnitlig pris (Øst) |
Aktier | Δ Aktier (%) |
Rapporteret Værdi ($1000) |
Δ Værdi (%) |
Port Alloc (%) |
|
|---|---|---|---|---|---|---|---|---|---|---|
| 2026-02-12 | 13F | New York State Common Retirement Fund | 8.180 | 0,00 | 124 | 4,20 | ||||
| 2025-11-14 | 13F | Oxford Asset Management Llp | 0 | -100,00 | 0 | -100,00 | ||||
| 2026-04-23 | 13F | CWM Advisors, LLC | 45.009 | 46,35 | 516 | 10,73 | ||||
| 2026-02-17 | 13F | Susquehanna International Group, Llp | 0 | -100,00 | 0 | |||||
| 2025-11-14 | 13F | Schonfeld Strategic Advisors LLC | 0 | -100,00 | 0 | -100,00 | ||||
| 2026-02-20 | 13F | Sunbelt Securities, Inc. | 4 | 0 | ||||||
| 2025-11-14 | 13F | Petrus Trust Company, LTA | 0 | -100,00 | 0 | |||||
| 2026-02-12 | 13F | Great Lakes Advisors, Llc | 154.862 | -6,70 | 2.348 | -3,42 | ||||
| 2026-02-17 | 13F | Amundi | 41.527 | 2,69 | 630 | 9,77 | ||||
| 2025-11-14 | 13F | Cubist Systematic Strategies, LLC | 22.055 | 323 | ||||||
| 2026-02-12 | 13F | Principal Securities, Inc. | 0 | -100,00 | 0 | |||||
| 2026-02-17 | 13F | Canada Pension Plan Investment Board | 6.000 | 91 | ||||||
| 2026-02-13 | 13F | Kestra Advisory Services, LLC | 3.667 | 56 | ||||||
| 2026-02-17 | 13F | VARCOV Co. | 10.807 | 164 | ||||||
| 2026-02-18 | 13F | Mackenzie Financial Corp | 10.335 | 1,89 | 158 | 6,76 | ||||
| 2026-02-19 | 13F | Invesco Ltd. | 72.020 | -2,74 | 1.092 | 0,65 | ||||
| 2026-02-05 | 13F | Amalgamated Bank | 1.219 | -2,40 | 0 | |||||
| 2026-02-17 | 13F | Caption Management, LLC | Put | 0 | -100,00 | 0 | ||||
| 2026-02-17 | 13F | MIRAE ASSET GLOBAL ETFS HOLDINGS Ltd. | 18.014 | -0,79 | 273 | 3,02 | ||||
| 2026-02-11 | 13F | Franklin Resources Inc | 0 | -100,00 | 0 | |||||
| 2026-02-13 | 13F | MAI Capital Management | 31 | 0 | ||||||
| 2026-02-13 | 13F | Ubs Asset Management Americas Inc | 549 | 8 | ||||||
| 2026-02-17 | 13F | Citadel Advisors Llc | Put | 0 | -100,00 | 0 | ||||
| 2026-02-13 | 13F | Marshall Wace, Llp | 0 | -100,00 | 0 | |||||
| 2025-11-14 | 13F | AREX Capital Management, LP | 0 | -100,00 | 0 | |||||
| 2026-02-05 | 13F | Gamco Investors, Inc. Et Al | 171.800 | 0,00 | 2.604 | 3,54 | ||||
| 2026-02-05 | 13F | Gabelli Funds Llc | 235.303 | 0,43 | 3.567 | 3,99 | ||||
| 2026-02-09 | 13F | Quest Partners LLC | 73.084 | 70,65 | 1.108 | 76,84 | ||||
| 2026-02-11 | 13F | Los Angeles Capital Management Llc | 298 | 5 | ||||||
| 2026-02-13 | 13F | Barclays Plc | 85.227 | -37,09 | 1.292 | -34,85 | ||||
| 2026-02-17 | 13F | Optiver Holding B.V. | 322 | -35,86 | 5 | -42,86 | ||||
| 2026-02-10 | 13F | State of Wyoming | 13.256 | -10,21 | 201 | -7,41 | ||||
| 2026-02-17 | 13F | Engineers Gate Manager LP | 85.101 | 92,63 | 1.290 | 99,69 | ||||
| 2026-02-17 | 13F | California State Teachers Retirement System | 2.389 | -5,20 | 36 | 0,00 | ||||
| 2026-02-13 | 13F | Victory Capital Management Inc | 63.873 | 1,11 | 968 | 4,76 | ||||
| 2026-02-10 | 13F | Intech Investment Management Llc | 19.199 | 3,17 | 291 | 6,99 | ||||
| 2026-02-17 | 13F | Price T Rowe Associates Inc /md/ | 63.245 | 35,46 | 1 | |||||
| 2026-02-11 | 13F | Ameritas Investment Partners, Inc. | 3.494 | 53 | ||||||
| 2026-02-17 | 13F | Fmr Llc | 81.304 | 1,15 | 1.233 | 4,76 | ||||
| 2025-11-14 | 13F | Ameriprise Financial Inc | 0 | -100,00 | 0 | -100,00 | ||||
| 2026-04-20 | 13F | Assenagon Asset Management S.A. | 71.286 | 234,52 | 818 | 152,94 | ||||
| 2026-02-09 | 13F | Legal & General Group Plc | 3.533 | 0,00 | 54 | 3,92 | ||||
| 2026-02-17 | 13F | Royal Bank Of Canada | 1.670 | -99,12 | 25 | -99,10 | ||||
| 2026-02-17 | 13F | AYAL Capital Advisors Ltd | 742.372 | -10,55 | 11.254 | -7,37 | ||||
| 2026-02-17 | 13F | Philosophy Capital Management LLC | 1.015.194 | 14,89 | 15.390 | 18,97 | ||||
| 2026-02-17 | 13F | Public Employees Retirement System Of Ohio | 3.150 | 0,00 | 48 | 2,17 | ||||
| 2025-11-05 | 13F | Key FInancial Inc | 0 | -100,00 | 0 | |||||
| 2026-02-11 | 13F | Fox Run Management, L.l.c. | 12.084 | 183 | ||||||
| 2025-11-06 | 13F | Oppenheimer & Co Inc | 0 | -100,00 | 0 | -100,00 | ||||
| 2026-01-29 | 13F | Vanguard Group Inc | 2.304.928 | 0,98 | 34.943 | 4,56 | ||||
| 2026-01-29 | 13F | Comerica Bank | 0 | -100,00 | 0 | |||||
| 2026-03-06 | 13F | Hsbc Holdings Plc | 0 | -100,00 | 0 | |||||
| 2025-11-10 | 13F | Counterpoint Mutual Funds LLC | 0 | -100,00 | 0 | |||||
| 2026-02-13 | 13F | State Street Corp | 857.690 | -1,66 | 13.003 | 1,83 | ||||
| 2026-01-30 | 13F | Us Bancorp \de\ | 301 | 0,00 | 5 | 0,00 | ||||
| 2026-02-13 | 13F | Charles Schwab Investment Management Inc | 333.805 | -0,59 | 5.060 | 2,93 | ||||
| 2026-01-29 | 13F | UBS Group AG | 72.956 | -34,48 | 1.106 | -32,15 | ||||
| 2026-02-12 | 13F | Voya Investment Management Llc | 117.299 | -16,36 | 1.778 | -13,40 | ||||
| 2026-02-13 | 13F | Squarepoint Ops LLC | 12.908 | -84,86 | 196 | -84,37 | ||||
| 2026-02-17 | 13F | Balyasny Asset Management Llc | 15.725 | 238 | ||||||
| 2026-02-12 | 13F | Paradigm Capital Management Inc/ny | 3.304.899 | -1,18 | 50.102 | 2,33 | ||||
| 2026-02-11 | 13F | Jpmorgan Chase & Co | 237.273 | -8,05 | 3.597 | -4,77 | ||||
| 2026-02-17 | 13F | Caption Management, LLC | 0 | -100,00 | 0 | |||||
| 2026-02-12 | 13F | State Board Of Administration Of Florida Retirement System | 10.072 | 0,00 | 153 | 3,40 | ||||
| 2026-02-09 | 13F | Harbour Investments, Inc. | 0 | -100,00 | 0 | |||||
| 2025-11-13 | 13F | Dynamic Technology Lab Private Ltd | 0 | -100,00 | 0 | -100,00 | ||||
| 2026-02-09 | 13F | Frazier Financial Advisors, LLC | 100 | 0,00 | 2 | 0,00 | ||||
| 2025-11-05 | 13F | Bessemer Group Inc | 0 | -100,00 | 0 | |||||
| 2026-02-13 | 13F | Panagora Asset Management Inc | 61.192 | 27,19 | 928 | 31,68 | ||||
| 2026-02-12 | 13F | Integrated Quantitative Investments LLC | 0 | -100,00 | 0 | |||||
| 2026-01-28 | 13F | Turtle Creek Wealth Advisors, LLC | 35.135 | 0,00 | 533 | 3,50 | ||||
| 2025-10-30 | 13F | Covestor Ltd | 0 | -100,00 | 0 | |||||
| 2026-02-17 | 13F | Northern Trust Corp | 318.646 | -7,28 | 4.831 | -4,00 | ||||
| 2026-01-15 | 13F | Nisa Investment Advisors, Llc | 666 | 0,00 | 10 | 11,11 | ||||
| 2026-02-03 | 13F | SBI Securities Co., Ltd. | 0 | -100,00 | 0 | |||||
| 2025-11-10 | 13F | Empirical Financial Services, LLC d.b.a. Empirical Wealth Management | 0 | -100,00 | 0 | |||||
| 2026-02-10 | 13F | Acadian Asset Management Llc | 226.590 | 33,00 | 3 | 50,00 | ||||
| 2026-02-17 | 13F | Qube Research & Technologies Ltd | 0 | -100,00 | 0 | |||||
| 2026-04-23 | 13F | SJS Investment Consulting Inc. | 15 | 0 | ||||||
| 2026-02-13 | 13F | Rhumbline Advisers | 56.954 | -14,81 | 863 | -11,76 | ||||
| 2026-04-15 | 13F | Gradient Capital Advisors, LLC | 10.004 | -33,32 | 115 | -49,78 | ||||
| 2026-02-13 | 13F | Wells Fargo & Company/mn | 43.724 | 45,90 | 663 | 51,14 | ||||
| 2026-02-17 | 13F | Juniper Investment Company, LLC | 3.510.333 | 23,30 | 53.217 | 27,68 | ||||
| 2026-02-13 | 13F | Rubric Capital Management LP | 3.721.715 | 0,00 | 56.421 | 3,55 | ||||
| 2025-11-14 | 13F | Soleus Capital Management, L.P. | 0 | -100,00 | 0 | -100,00 | ||||
| 2026-02-04 | 13F | Versor Investments LP | 24.100 | -30,55 | 365 | -28,15 | ||||
| 2026-02-05 | 13F | Tejara Capital Ltd | 21.820 | 0,00 | 331 | 3,45 | ||||
| 2026-02-06 | 13F | Bastion Asset Management Inc. | 0 | -100,00 | 0 | |||||
| 2026-02-17 | 13F | Brevan Howard Capital Management LP | 27.435 | 416 | ||||||
| 2026-02-17 | 13F | Susquehanna Portfolio Strategies, LLC | 45.328 | -26,38 | 687 | -23,75 | ||||
| 2026-02-13 | 13F | Y-Intercept (Hong Kong) Ltd | 26.534 | 402 | ||||||
| 2026-02-17 | 13F | Magnetar Financial LLC | 25.792 | 391 | ||||||
| 2026-04-06 | 13F | Versant Capital Management, Inc | 1.838 | 339,71 | 21 | 250,00 | ||||
| 2026-02-13 | 13F | Manufacturers Life Insurance Company, The | 0 | -100,00 | 0 | |||||
| 2025-11-14 | 13F | Occudo Quantitative Strategies Lp | 0 | -100,00 | 0 | -100,00 | ||||
| 2026-02-13 | 13F | SRS Capital Advisors, Inc. | 8 | -96,51 | 0 | -100,00 | ||||
| 2026-02-13 | 13F | Caitong International Asset Management Co., Ltd | 0 | -100,00 | 0 | |||||
| 2026-04-17 | 13F | Kirr Marbach & Co Llc /in/ | 39.462 | 0,00 | 453 | -24,41 | ||||
| 2025-11-14 | 13F | Graham Capital Management, L.P. | 0 | -100,00 | 0 | |||||
| 2026-02-17 | 13F | Aqr Capital Management Llc | 86.708 | 158,34 | 1.314 | 167,62 | ||||
| 2026-02-17 | 13F | Millennium Management Llc | 1.441.267 | -2,33 | 21.850 | 1,13 | ||||
| 2026-02-06 | 13F | Global Retirement Partners, LLC | 645 | 0,00 | 10 | 0,00 | ||||
| 2025-11-13 | 13F | Connor, Clark & Lunn Investment Management Ltd. | 0 | -100,00 | 0 | |||||
| 2025-11-14 | 13F | Polymer Capital Management (US) LLC | 0 | -100,00 | 0 | -100,00 | ||||
| 2026-04-22 | 13F | Sterling Capital Management LLC | 1.318 | -42,24 | 15 | -55,88 | ||||
| 2026-02-13 | 13F | Walleye Capital LLC | 18.135 | 275 | ||||||
| 2026-02-13 | 13F | Boston Partners | 30.856 | -10,98 | 468 | -7,89 | ||||
| 2026-02-17 | 13F | D. E. Shaw & Co., Inc. | 10.550 | -39,65 | 160 | -37,65 | ||||
| 2026-02-05 | 13F | HighMark Wealth Management LLC | 4.405 | 0,00 | 67 | 3,13 | ||||
| 2025-11-14 | 13F | Point72 (DIFC) Ltd | 154 | 2 | ||||||
| 2026-02-17 | 13F | Aquatic Capital Management LLC | 10.982 | -12,06 | 166 | -8,79 | ||||
| 2025-11-14 | 13F | Skopos Labs, Inc. | 0 | -100,00 | 0 | |||||
| 2026-02-17 | 13F | Citadel Advisors Llc | 19.545 | 296 | ||||||
| 2026-02-12 | 13F | Jane Street Group, Llc | 111.622 | -46,86 | 1.692 | -44,98 | ||||
| 2026-02-17 | 13F | Raymond James Financial Inc | 0 | -100,00 | 0 | |||||
| 2026-02-17 | 13F | Engine Capital Management, LP | 4.252.921 | 0,00 | 64.474 | 3,55 | ||||
| 2026-02-09 | 13F | Emerald Mutual Fund Advisers Trust | 0 | -100,00 | 0 | |||||
| 2026-02-17 | 13F/A | RBF Capital, LLC | 30.000 | 0,00 | 455 | 3,42 | ||||
| 2025-10-30 | 13F | Teacher Retirement System Of Texas | 0 | -100,00 | 0 | |||||
| 2026-02-17 | 13F | Point72 Asset Management, L.P. | 88.216 | 1.337 | ||||||
| 2026-02-10 | 13F | Rothschild Investment Llc | 189 | 11,18 | 3 | 0,00 | ||||
| 2026-04-13 | 13F | True Wealth Design, LLC | 83 | 69,39 | 1 | |||||
| 2026-02-17 | 13F | Advisory Services Network, LLC | 0 | -100,00 | 0 | |||||
| 2026-04-14 | 13F | Thurston, Springer, Miller, Herd & Titak, Inc. | 300 | 3 | ||||||
| 2026-02-06 | 13F | Pnc Financial Services Group, Inc. | 1.081 | 2,17 | 16 | 6,67 | ||||
| 2026-02-12 | 13F | MetLife Investment Management, LLC | 21.248 | -6,24 | 322 | -2,72 | ||||
| 2026-02-05 | 13F | Allworth Financial LP | 235 | 1.019,05 | 4 | |||||
| 2025-11-10 | 13F | Hillsdale Investment Management Inc. | 0 | -100,00 | 0 | |||||
| 2025-11-14 | 13F | Verition Fund Management LLC | 0 | -100,00 | 0 | |||||
| 2026-01-26 | 13F | Cwm, Llc | 4.538 | 136,35 | 0 | |||||
| 2026-02-17 | 13F | Creative Planning | 12.726 | 8,17 | 193 | 11,63 | ||||
| 2026-02-13 | 13F | Citigroup Inc | 20.428 | -49,69 | 310 | -47,98 | ||||
| 2026-02-12 | 13F | Renaissance Technologies Llc | 81.391 | -15,30 | 1.234 | -12,30 | ||||
| 2026-02-12 | 13F | Federation des caisses Desjardins du Quebec | 123 | 0,00 | 2 | 0,00 | ||||
| 2026-02-17 | 13F | Tudor Investment Corp Et Al | 202.606 | -6,65 | 3.072 | -3,34 | ||||
| 2025-11-14 | 13F | Janus Henderson Group Plc | 0 | -100,00 | 0 | |||||
| 2025-11-12 | 13F | Transce3nd, LLC | 0 | -100,00 | 0 | |||||
| 2026-02-12 | 13F | BlackRock, Inc. | 3.139.838 | 0,07 | 47.600 | 3,62 | ||||
| 2026-02-13 | 13F | Morgan Stanley | 224.643 | 30,30 | 3.406 | 34,90 | ||||
| 2025-11-17 | 13F | Great West Life Assurance Co /can/ | 0 | -100,00 | 0 | |||||
| 2026-02-13 | 13F | Arrowstreet Capital, Limited Partnership | 256.094 | -17,56 | 3.882 | -14,63 | ||||
| 2026-02-13 | 13F | Parkside Financial Bank & Trust | 45 | 0,00 | 1 | |||||
| 2026-02-11 | 13F | Zions Bancorporation, National Association /ut/ | 81 | 1 | ||||||
| 2026-02-10 | 13F | Bnp Paribas Arbitrage, Sa | 98.284 | 12,89 | 1.490 | 16,88 | ||||
| 2026-02-17 | 13F | Tower Research Capital LLC (TRC) | 3.104 | -40,62 | 47 | -38,16 | ||||
| 2026-02-10 | 13F | Quantbot Technologies LP | 9.365 | 142 | ||||||
| 2026-02-13 | 13F | Pinnacle Wealth Planning Services, Inc. | 779 | 12 | ||||||
| 2026-02-17 | 13F | Atom Investors LP | 0 | -100,00 | 0 | |||||
| 2026-02-17 | 13F | HighVista Strategies LLC | 85.049 | -8,75 | 1.289 | -5,50 | ||||
| 2026-04-07 | 13F | Farther Finance Advisors, LLC | 106 | -11,67 | 1 | 0,00 | ||||
| 2026-01-29 | 13F | Global Strategic Investment Solutions, LLC | 0 | -100,00 | 0 | |||||
| 2026-02-09 | 13F | Emerald Advisers, Llc | 101 | 0,00 | 2 | 0,00 | ||||
| 2025-11-14 | 13F | Lazard Asset Management Llc | 0 | -100,00 | 0 | |||||
| 2026-02-13 | 13F | American Century Companies Inc | 101.879 | -11,65 | 1.544 | -8,53 | ||||
| 2026-04-07 | 13F | Signaturefd, Llc | 719 | 8 | ||||||
| 2026-04-24 | 13F | Strs Ohio | 20.400 | 121,74 | 234 | 67,63 | ||||
| 2026-04-06 | 13F | GAMMA Investing LLC | 1.322 | 54,98 | 15 | 25,00 | ||||
| 2026-01-30 | 13F | R Squared Ltd | 12.614 | 191 | ||||||
| 2026-02-11 | 13F | Deutsche Bank Ag\ | 78.962 | 1,90 | 1.197 | 5,56 | ||||
| 2026-02-10 | 13F | Goldman Sachs Group Inc | 211.419 | -25,79 | 3.205 | -23,14 | ||||
| 2026-02-09 | 13F | Hantz Financial Services, Inc. | 129 | 0,00 | 0 | |||||
| 2026-02-13 | 13F | Police & Firemen's Retirement System of New Jersey | 10.658 | 0,00 | 162 | 3,21 | ||||
| 2026-02-17 | 13F | Bank Of America Corp /de/ | 261.386 | -11,77 | 3.963 | -8,65 | ||||
| 2026-02-06 | 13F | EverSource Wealth Advisors, LLC | 1.075 | -10,57 | 16 | -5,88 | ||||
| 2025-11-10 | 13F | Axq Capital, Lp | 0 | -100,00 | 0 | -100,00 | ||||
| 2025-11-14 | 13F | Centiva Capital, LP | 0 | -100,00 | 0 | -100,00 | ||||
| 2026-02-09 | 13F | Hartland & Co., LLC | 0 | -100,00 | 0 | |||||
| 2026-02-12 | 13F | Advisors Asset Management, Inc. | 354 | -0,84 | 5 | 0,00 | ||||
| 2026-02-13 | 13F | Jacobs Levy Equity Management, Inc | 144.507 | -0,59 | 2.191 | 2,91 | ||||
| 2026-04-16 | 13F | Diversified Trust Co | 10.483 | 0,00 | 120 | -24,05 | ||||
| 2025-11-07 | 13F | Shell Asset Management Co | 1.259 | -92,10 | 0 | |||||
| 2025-11-14 | 13F | Clough Capital Partners L P | 0 | -100,00 | 0 | |||||
| 2026-01-21 | 13F | Palumbo Wealth Management LLC | 42.910 | -0,10 | 651 | 3,50 | ||||
| 2026-04-20 | 13F/A | OP Asset Management Ltd | 0 | -100,00 | 0 | -100,00 | ||||
| 2026-02-03 | 13F | F/M Investments LLC | 0 | -100,00 | 0 | |||||
| 2026-04-13 | 13F | Massmutual Trust Co Fsb/adv | 641 | -7,50 | 7 | -30,00 | ||||
| 2026-02-17 | 13F | Armistice Capital, Llc | 2.648.000 | 18,43 | 40.144 | 22,63 | ||||
| 2026-02-17 | 13F | Russell Investments Group, Ltd. | 197.930 | 4,32 | 3.001 | 8,03 | ||||
| 2026-02-10 | 13F | Monaco Asset Management SAM | 0 | -100,00 | 0 | |||||
| 2026-02-12 | 13F | Quadrant Capital Group Llc | 181 | 0,00 | 3 | 0,00 | ||||
| 2026-01-07 | 13F | Aventura Private Wealth, LLC | 3 | 0,00 | 0 | |||||
| 2026-02-11 | 13F | Simplex Trading, Llc | 5.143 | -6,52 | 78 | |||||
| 2026-04-20 | 13F | State of Alaska, Department of Revenue | 2.102 | 0,00 | 0 | |||||
| 2026-02-12 | 13F | Dimensional Fund Advisors Lp | 949.087 | -16,93 | 14.389 | -13,97 | ||||
| 2025-11-07 | 13F | BNP Paribas Asset Management Holding S.A. | 0 | -100,00 | 0 | |||||
| 2026-02-10 | 13F | Bank of New York Mellon Corp | 113.796 | -2,05 | 1.725 | 1,47 | ||||
| 2026-02-17 | 13F | Advisor Group Holdings, Inc. | 2.567 | -65,17 | 39 | -65,45 | ||||
| 2026-02-17 | 13F | Alliancebernstein L.p. | 45.549 | 0,00 | 691 | 3,60 | ||||
| 2026-02-17 | 13F | Quantinno Capital Management LP | 17.884 | 14,80 | 271 | 18,86 | ||||
| 2026-02-12 | 13F | Nuveen, LLC | 332.042 | -37,97 | 5.034 | -35,77 | ||||
| 2026-02-13 | 13F | Prudential Financial Inc | 11.001 | -34,91 | 167 | -32,79 | ||||
| 2026-02-17 | 13F | Trexquant Investment LP | 136.469 | 216,76 | 2.069 | 228,25 | ||||
| 2026-02-13 | 13F | National Bank Of Canada /fi/ | 15.000 | 227 | ||||||
| 2026-04-13 | 13F | IFP Advisors, Inc | 49 | 4,26 | 1 | |||||
| 2025-11-14 | 13F | Algert Global Llc | 0 | -100,00 | 0 | |||||
| 2026-01-30 | 13F | Torren Management, LLC | 24 | 0 | ||||||
| 2026-01-27 | 13F | Zurcher Kantonalbank (Zurich Cantonalbank) | 1 | 0,00 | 0 | |||||
| 2026-02-12 | 13F | Commonwealth Equity Services, Llc | 0 | -100,00 | 0 | |||||
| 2026-02-06 | 13F | Gsa Capital Partners Llp | 17.136 | 0 | ||||||
| 2026-02-05 | 13F | Teton Advisors, LLC | 17.500 | -5,41 | 265 | -1,85 | ||||
| 2026-02-09 | 13F | Geode Capital Management, Llc | 947.189 | 0,62 | 14.362 | 4,20 | ||||
| 2025-11-13 | 13F | Swiss National Bank | 0 | -100,00 | 0 |
Other Listings
| US:OFIX | 12,35 $ |