Grundlæggende statistik
| Institutionelle aktier (lange) | 31.602.976 - 62,97% (ex 13D/G) - change of -4,07MM shares -11,41% MRQ |
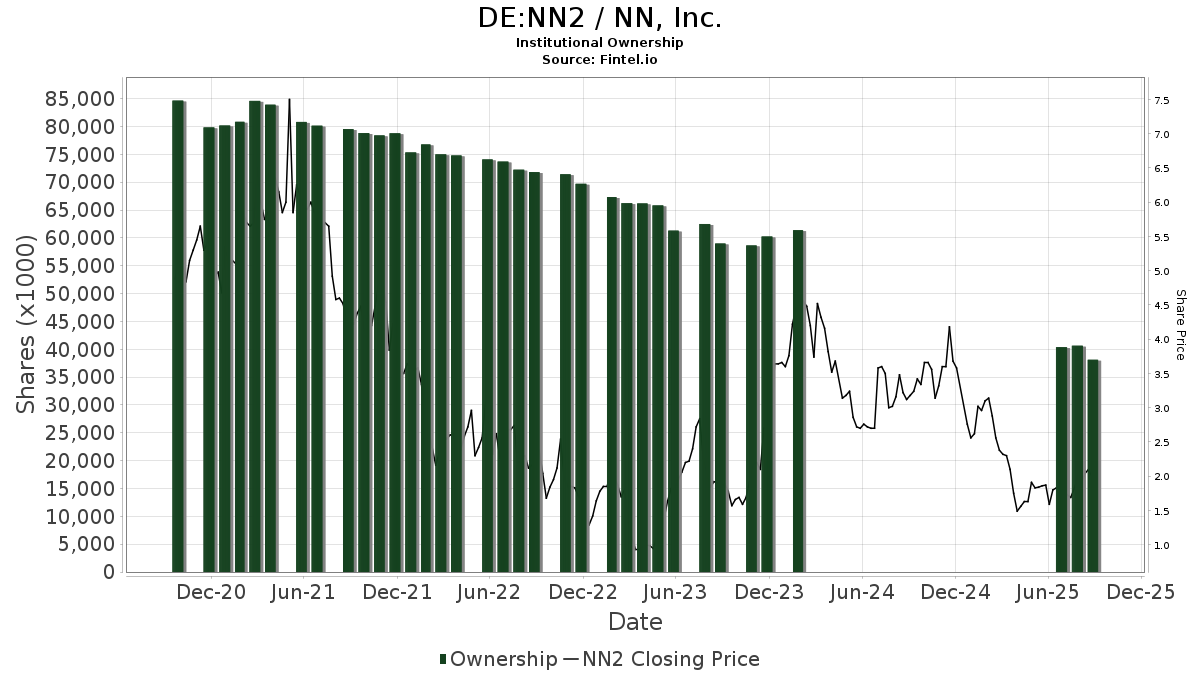
| Institutionel værdi (lang) | $ 40.095 USD ($1000) |
Institutionelt ejerskab og aktionærer
NN, Inc. (DE:NN2) har 67 institutionelle ejere og aktionærer, der har indsendt 13D/G- eller 13F-formularer til Securities Exchange Commission (SEC). Disse institutioner har i alt 31,602,976 aktier. Største aktionærer omfatter Corre Partners Management, LLC, Legion Partners Asset Management, LLC, Nomura Holdings Inc, First Manhattan Co, Nantahala Capital Management, LLC, Vanguard Group Inc, Morgan Stanley, Register Financial Advisors LLC, BlackRock, Inc., and Geode Capital Management, Llc .
NN, Inc. (DB:NN2) institutionel ejerskabsstruktur viser aktuelle positioner i virksomheden efter institutioner og fonde, samt seneste ændringer i positionsstørrelse. Større aktionærer kan omfatte individuelle investorer, investeringsforeninger, hedgefonde eller institutioner. Skema 13D angiver, at investoren besidder (eller besidder) mere end 5 % af virksomheden og har til hensigt (eller har til hensigt at) aktivt at forfølge en ændring i forretningsstrategi. Skema 13G indikerer en passiv investering på over 5%.
The share price as of April 24, 2026 is 2,18 / share. Previously, on April 28, 2025, the share price was 1,62 / share. This represents an increase of 34,57% over that period.
Fondens stemningsscore
Fund Sentiment Score (fka Ownership Accumulation Score) finder de aktier, der bliver mest købt af fonde. Det er resultatet af en sofistikeret, multi-faktor kvantitativ model, der identificerer virksomheder med de højeste niveauer af institutionel akkumulering. Scoringsmodellen bruger en kombination af den samlede stigning i oplyste ejere, ændringerne i porteføljeallokeringer i disse ejere og andre målinger. Tallet går fra 0 til 100, hvor højere tal indikerer et højere niveau af akkumulering for sine jævnaldrende, og 50 er gennemsnittet.
Opdateringsfrekvens: Dagligt
Se Ownership Explorer, som giver en liste over højest rangerende virksomheder.
AI+ Ask Fintel’s AI assistant about NN, Inc..
Select a question to share a public post with an AI-crafted answer.
Thinking of good questions…
13F og NPORT arkivering
Detaljer om 13F-arkivering er gratis. Detaljer om NP-ansøgninger kræver et premium-medlemskab. Grønne rækker angiver nye positioner. Røde rækker angiver lukkede positioner. Klik på linket ikon for at se den fulde transaktionshistorik.
Opgrader
for at låse premium-data op og eksportere til Excel ![]() .
.
| Fil dato | Kilde | Investor | Type | Gennemsnitlig pris (Øst) |
Aktier | Δ Aktier (%) |
Rapporteret Værdi ($1000) |
Δ Værdi (%) |
Port Alloc (%) |
|
|---|---|---|---|---|---|---|---|---|---|---|
| 2026-02-12 | 13F | Paradigm Capital Management Inc/ny | 200.000 | -93,00 | 256 | -95,65 | ||||
| 2026-02-19 | 13F | CI Private Wealth, LLC | 72.000 | 0,00 | 92 | -37,84 | ||||
| 2026-01-26 | 13F | Cwm, Llc | 12 | -53,85 | 0 | |||||
| 2026-04-15 | 13F | Register Financial Advisors LLC | 1.311.363 | 7,37 | 1.901 | 21,63 | ||||
| 2026-02-19 | 13F | Invesco Ltd. | 46.784 | 9,03 | 60 | -32,95 | ||||
| 2025-11-12 | 13F | Catalyst Funds Management Pty Ltd | 0 | -100,00 | 0 | |||||
| 2026-02-17 | 13F | XTX Topco Ltd | 73.920 | 29,26 | 95 | -19,66 | ||||
| 2026-02-13 | 13F | Wynnefield Capital Inc | 28.128 | 0,00 | 36 | -36,84 | ||||
| 2026-02-17 | 13F | Optiver Holding B.V. | 687 | 0,15 | 1 | -100,00 | ||||
| 2026-02-13 | 13F | Centiva Capital, LP | 33.399 | 43 | ||||||
| 2025-11-14 | 13F | Cubist Systematic Strategies, LLC | 4.547 | 231,66 | 9 | 350,00 | ||||
| 2026-02-09 | 13F | Hartland & Co., LLC | 100.000 | 0,00 | 128 | -37,86 | ||||
| 2026-02-12 | 13F | Jane Street Group, Llc | 256.091 | 157,74 | 328 | 60,29 | ||||
| 2026-02-11 | 13F | Simplex Trading, Llc | 1.364 | -64,45 | 2 | |||||
| 2026-02-17 | 13F | Ancora Advisors, LLC | 0 | -100,00 | 0 | |||||
| 2026-01-15 | 13F | Nisa Investment Advisors, Llc | 0 | -100,00 | 0 | |||||
| 2026-02-03 | 13F | SBI Securities Co., Ltd. | 33 | 0,00 | 0 | |||||
| 2026-04-21 | 13F | Laurel Oak Wealth Management, Llc | 50.000 | 72 | ||||||
| 2025-11-14 | 13F | Point72 Asia (Singapore) Pte. Ltd. | 18.657 | -50,00 | 38 | -51,28 | ||||
| 2026-02-17 | 13F | Russell Investments Group, Ltd. | 1 | 0 | ||||||
| 2025-11-14 | 13F | Jain Global LLC | 0 | -100,00 | 0 | |||||
| 2026-02-13 | 13F | Motiv8 Investments LLC | 1.667 | 0 | ||||||
| 2026-02-17 | 13F | Susquehanna International Group, Llp | 102.278 | 32,28 | 131 | -18,24 | ||||
| 2026-02-17 | 13F | Legion Partners Asset Management, LLC | 4.791.929 | 0,00 | 6.134 | -37,87 | ||||
| 2026-02-17 | 13F | Northern Trust Corp | 86.237 | -7,52 | 110 | -42,71 | ||||
| 2026-01-29 | 13F | UBS Group AG | 92.513 | -66,92 | 118 | -79,51 | ||||
| 2025-11-14 | 13F | Citadel Advisors Llc | Put | 0 | -100,00 | 0 | -100,00 | |||
| 2026-02-12 | 13F | BlackRock, Inc. | 736.050 | -0,18 | 942 | -37,99 | ||||
| 2026-02-13 | 13F | SRS Capital Advisors, Inc. | 0 | -100,00 | 0 | |||||
| 2026-02-13 | 13F | Nierenberg Investment Management Company, Inc. | 13.555 | 0,00 | 17 | -37,04 | ||||
| 2026-02-17 | 13F | Citadel Advisors Llc | Call | 0 | -100,00 | 0 | ||||
| 2026-02-17 | 13F | Captrust Financial Advisors | 70.012 | 90 | ||||||
| 2026-02-17 | 13F | Price T Rowe Associates Inc /md/ | 63.163 | 0,00 | 0 | |||||
| 2026-02-17 | 13F/A | RBF Capital, LLC | 485.984 | 0,00 | 622 | -37,86 | ||||
| 2026-02-13 | 13F | Landscape Capital Management, L.l.c. | 179.677 | 230 | ||||||
| 2026-02-11 | 13F | Jpmorgan Chase & Co | 2.524 | -1,48 | 3 | -40,00 | ||||
| 2026-02-13 | 13F | Squarepoint Ops LLC | 244.041 | 469,94 | 312 | 254,55 | ||||
| 2026-02-17 | 13F | Tower Research Capital LLC (TRC) | 4.697 | 182,61 | 6 | 100,00 | ||||
| 2026-02-06 | 13F | Covestor Ltd | 4.366 | 0,00 | 0 | |||||
| 2025-11-13 | 13F | Hsbc Holdings Plc | 0 | -100,00 | 0 | -100,00 | ||||
| 2026-02-17 | 13F | Two Sigma Advisers, Lp | 10.500 | -31,37 | 13 | -58,06 | ||||
| 2026-04-03 | 13F | Investors Research Corp | 0 | -100,00 | 0 | |||||
| 2026-02-17 | 13F | Bridgeway Capital Management Inc | 169.962 | -4,06 | 218 | -40,38 | ||||
| 2026-02-12 | 13F | Dimensional Fund Advisors Lp | 587.147 | -24,95 | 751 | -53,38 | ||||
| 2026-02-13 | 13F | Nantahala Capital Management, LLC | 2.441.416 | 0,00 | 3.125 | -37,86 | ||||
| 2026-02-05 | 13F | Gabelli Funds Llc | 61.000 | 0,00 | 78 | -37,60 | ||||
| 2025-11-14 | 13F | Raymond James Financial Inc | 0 | -100,00 | 0 | |||||
| 2025-11-17 | 13F | Jacobs Levy Equity Management, Inc | 0 | -100,00 | 0 | -100,00 | ||||
| 2026-02-10 | 13F | NINE MASTS CAPITAL Ltd | 22.422 | 29 | ||||||
| 2026-02-17 | 13F | Two Sigma Investments, Lp | 0 | -100,00 | 0 | |||||
| 2026-02-17 | 13F | Fmr Llc | 0 | -100,00 | 0 | -100,00 | ||||
| 2026-02-04 | 13F | Pacific Ridge Capital Partners, LLC | 400.334 | -6,19 | 512 | -41,75 | ||||
| 2026-02-17 | 13F | Nomura Holdings Inc | 3.004.832 | 1,19 | 3.846 | -37,13 | ||||
| 2026-02-13 | 13F | Morgan Stanley | 1.537.171 | -2,50 | 1.968 | -39,42 | ||||
| 2025-11-14 | 13F | DRW Securities, LLC | 0 | -100,00 | 0 | -100,00 | ||||
| 2026-02-11 | 13F | Simplex Trading, Llc | Call | 0 | -100,00 | 0 | ||||
| 2026-02-11 | 13F | Group One Trading, L.p. | Call | 0 | -100,00 | 0 | ||||
| 2026-02-17 | 13F | Point72 Asset Management, L.P. | 29.037 | 37 | ||||||
| 2026-02-14 | 13F | Rockefeller Capital Management L.P. | 100 | 0,00 | 0 | |||||
| 2026-02-13 | 13F | Quinn Opportunity Partners LLC | 25.000 | 32 | ||||||
| 2026-02-17 | 13F | Bank Of America Corp /de/ | 32.079 | -50,75 | 41 | -69,40 | ||||
| 2025-11-13 | 13F | Wells Fargo & Company/mn | 0 | -100,00 | 0 | |||||
| 2026-02-17 | 13F | Citadel Advisors Llc | 310.954 | 165,05 | 398 | 65,15 | ||||
| 2025-10-31 | 13F | Y-Intercept (Hong Kong) Ltd | 0 | -100,00 | 0 | |||||
| 2026-02-17 | 13F | Royal Bank Of Canada | 372 | -99,43 | 0 | -100,00 | ||||
| 2026-02-09 | 13F | Geode Capital Management, Llc | 620.060 | 10,56 | 794 | -31,34 | ||||
| 2025-11-13 | 13F | Hudson Bay Capital Management LP | 0 | -100,00 | 0 | |||||
| 2025-11-12 | 13F | Aster Capital Management (DIFC) Ltd | 0 | -100,00 | 0 | |||||
| 2026-02-23 | 13F | Virtu Financial LLC | 23.425 | 0 | ||||||
| 2026-02-13 | 13F | State Street Corp | 198.709 | 0,00 | 254 | -37,90 | ||||
| 2025-11-14 | 13F | Point72 (DIFC) Ltd | 387 | -86,58 | 1 | -100,00 | ||||
| 2026-02-17 | 13F | Quadrature Capital Ltd | 60.475 | 77 | ||||||
| 2026-02-06 | 13F | Addison Advisors LLC | 10.822 | 0,00 | 14 | -40,91 | ||||
| 2026-02-13 | 13F | Barclays Plc | 0 | -100,00 | 0 | |||||
| 2026-02-17 | 13F | Qube Research & Technologies Ltd | 16.939 | -70,68 | 22 | -82,35 | ||||
| 2026-02-04 | 13F | Ameritas Advisory Services, LLC | 0 | -100,00 | 0 | |||||
| 2026-02-06 | 13F | Gsa Capital Partners Llp | 342.450 | 33,89 | 0 | |||||
| 2026-02-12 | 13F | Bank Of Montreal /can/ | 50.000 | 0,00 | 64 | -37,86 | ||||
| 2026-02-17 | 13F | Millennium Management Llc | 48.859 | -80,11 | 63 | -87,75 | ||||
| 2026-02-13 | 13F | Corre Partners Management, LLC | 6.205.631 | 0,00 | 7.943 | -37,86 | ||||
| 2026-02-13 | 13F | American Century Companies Inc | 0 | -100,00 | 0 | |||||
| 2026-02-13 | 13F | Charles Schwab Investment Management Inc | 28.401 | 0,00 | 36 | -37,93 | ||||
| 2026-01-29 | 13F | Vanguard Group Inc | 2.202.313 | 0,92 | 2.819 | -37,31 | ||||
| 2026-02-13 | 13F | Marshall Wace, Llp | 0 | -100,00 | 0 | |||||
| 2026-04-23 | 13F | J.w. Cole Advisors, Inc. | 0 | -100,00 | 0 | |||||
| 2026-02-11 | 13F | Empowered Funds, LLC | 104.459 | 0,00 | 134 | -38,14 | ||||
| 2026-02-10 | 13F | Bnp Paribas Arbitrage, Sa | 75 | 0,00 | 0 | |||||
| 2026-02-10 | 13F | Goldman Sachs Group Inc | 180.749 | 39,01 | 231 | -13,48 | ||||
| 2026-02-12 | 13F | Renaissance Technologies Llc | 367.500 | 290,96 | 470 | 143,52 | ||||
| 2026-02-13 | 13F | De Lisle Partners LLP | 410.228 | 0,00 | 525 | -38,31 | ||||
| 2026-02-17 | 13F | First Manhattan Co | 3.003.800 | 8,25 | 3.845 | -32,75 | ||||
| 2026-02-10 | 13F | Acadian Asset Management Llc | 19.689 | 0 | ||||||
| 2026-02-13 | 13F | Citigroup Inc | 0 | -100,00 | 0 |
Other Listings
| US:NNBR | 2,49 $ |