Grundlæggende statistik
| Institutionelle aktier (lange) | 14.253.160 - 14,88% (ex 13D/G) - change of 1,65MM shares 13,06% MRQ |
| Institutionel værdi (lang) | $ 5.386 USD ($1000) |
Institutionelt ejerskab og aktionærer
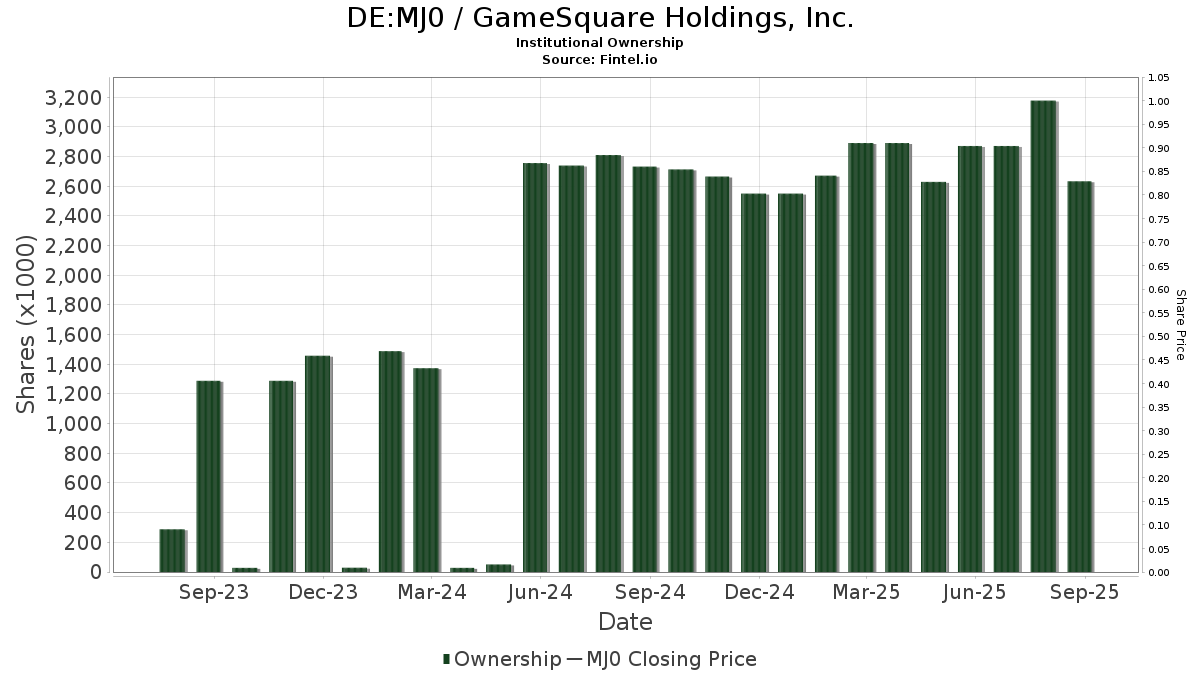
GameSquare Holdings, Inc. (DE:MJ0) har 45 institutionelle ejere og aktionærer, der har indsendt 13D/G- eller 13F-formularer til Securities Exchange Commission (SEC). Disse institutioner har i alt 14,253,160 aktier. Største aktionærer omfatter Vanguard Group Inc, UBS Group AG, Polar Asset Management Partners Inc., BlackRock, Inc., Geode Capital Management, Llc, Citadel Advisors Llc, Renaissance Technologies Llc, State Street Corp, Jane Street Group, Llc, and Northern Trust Corp .
GameSquare Holdings, Inc. (DB:MJ0) institutionel ejerskabsstruktur viser aktuelle positioner i virksomheden efter institutioner og fonde, samt seneste ændringer i positionsstørrelse. Større aktionærer kan omfatte individuelle investorer, investeringsforeninger, hedgefonde eller institutioner. Skema 13D angiver, at investoren besidder (eller besidder) mere end 5 % af virksomheden og har til hensigt (eller har til hensigt at) aktivt at forfølge en ændring i forretningsstrategi. Skema 13G indikerer en passiv investering på over 5%.
Fondens stemningsscore
Fund Sentiment Score (fka Ownership Accumulation Score) finder de aktier, der bliver mest købt af fonde. Det er resultatet af en sofistikeret, multi-faktor kvantitativ model, der identificerer virksomheder med de højeste niveauer af institutionel akkumulering. Scoringsmodellen bruger en kombination af den samlede stigning i oplyste ejere, ændringerne i porteføljeallokeringer i disse ejere og andre målinger. Tallet går fra 0 til 100, hvor højere tal indikerer et højere niveau af akkumulering for sine jævnaldrende, og 50 er gennemsnittet.
Opdateringsfrekvens: Dagligt
Se Ownership Explorer, som giver en liste over højest rangerende virksomheder.
AI+ Ask Fintel’s AI assistant about GameSquare Holdings, Inc..
Select a question to share a public post with an AI-crafted answer.
Thinking of good questions…
13F og NPORT arkivering
Detaljer om 13F-arkivering er gratis. Detaljer om NP-ansøgninger kræver et premium-medlemskab. Grønne rækker angiver nye positioner. Røde rækker angiver lukkede positioner. Klik på linket ikon for at se den fulde transaktionshistorik.
Opgrader
for at låse premium-data op og eksportere til Excel ![]() .
.
| Fil dato | Kilde | Investor | Type | Gennemsnitlig pris (Øst) |
Aktier | Δ Aktier (%) |
Rapporteret Værdi ($1000) |
Δ Værdi (%) |
Port Alloc (%) |
|
|---|---|---|---|---|---|---|---|---|---|---|
| 2026-01-07 | 13F | Aventura Private Wealth, LLC | 13 | 0,00 | 0 | |||||
| 2026-02-03 | 13F | B. Riley Financial, Inc. | 0 | -100,00 | 0 | -100,00 | ||||
| 2026-02-12 | 13F | Jane Street Group, Llc | 397.383 | 153 | ||||||
| 2026-02-23 | 13F | Virtu Financial LLC | 200.255 | 167,62 | 0 | |||||
| 2026-02-11 | 13F | T3 Companies, LLC | 28.000 | 11 | ||||||
| 2026-02-12 | 13F | StoneX Group Inc. | 20.000 | 8 | ||||||
| 2026-02-17 | 13F | Mercer Global Advisors Inc /adv | 0 | -100,00 | 0 | -100,00 | ||||
| 2026-02-11 | 13F | LPL Financial LLC | 10.649 | 0,00 | 4 | -42,86 | ||||
| 2026-02-17 | 13F | Two Sigma Securities, Llc | 0 | -100,00 | 0 | -100,00 | ||||
| 2026-01-12 | 13F | Thompson Davis & Co., Inc. | 0 | -100,00 | 0 | -100,00 | ||||
| 2026-02-06 | 13F | EverSource Wealth Advisors, LLC | 2.265 | 0,00 | 1 | -100,00 | ||||
| 2025-11-14 | 13F | Millennium Management Llc | 0 | -100,00 | 0 | -100,00 | ||||
| 2026-02-17 | 13F | B Group, Inc. | 0 | -100,00 | 0 | -100,00 | ||||
| 2026-02-17 | 13F | Royal Bank Of Canada | 3.499 | 725,24 | 1 | |||||
| 2026-02-27 | 13F/A | Barclays Plc | 0 | -100,00 | 0 | |||||
| 2026-04-13 | 13F | Mkd Wealth Coaches, Llc | 12.000 | 0,00 | 3 | -25,00 | ||||
| 2026-04-15 | 13F | FNY Investment Advisers, LLC | 15.000 | 0,00 | 0 | |||||
| 2026-02-05 | 13F | Allworth Financial LP | 0 | -100,00 | 0 | |||||
| 2026-02-12 | 13F | Wealthspire Advisors, LLC | 181.601 | 0,00 | 70 | -43,90 | ||||
| 2026-01-26 | 13F | Cwm, Llc | 200 | 0 | ||||||
| 2026-04-15 | 13F | Fortitude Family Office, LLC | 0 | -100,00 | 0 | |||||
| 2026-02-17 | 13F | Northern Trust Corp | 206.774 | 1,69 | 80 | -42,75 | ||||
| 2026-02-17 | 13F | Polar Asset Management Partners Inc. | 2.000.000 | 0,00 | 770 | -43,26 | ||||
| 2025-11-14 | 13F | Tower Research Capital LLC (TRC) | 0 | -100,00 | 0 | |||||
| 2026-02-17 | 13F | Boothbay Fund Management, Llc | 70.149 | 18,63 | 27 | -32,50 | ||||
| 2026-02-11 | 13F | Group One Trading, L.p. | 16 | 0,00 | 0 | |||||
| 2026-02-13 | 13F | Pathstone Holdings, LLC | 0 | -100,00 | 0 | -100,00 | ||||
| 2026-02-12 | 13F | Brown Brothers Harriman & Co | 6.000 | 0,00 | 2 | -50,00 | ||||
| 2025-11-05 | 13F | SBI Securities Co., Ltd. | 0 | -100,00 | 0 | |||||
| 2026-01-26 | 13F | United Advisor Group, LLC | 0 | -100,00 | 0 | -100,00 | ||||
| 2026-02-02 | 13F | Bellecapital International Ltd. | 0 | -100,00 | 0 | -100,00 | ||||
| 2025-11-14 | 13F | Raymond James Financial Inc | 0 | -100,00 | 0 | |||||
| 2026-02-06 | 13F | Global Retirement Partners, LLC | 65 | 0,00 | 0 | |||||
| 2026-03-16 | 13F/A | Rockefeller Capital Management L.P. | 1.345 | 44.733,33 | 1 | |||||
| 2026-02-10 | 13F | Goldman Sachs Group Inc | 0 | -100,00 | 0 | -100,00 | ||||
| 2026-02-13 | 13F | Warberg Asset Management LLC | 50.000 | 19 | ||||||
| 2026-02-09 | 13F | Geode Capital Management, Llc | 970.853 | 16,62 | 374 | -33,98 | ||||
| 2026-02-09 | 13F | Hartland & Co., LLC | 26 | 0,00 | 0 | |||||
| 2026-02-13 | 13F | Brown Advisory Inc | 10.220 | 0,00 | 4 | -50,00 | ||||
| 2026-01-27 | 13F | TD Waterhouse Canada Inc. | 0 | -100,00 | 0 | |||||
| 2026-01-30 | 13F | R Squared Ltd | 17.841 | 7 | ||||||
| 2026-02-10 | 13F | Caz Investments Lp | 19.634 | -54,05 | 8 | -75,00 | ||||
| 2026-02-09 | 13F | Blue Bell Private Wealth Management, Llc | 375 | 0,00 | 0 | |||||
| 2026-02-17 | 13F | XTX Topco Ltd | 166.692 | 47,25 | 64 | -15,79 | ||||
| 2026-01-28 | 13F | Chicago Partners Investment Group LLC | 104.000 | 48 | ||||||
| 2026-02-12 | 13F | Principal Securities, Inc. | 0 | -100,00 | 0 | -100,00 | ||||
| 2026-02-13 | 13F | Citigroup Inc | 55.731 | 21 | ||||||
| 2026-04-21 | 13F | Penn Davis Mcfarland Inc | 10.000 | 3 | ||||||
| 2026-02-13 | 13F | State Street Corp | 488.212 | 0,00 | 188 | -43,50 | ||||
| 2026-02-12 | 13F | CIBC Private Wealth Group, LLC | 5.000 | 2 | ||||||
| 2026-02-17 | 13F | Susquehanna International Group, Llp | 66.953 | 26 | ||||||
| 2026-04-07 | 13F | Signaturefd, Llc | 15.600 | 0,00 | 4 | -33,33 | ||||
| 2026-02-17 | 13F | Bank Of America Corp /de/ | 1.206 | -3,67 | 0 | |||||
| 2026-01-29 | 13F | UBS Group AG | 2.483.490 | 48,79 | 956 | -15,62 | ||||
| 2026-02-17 | 13F | Toronto Dominion Bank | 778 | 0,00 | 1 | 0,00 | ||||
| 2026-02-11 | 13F | Vestcor Inc | 3.289 | 0,00 | 0 | |||||
| 2026-01-29 | 13F | Vanguard Group Inc | 4.177.637 | -2,45 | 1.608 | -44,69 | ||||
| 2026-02-12 | 13F | Renaissance Technologies Llc | 569.100 | 6,55 | 219 | -39,50 | ||||
| 2026-02-17 | 13F/A | United Capital Management of KS, Inc. | 0 | -100,00 | 0 | -100,00 | ||||
| 2026-02-12 | 13F | BlackRock, Inc. | 1.052.984 | 0,08 | 405 | -43,28 | ||||
| 2026-03-09 | 13F/A | CI Private Wealth, LLC | 14.367 | -28,10 | 3 | -66,67 | ||||
| 2026-02-17 | 13F | Advisor Group Holdings, Inc. | 1.431 | -25,89 | 1 | -100,00 | ||||
| 2026-02-13 | 13F | National Bank Of Canada /fi/ | 104 | 0,00 | 0 | |||||
| 2026-02-17 | 13F | Citadel Advisors Llc | 812.423 | 313 | ||||||
| 2025-11-14 | 13F | Hrt Financial Lp | 0 | -100,00 | 0 |
Other Listings
| US:GAME | 0,60 $ |