Grundlæggende statistik
| Institutionelle aktier (lange) | 61.636.263 - 29,44% (ex 13D/G) - change of 3,53MM shares 6,08% MRQ |
| Institutionel værdi (lang) | $ 52.143 USD ($1000) |
Institutionelt ejerskab og aktionærer
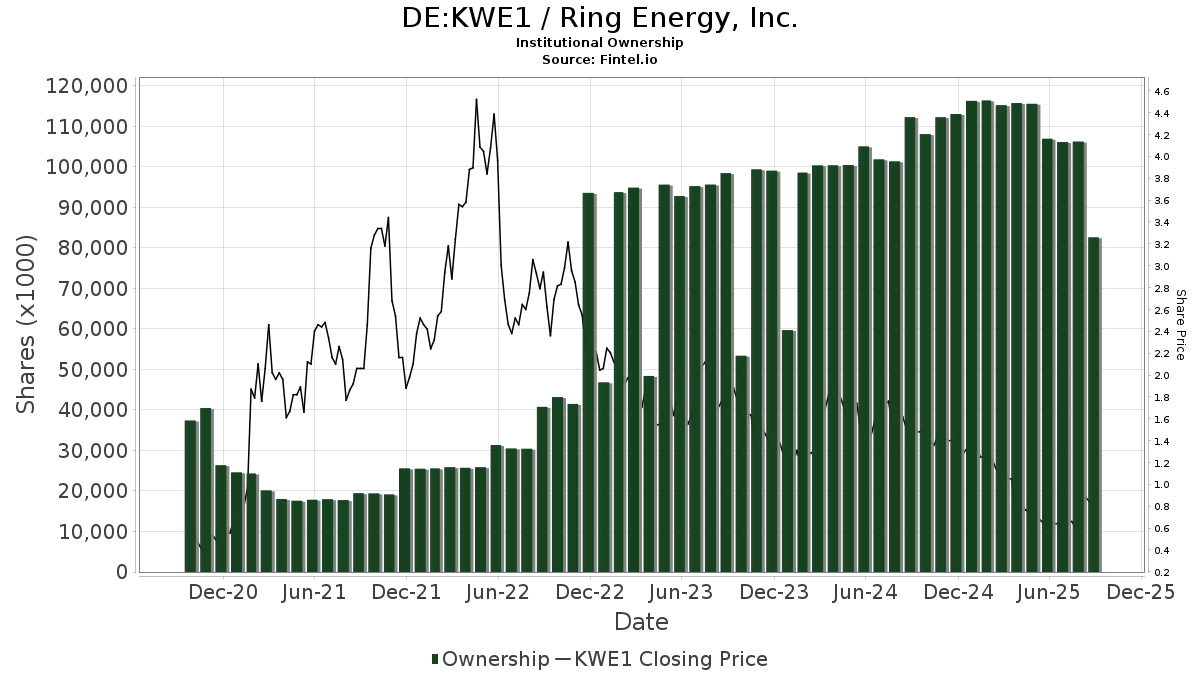
Ring Energy, Inc. (DE:KWE1) har 114 institutionelle ejere og aktionærer, der har indsendt 13D/G- eller 13F-formularer til Securities Exchange Commission (SEC). Disse institutioner har i alt 61,636,263 aktier. Største aktionærer omfatter Vanguard Group Inc, Barclays Plc, Ameriprise Financial Inc, CDC Financial, Inc., UBS Group AG, Susquehanna International Group, Llp, Peak6 Llc, Geode Capital Management, Llc, Bridgeway Capital Management Inc, and Renaissance Technologies Llc .
Ring Energy, Inc. (DB:KWE1) institutionel ejerskabsstruktur viser aktuelle positioner i virksomheden efter institutioner og fonde, samt seneste ændringer i positionsstørrelse. Større aktionærer kan omfatte individuelle investorer, investeringsforeninger, hedgefonde eller institutioner. Skema 13D angiver, at investoren besidder (eller besidder) mere end 5 % af virksomheden og har til hensigt (eller har til hensigt at) aktivt at forfølge en ændring i forretningsstrategi. Skema 13G indikerer en passiv investering på over 5%.
The share price as of April 1, 2026 is 1,27 / share. Previously, on April 4, 2025, the share price was 0,84 / share. This represents an increase of 50,30% over that period.
Fondens stemningsscore
Fund Sentiment Score (fka Ownership Accumulation Score) finder de aktier, der bliver mest købt af fonde. Det er resultatet af en sofistikeret, multi-faktor kvantitativ model, der identificerer virksomheder med de højeste niveauer af institutionel akkumulering. Scoringsmodellen bruger en kombination af den samlede stigning i oplyste ejere, ændringerne i porteføljeallokeringer i disse ejere og andre målinger. Tallet går fra 0 til 100, hvor højere tal indikerer et højere niveau af akkumulering for sine jævnaldrende, og 50 er gennemsnittet.
Opdateringsfrekvens: Dagligt
Se Ownership Explorer, som giver en liste over højest rangerende virksomheder.
AI+ Ask Fintel’s AI assistant about Ring Energy, Inc..
Select a question to share a public post with an AI-crafted answer.
Thinking of good questions…
13F og NPORT arkivering
Detaljer om 13F-arkivering er gratis. Detaljer om NP-ansøgninger kræver et premium-medlemskab. Grønne rækker angiver nye positioner. Røde rækker angiver lukkede positioner. Klik på linket ikon for at se den fulde transaktionshistorik.
Opgrader
for at låse premium-data op og eksportere til Excel ![]() .
.
| Fil dato | Kilde | Investor | Type | Gennemsnitlig pris (Øst) |
Aktier | Δ Aktier (%) |
Rapporteret Værdi ($1000) |
Δ Værdi (%) |
Port Alloc (%) |
|
|---|---|---|---|---|---|---|---|---|---|---|
| 2026-01-22 | 13F | Investment Advisory Services Inc /tx /adv | 100.000 | 0,00 | 87 | -20,18 | ||||
| 2025-11-14 | 13F | D. E. Shaw & Co., Inc. | 0 | -100,00 | 0 | -100,00 | ||||
| 2025-10-21 | 13F | SOA Wealth Advisors, LLC. | 0 | -100,00 | 0 | |||||
| 2026-02-12 | 13F | Sprott Inc. | 285.000 | 248 | ||||||
| 2026-02-09 | 13F | Geode Capital Management, Llc | 1.767.686 | 6,31 | 1.538 | -15,17 | ||||
| 2026-02-17 | 13F | Two Sigma Advisers, Lp | 875.200 | -21,60 | 761 | -37,42 | ||||
| 2026-02-12 | 13F | Hrt Financial Lp | 36.133 | 0 | ||||||
| 2026-02-13 | 13F | De Lisle Partners LLP | 535.957 | 0,00 | 464 | -20,31 | ||||
| 2026-02-13 | 13F | CDC Financial, Inc. | 4.177.870 | 3.635 | ||||||
| 2026-02-13 | 13F | Transamerica Financial Advisors, Inc. | 68 | 0 | ||||||
| 2025-11-05 | 13F | Hantz Financial Services, Inc. | 0 | -100,00 | 0 | |||||
| 2026-02-11 | 13F | Group One Trading, L.p. | Call | 1.614.600 | -28,01 | 1.405 | -42,55 | |||
| 2026-01-30 | 13F | Jackson Hole Capital Partners, LLC | 10.000 | 0,00 | 9 | -20,00 | ||||
| 2026-02-11 | 13F | Group One Trading, L.p. | Put | 142.700 | 0,28 | 124 | -20,00 | |||
| 2026-02-11 | 13F | SmartHarvest Portfolios, LLC | 14.764 | 13 | ||||||
| 2025-10-17 | 13F | Ullmann Financial Group, Inc. | 0 | -100,00 | 0 | -100,00 | ||||
| 2025-11-14 | 13F | Oxford Asset Management Llp | 0 | -100,00 | 0 | -100,00 | ||||
| 2025-11-12 | 13F | CIBC Bancorp USA Inc. | 12.500 | 14 | ||||||
| 2025-11-13 | 13F | Sei Investments Co | 0 | -100,00 | 0 | -100,00 | ||||
| 2025-11-13 | 13F | Mackenzie Financial Corp | 0 | -100,00 | 0 | |||||
| 2026-02-14 | 13F | Rockefeller Capital Management L.P. | 10.000 | 0,00 | 9 | -20,00 | ||||
| 2026-01-23 | 13F | Assetmark, Inc | 320 | 0 | ||||||
| 2025-11-14 | 13F | Jain Global LLC | 0 | -100,00 | 0 | |||||
| 2026-02-06 | 13F | Callahan Advisors, LLC | 43.061 | 53,45 | 37 | 23,33 | ||||
| 2026-02-17 | 13F | Caption Management, LLC | Put | 500.000 | 0,00 | 435 | -20,18 | |||
| 2026-02-13 | 13F | Prudential Financial Inc | 0 | -100,00 | 0 | |||||
| 2026-01-29 | 13F | UMA Financial Services, Inc. | 1.356 | 0,00 | 1 | 0,00 | ||||
| 2026-02-17 | 13F | Caption Management, LLC | 53.573 | 0,00 | 47 | -20,69 | ||||
| 2026-01-12 | 13F | Traynor Capital Management, Inc. | 10.500 | 0,00 | 9 | -18,18 | ||||
| 2026-02-09 | 13F | Sawgrass Asset Management Llc | 0 | -100,00 | 0 | |||||
| 2025-10-29 | 13F | Wealth Enhancement Advisory Services, Llc | 0 | -100,00 | 0 | -100,00 | ||||
| 2026-02-09 | 13F | Catalyst Funds Management Pty Ltd | 168.500 | 0,00 | 147 | -20,22 | ||||
| 2026-02-06 | 13F | IFP Advisors, Inc | 11 | -98,84 | 0 | -100,00 | ||||
| 2026-02-24 | 13F | DGS Capital Management, LLC | 31.196 | 65,36 | 27 | 35,00 | ||||
| 2026-02-13 | 13F | Peak6 Llc | 1.900.000 | 0,00 | 1.653 | -20,18 | ||||
| 2026-01-14 | 13F | Wealthcare Advisory Partners LLC | 27.245 | -4,19 | 24 | -23,33 | ||||
| 2025-11-05 | 13F | SOUTH STATE Corp | 0 | -100,00 | 0 | |||||
| 2026-02-12 | 13F | Renaissance Technologies Llc | 1.750.707 | -39,23 | 1.523 | -51,50 | ||||
| 2026-02-24 | 13F | Bell Investment Advisors, Inc | 0 | -100,00 | 0 | |||||
| 2026-02-12 | 13F | Hollencrest Capital Management | 3.000 | 0,00 | 3 | -33,33 | ||||
| 2026-02-10 | 13F | NINE MASTS CAPITAL Ltd | 20.491 | 18 | ||||||
| 2025-10-08 | 13F | Rise Advisors, LLC | 0 | -100,00 | 0 | |||||
| 2026-02-11 | 13F | Jpmorgan Chase & Co | 73.646 | 12,24 | 64 | -9,86 | ||||
| 2026-01-29 | 13F | Vanguard Group Inc | 11.248.939 | 5,99 | 9.787 | -15,40 | ||||
| 2026-01-23 | 13F | Optima Capital Llc | 568 | 0 | ||||||
| 2026-02-17 | 13F | Mangrove Partners | 166.595 | 145 | ||||||
| 2025-11-06 | 13F | Baader Bank INC | 0 | -100,00 | 0 | -100,00 | ||||
| 2026-01-27 | 13F | WealthCollab, LLC | 0 | -100,00 | 0 | |||||
| 2026-02-17 | 13F | Advisor Group Holdings, Inc. | 11.800 | 0,00 | 10 | -16,67 | ||||
| 2026-02-17 | 13F | Advisory Services Network, LLC | 0 | -100,00 | 0 | |||||
| 2026-02-13 | 13F | Barclays Plc | 8.000.001 | 4.019,76 | 6.960 | 2.145,16 | ||||
| 2026-02-13 | 13F | Wells Fargo & Company/mn | 13.000 | 0,00 | 11 | -21,43 | ||||
| 2026-02-13 | 13F | Morgan Stanley | 209.908 | -13,22 | 183 | -30,80 | ||||
| 2026-02-17 | 13F | Quadrature Capital Ltd | 0 | -100,00 | 0 | |||||
| 2026-02-17 | 13F | Algert Global Llc | 127.760 | 0 | ||||||
| 2025-11-07 | 13F | Pnc Financial Services Group, Inc. | 0 | -100,00 | 0 | |||||
| 2026-02-11 | 13F | Simplex Trading, Llc | Call | 458.600 | -18,89 | 399 | ||||
| 2026-01-12 | 13F | Rialto Wealth Management, LLC | 667 | 0,00 | 1 | |||||
| 2026-02-11 | 13F | Simplex Trading, Llc | Put | 175.500 | -2,88 | 153 | ||||
| 2026-01-09 | 13F | SG Americas Securities, LLC | 80.849 | 109,84 | 0 | |||||
| 2026-02-11 | 13F | Simplex Trading, Llc | 26.416 | -0,28 | 23 | |||||
| 2026-01-28 | 13F | EPG Wealth Management LLC | 11.552 | 0,00 | 10 | -16,67 | ||||
| 2026-02-11 | 13F | O'shaughnessy Asset Management, Llc | 0 | -100,00 | 0 | |||||
| 2026-02-13 | 13F | Marshall Wace, Llp | 1.077.569 | 937 | ||||||
| 2026-02-03 | 13F | Sequoia Financial Advisors, LLC | 15.941 | 0,00 | 14 | -23,53 | ||||
| 2026-02-10 | 13F | Bank of New York Mellon Corp | 758.580 | 3,80 | 660 | -17,21 | ||||
| 2026-01-15 | 13F | Founders Capital Management | 47.200 | -17,48 | 41 | -33,87 | ||||
| 2025-11-03 | 13F | Valeo Financial Advisors, LLC | 0 | -100,00 | 0 | |||||
| 2026-02-12 | 13F | Dimensional Fund Advisors Lp | 11.409 | 0,00 | 10 | -25,00 | ||||
| 2026-02-09 | 13F | Coldstream Capital Management Inc | 11.460 | -30,60 | 10 | -50,00 | ||||
| 2026-01-26 | 13F | Cwm, Llc | 172 | -95,20 | 0 | |||||
| 2026-02-17 | 13F | Ameriprise Financial Inc | 5.012.863 | 0,96 | 4.361 | -19,42 | ||||
| 2025-11-04 | 13F | Jones Financial Companies Lllp | 0 | -100,00 | 0 | -100,00 | ||||
| 2026-02-17 | 13F | Citadel Advisors Llc | 45.274 | -88,21 | 39 | -90,67 | ||||
| 2026-02-11 | 13F | Metis Global Partners, LLC | 210.350 | 183 | ||||||
| 2026-02-13 | 13F | Arrowstreet Capital, Limited Partnership | 576.372 | -45,99 | 501 | -56,92 | ||||
| 2026-02-17 | 13F | Fmr Llc | 84.966 | -16,64 | 74 | -34,23 | ||||
| 2026-02-13 | 13F | Motiv8 Investments LLC | 100 | 0 | ||||||
| 2026-02-17 | 13F | Citadel Advisors Llc | Put | 101.000 | -2,51 | 88 | -22,32 | |||
| 2026-02-17 | 13F | Citadel Advisors Llc | Call | 205.700 | -41,31 | 179 | -53,40 | |||
| 2026-02-17 | 13F | Two Sigma Investments, Lp | 1.320.483 | -28,59 | 1.149 | -43,03 | ||||
| 2026-02-11 | 13F | Empowered Funds, LLC | 1.063.546 | 10,81 | 925 | -11,57 | ||||
| 2026-02-13 | 13F | Citigroup Inc | Call | 0 | -100,00 | 0 | ||||
| 2026-02-13 | 13F | Citigroup Inc | 0 | -100,00 | 0 | |||||
| 2025-11-13 | 13F | Hsbc Holdings Plc | 0 | -100,00 | 0 | -100,00 | ||||
| 2026-02-19 | 13F | CI Private Wealth, LLC | 12.000 | 0,00 | 10 | -23,08 | ||||
| 2026-02-17 | 13F/A | RBF Capital, LLC | 907.417 | 0,00 | 789 | -20,22 | ||||
| 2025-10-21 | 13F | True Wealth Design, LLC | 0 | -100,00 | 0 | |||||
| 2026-02-23 | 13F | Virtu Financial LLC | 0 | -100,00 | 0 | |||||
| 2026-02-10 | 13F | Savant Capital, LLC | 0 | -100,00 | 0 | |||||
| 2025-11-14 | 13F | Brevan Howard Capital Management LP | 0 | -100,00 | 0 | -100,00 | ||||
| 2026-02-13 | 13F | State Street Corp | 722.987 | 8,12 | 629 | -13,74 | ||||
| 2025-11-14 | 13F | Point72 Europe (London) LLP | 1.000 | 1 | ||||||
| 2026-02-17 | 13F | Two Sigma Securities, Llc | 0 | -100,00 | 0 | |||||
| 2026-02-13 | 13F | Arkadios Wealth Advisors | 11.552 | -43,74 | 10 | -54,55 | ||||
| 2025-11-12 | 13F | Aster Capital Management (DIFC) Ltd | 0 | -100,00 | 0 | |||||
| 2025-11-14 | 13F | Price T Rowe Associates Inc /md/ | 0 | -100,00 | 0 | |||||
| 2026-02-18 | 13F | Vident Advisory, LLC | 45.171 | -3,01 | 39 | -22,00 | ||||
| 2026-02-17 | 13F | Millennium Management Llc | 186.865 | -77,47 | 163 | -82,08 | ||||
| 2026-01-29 | 13F | UBS Group AG | 3.283.223 | -16,53 | 2.856 | -33,38 | ||||
| 2026-02-11 | 13F | Winnow Wealth Llc | 3.365 | 0,00 | 3 | -50,00 | ||||
| 2025-10-08 | 13F | Patriot Financial Group Insurance Agency, LLC | 0 | -100,00 | 0 | -100,00 | ||||
| 2026-02-13 | 13F | Integrated Wealth Concepts LLC | 0 | -100,00 | 0 | |||||
| 2026-02-17 | 13F | CastleKnight Management LP | 0 | -100,00 | 0 | |||||
| 2026-02-17 | 13F | Royal Bank Of Canada | 250 | -0,40 | 0 | |||||
| 2026-02-13 | 13F | Mariner, LLC | 33.965 | 3,14 | 30 | -17,14 | ||||
| 2026-01-20 | 13F | Stratos Wealth Advisors, LLC | 0 | -100,00 | 0 | |||||
| 2026-02-19 | 13F | Invesco Ltd. | 357.695 | -7,07 | 311 | -25,78 | ||||
| 2026-01-23 | 13F | Rsm Us Wealth Management Llc | 14.800 | 0,00 | 13 | -25,00 | ||||
| 2026-02-06 | 13F | Mraz, Amerine & Associates, Inc. | 20.000 | 0,00 | 17 | -19,05 | ||||
| 2025-11-14 | 13F | Wolverine Trading, Llc | Call | 0 | -100,00 | 0 | ||||
| 2026-02-13 | 13F | Centiva Capital, LP | 0 | -100,00 | 0 | |||||
| 2025-11-14 | 13F | Wolverine Trading, Llc | 0 | -100,00 | 0 | |||||
| 2026-02-17 | 13F | Northern Trust Corp | 330.014 | -9,10 | 287 | -27,34 | ||||
| 2025-10-22 | 13F | Cerity Partners LLC | 0 | -100,00 | 0 | |||||
| 2025-11-14 | 13F | Cubist Systematic Strategies, LLC | 95.413 | 1.564,57 | 104 | 2.500,00 | ||||
| 2025-11-14 | 13F | Point72 Asia (Singapore) Pte. Ltd. | 62.725 | -50,00 | 68 | -31,31 | ||||
| 2026-02-09 | 13F | Jefferies Financial Group Inc. | 36.861 | 90,01 | 32 | 52,38 | ||||
| 2025-11-04 | 13F | Principal Financial Group Inc | 0 | -100,00 | 0 | |||||
| 2026-02-09 | 13F | HBK Sorce Advisory LLC | 0 | -100,00 | 0 | -100,00 | ||||
| 2026-02-10 | 13F | Connor, Clark & Lunn Investment Management Ltd. | 1.433.170 | 9,15 | 1.247 | -12,93 | ||||
| 2026-02-11 | 13F | Winton Capital Group Ltd | 969.729 | 32,86 | 844 | 6,04 | ||||
| 2026-02-10 | 13F | Linscomb & Williams, Inc. | 92.272 | 80 | ||||||
| 2026-02-02 | 13F | Hidden Cove Wealth Management, LLC | 17.300 | 0,00 | 15 | -16,67 | ||||
| 2026-02-12 | 13F | Mindset Wealth Management, Llc | 67.400 | 0,00 | 59 | -20,55 | ||||
| 2026-01-15 | 13F | Royal Fund Management, LLC | 30.000 | 26 | ||||||
| 2026-01-23 | 13F | Avion Wealth | 665 | 0,00 | 0 | |||||
| 2026-02-10 | 13F | Goldman Sachs Group Inc | 41.742 | -75,60 | 36 | -80,65 | ||||
| 2026-02-17 | 13F | Canada Pension Plan Investment Board | 207.300 | 180 | ||||||
| 2025-11-10 | 13F | Hartland & Co., LLC | 0 | -100,00 | 0 | |||||
| 2026-02-12 | 13F | Jane Street Group, Llc | 518.926 | -68,95 | 451 | -75,23 | ||||
| 2026-02-12 | 13F | Jane Street Group, Llc | Put | 114.000 | 12,87 | 99 | -10,00 | |||
| 2026-02-12 | 13F | Jane Street Group, Llc | Call | 124.000 | -11,37 | 108 | -29,61 | |||
| 2026-02-17 | 13F | XTX Topco Ltd | 233.249 | -24,37 | 203 | -39,88 | ||||
| 2025-10-31 | 13F | Y-Intercept (Hong Kong) Ltd | 0 | -100,00 | 0 | |||||
| 2026-02-06 | 13F | Watchman Group, Inc. | 500.000 | 0,00 | 435 | -20,18 | ||||
| 2026-02-17 | 13F | Tower Research Capital LLC (TRC) | 0 | -100,00 | 0 | |||||
| 2026-02-17 | 13F | Abel Hall, LLC | 35.380 | 0,00 | 31 | -21,05 | ||||
| 2026-02-06 | 13F | Gsa Capital Partners Llp | 604.791 | -17,06 | 1 | |||||
| 2025-11-14 | 13F | Warburg Pincus Llc | 0 | -100,00 | 0 | -100,00 | ||||
| 2026-02-17 | 13F | Bank Of America Corp /de/ | 54.051 | -32,30 | 47 | -45,98 | ||||
| 2025-11-19 | 13F | Captrust Financial Advisors | 0 | -100,00 | 0 | -100,00 | ||||
| 2025-11-14 | 13F | Ieq Capital, Llc | 0 | -100,00 | 0 | |||||
| 2025-11-14 | 13F | Toroso Investments, LLC | 0 | -100,00 | 0 | -100,00 | ||||
| 2025-11-14 | 13F | Point72 (DIFC) Ltd | 0 | -100,00 | 0 | |||||
| 2025-11-14 | 13F | ExodusPoint Capital Management, LP | 0 | -100,00 | 0 | |||||
| 2026-02-13 | 13F | Charles Schwab Investment Management Inc | 97.091 | -0,02 | 84 | -20,00 | ||||
| 2026-02-10 | 13F | Quantbot Technologies LP | 0 | -100,00 | 0 | |||||
| 2026-02-17 | 13F | Susquehanna International Group, Llp | Put | 152.500 | -4,57 | 133 | -24,14 | |||
| 2026-02-17 | 13F | Susquehanna International Group, Llp | Call | 10.100 | -97,59 | 9 | -98,25 | |||
| 2025-11-14 | 13F | Aristotle Capital Boston, LLC | 0 | -100,00 | 0 | |||||
| 2025-11-12 | 13F | First Trust Advisors Lp | 0 | -100,00 | 0 | |||||
| 2026-02-17 | 13F | Private Advisor Group, LLC | 15.000 | 13 | ||||||
| 2026-01-14 | 13F | Thompson Investment Management, Inc. | 734 | 0,00 | 1 | |||||
| 2026-02-05 | 13F | Thrivent Financial For Lutherans | 0 | -100,00 | 0 | |||||
| 2026-02-09 | 13F | Prospera Financial Services Inc | 16.450 | 29,53 | 14 | 7,69 | ||||
| 2026-02-13 | 13F | JustInvest LLC | 119.165 | -11,70 | 104 | -29,93 | ||||
| 2026-02-17 | 13F | Susquehanna International Group, Llp | 2.014.141 | 298,56 | 1.752 | 218,55 | ||||
| 2026-01-30 | 13F | R Squared Ltd | 25.152 | 86,20 | 22 | 50,00 | ||||
| 2026-02-13 | 13F | Change Path, LLC | 22.667 | 0,00 | 20 | -20,83 | ||||
| 2026-02-17 | 13F | Cetera Investment Advisers | 59.155 | -37,34 | 51 | -50,00 | ||||
| 2026-02-17 | 13F | Man Group plc | 0 | -100,00 | 0 | |||||
| 2026-02-10 | 13F | Bnp Paribas Arbitrage, Sa | 492 | -27,96 | 0 | |||||
| 2026-02-17 | 13F | Bridgeway Capital Management Inc | 1.754.062 | 6,29 | 1.526 | -15,13 | ||||
| 2025-10-15 | 13F | Harbor Capital Advisors, Inc. | 0 | -100,00 | 0 | |||||
| 2025-11-13 | 13F | Hudson Bay Capital Management LP | 0 | -100,00 | 0 | |||||
| 2026-04-02 | 13F | Marex Group plc | 0 | -100,00 | 0 | -100,00 | ||||
| 2026-02-12 | 13F | Groupe la Francaise | 0 | -100,00 | 0 | |||||
| 2025-11-14 | 13F | Raymond James Financial Inc | 0 | -100,00 | 0 | |||||
| 2026-01-29 | 13F | Nbc Securities, Inc. | 3.000 | 0,00 | 3 | -33,33 | ||||
| 2025-11-14 | 13F | Gotham Asset Management, LLC | 0 | -100,00 | 0 | -100,00 | ||||
| 2025-11-10 | 13F | Stonebrook Private Inc. | 0 | -100,00 | 0 | |||||
| 2026-02-12 | 13F | BlackRock, Inc. | 1.688.007 | 1,79 | 1.469 | -18,76 | ||||
| 2025-11-12 | 13F | Group One Trading, L.p. | 0 | -100,00 | 0 | |||||
| 2026-02-17 | 13F | Van Den Berg Management I, Inc | 57.884 | 13,76 | 50 | -9,09 | ||||
| 2026-02-13 | 13F | SRS Capital Advisors, Inc. | 0 | -100,00 | 0 | |||||
| 2025-11-04 | 13F | Atlantic Union Bankshares Corp | 0 | -100,00 | 0 | |||||
| 2026-02-10 | 13F | State of Wyoming | 340.643 | 296 | ||||||
| 2026-02-17 | 13F | Graham Capital Management, L.P. | 600.042 | 369,74 | 522 | 275,54 | ||||
| 2026-02-05 | 13F | Allworth Financial LP | 125 | 0,00 | 0 | |||||
| 2026-02-10 | 13F | Acadian Asset Management Llc | 841.128 | 166,61 | 1 | |||||
| 2026-02-13 | 13F | Squarepoint Ops LLC | 0 | -100,00 | 0 | |||||
| 2025-10-08 | 13F/A | New York State Common Retirement Fund | 0 | -100,00 | 0 | -100,00 | ||||
| 2026-02-13 | 13F | OMERS ADMINISTRATION Corp | 271.600 | 236 | ||||||
| 2026-03-02 | 13F | Amicus Financial Advisors, LLC | 11.884 | 10 | ||||||
| 2026-02-13 | 13F | Victory Capital Management Inc | 531.970 | 41,90 | 463 | 13,24 | ||||
| 2025-11-13 | 13F | Jump Financial, LLC | 0 | -100,00 | 0 | |||||
| 2026-01-09 | 13F | SG Americas Securities, LLC | Put | 100.000 | 0,00 | 0 | ||||
| 2026-02-05 | 13F | Plante Moran Financial Advisors, LLC | 4.000 | 3 | ||||||
| 2026-02-18 | 13F | GWM Advisors LLC | 0 | -100,00 | 0 | |||||
| 2026-02-11 | 13F | Buckingham Strategic Partners | 0 | -100,00 | 0 | |||||
| 2026-02-09 | 13F | Barry Investment Advisors, LLC | 15.000 | -40,00 | 13 | -51,85 | ||||
| 2025-11-14 | 13F | Mercer Global Advisors Inc /adv | 0 | -100,00 | 0 | |||||
| 2026-02-11 | 13F | LPL Financial LLC | 98.910 | -3,42 | 86 | -22,52 | ||||
| 2026-02-17 | 13F | Point72 Asset Management, L.P. | 62.723 | 55 | ||||||
| 2025-11-14 | 13F | Schonfeld Strategic Advisors LLC | 0 | -100,00 | 0 | -100,00 | ||||
| 2026-02-06 | 13F | EverSource Wealth Advisors, LLC | 444 | -68,47 | 0 | -100,00 | ||||
| 2026-02-17 | 13F | Aqr Capital Management Llc | 10.392 | -97,72 | 9 | -98,19 |
Other Listings
| US:REI | 1,49 $ |