Grundlæggende statistik
| Institutionelle aktier (lange) | 26.631.417 - 84,02% (ex 13D/G) - change of -5,92MM shares -18,22% MRQ |
| Institutionel værdi (lang) | $ 660.401 USD ($1000) |
Institutionelt ejerskab og aktionærer
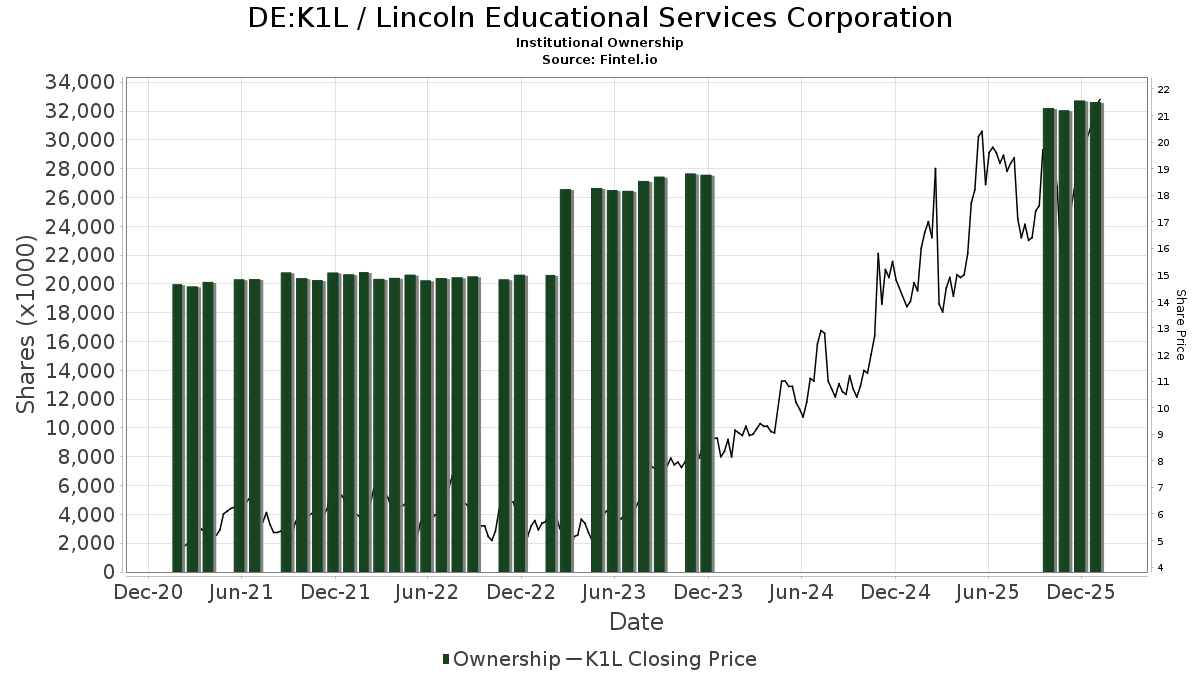
Lincoln Educational Services Corporation (DE:K1L) har 162 institutionelle ejere og aktionærer, der har indsendt 13D/G- eller 13F-formularer til Securities Exchange Commission (SEC). Disse institutioner har i alt 26,631,417 aktier. Største aktionærer omfatter Juniper Investment Company, LLC, BlackRock, Inc., Vanguard Group Inc, Alyeska Investment Group, L.P., Heartland Advisors Inc, Needham Investment Management Llc, Next Century Growth Investors Llc, Dimensional Fund Advisors Lp, First Eagle Investment Management, LLC, and Wasatch Advisors Inc .
Lincoln Educational Services Corporation (DB:K1L) institutionel ejerskabsstruktur viser aktuelle positioner i virksomheden efter institutioner og fonde, samt seneste ændringer i positionsstørrelse. Større aktionærer kan omfatte individuelle investorer, investeringsforeninger, hedgefonde eller institutioner. Skema 13D angiver, at investoren besidder (eller besidder) mere end 5 % af virksomheden og har til hensigt (eller har til hensigt at) aktivt at forfølge en ændring i forretningsstrategi. Skema 13G indikerer en passiv investering på over 5%.
The share price as of April 24, 2026 is 33,80 / share. Previously, on April 28, 2025, the share price was 15,10 / share. This represents an increase of 123,84% over that period.
Fondens stemningsscore
Fund Sentiment Score (fka Ownership Accumulation Score) finder de aktier, der bliver mest købt af fonde. Det er resultatet af en sofistikeret, multi-faktor kvantitativ model, der identificerer virksomheder med de højeste niveauer af institutionel akkumulering. Scoringsmodellen bruger en kombination af den samlede stigning i oplyste ejere, ændringerne i porteføljeallokeringer i disse ejere og andre målinger. Tallet går fra 0 til 100, hvor højere tal indikerer et højere niveau af akkumulering for sine jævnaldrende, og 50 er gennemsnittet.
Opdateringsfrekvens: Dagligt
Se Ownership Explorer, som giver en liste over højest rangerende virksomheder.
AI+ Ask Fintel’s AI assistant about Lincoln Educational Services Corporation.
Select a question to share a public post with an AI-crafted answer.
Thinking of good questions…
13F og NPORT arkivering
Detaljer om 13F-arkivering er gratis. Detaljer om NP-ansøgninger kræver et premium-medlemskab. Grønne rækker angiver nye positioner. Røde rækker angiver lukkede positioner. Klik på linket ikon for at se den fulde transaktionshistorik.
Opgrader
for at låse premium-data op og eksportere til Excel ![]() .
.
| Fil dato | Kilde | Investor | Type | Gennemsnitlig pris (Øst) |
Aktier | Δ Aktier (%) |
Rapporteret Værdi ($1000) |
Δ Værdi (%) |
Port Alloc (%) |
|
|---|---|---|---|---|---|---|---|---|---|---|
| 2026-02-17 | 13F | Canada Pension Plan Investment Board | 3.000 | 417,24 | 72 | 3.500,00 | ||||
| 2025-11-14 | 13F | Wolverine Trading, Llc | Call | 0 | -100,00 | 0 | ||||
| 2026-02-09 | 13F | Geode Capital Management, Llc | 705.191 | -0,36 | 17.034 | 2,40 | ||||
| 2026-02-17 | 13F | Jones Financial Companies Lllp | 100 | 0,00 | 2 | 0,00 | ||||
| 2026-02-13 | 13F | Sei Investments Co | 65.787 | 1.589 | ||||||
| 2026-02-10 | 13F | Ritter Daniher Financial Advisory LLC / DE | 350 | 8 | ||||||
| 2026-02-13 | 13F | Citigroup Inc | 1.015 | -21,32 | 25 | -20,00 | ||||
| 2026-02-11 | 13F | Franklin Resources Inc | 19.969 | 0,48 | 482 | 3,21 | ||||
| 2026-04-16 | 13F | Diversified Trust Co | 8.463 | 344 | ||||||
| 2026-02-17 | 13F/A | Uniplan Investment Counsel, Inc. | 313.567 | -0,15 | 7.573 | 2,62 | ||||
| 2026-02-17 | 13F | Two Sigma Advisers, Lp | 43.800 | -5,60 | 1.058 | -3,03 | ||||
| 2026-02-17 | 13F | Millennium Management Llc | 208.912 | 1.084,17 | 5.045 | 1.118,60 | ||||
| 2026-02-06 | 13F | Legato Capital Management LLC | 125.399 | 9,54 | 3.028 | 12,57 | ||||
| 2026-02-13 | 13F | Manufacturers Life Insurance Company, The | 0 | -100,00 | 0 | |||||
| 2026-02-13 | 13F | Next Century Growth Investors Llc | 791.271 | 4,13 | 19.109 | 7,01 | ||||
| 2026-02-17 | 13F | Manatuck Hill Partners, LLC | 180.675 | 63,25 | 4.363 | 67,81 | ||||
| 2026-02-10 | 13F | Intech Investment Management Llc | 9.641 | 6,47 | 233 | 9,43 | ||||
| 2026-02-12 | 13F | Federated Hermes, Inc. | 119 | -86,15 | 3 | -90,00 | ||||
| 2026-02-13 | 13F | Charles Schwab Investment Management Inc | 247.898 | -0,08 | 5.987 | 2,68 | ||||
| 2026-04-15 | 13F | Pullen Investment Management, LLC | 187.905 | 1,04 | 7.644 | 70,22 | ||||
| 2026-02-17 | 13F | State Of Wisconsin Investment Board | 47.097 | 19,54 | 1.137 | 22,92 | ||||
| 2026-02-13 | 13F | Arrowstreet Capital, Limited Partnership | 172.173 | -45,24 | 4.158 | -43,73 | ||||
| 2026-02-13 | 13F | Alyeska Investment Group, L.P. | 1.626.623 | 12,21 | 39.283 | 15,31 | ||||
| 2026-02-11 | 13F | Group One Trading, L.p. | Put | 900 | 22 | |||||
| 2026-02-11 | 13F | Group One Trading, L.p. | Call | 100 | -93,75 | 2 | -94,59 | |||
| 2026-02-13 | 13F | SRS Capital Advisors, Inc. | 45 | -80,60 | 1 | -80,00 | ||||
| 2026-02-17 | 13F | Lonestar Capital Management LLC | 200.000 | 4.830 | ||||||
| 2025-10-29 | 13F | AMH Equity Ltd | 75.000 | 0,00 | 1.762 | 1,97 | ||||
| 2026-02-10 | 13F | Bnp Paribas Arbitrage, Sa | 8.939 | 5,24 | 216 | 8,04 | ||||
| 2026-04-27 | 13F | Y-Intercept (Hong Kong) Ltd | 72.158 | 2.935 | ||||||
| 2026-02-10 | 13F | Goldman Sachs Group Inc | 134.696 | -14,05 | 3.253 | -11,68 | ||||
| 2026-04-20 | 13F | Ritholtz Wealth Management | 11.407 | -1,49 | 464 | 66,31 | ||||
| 2026-03-06 | 13F | Hsbc Holdings Plc | 44.411 | 22,16 | 1.077 | 28,06 | ||||
| 2025-11-14 | 13F | Caption Management, LLC | Call | 0 | -100,00 | 0 | ||||
| 2026-02-10 | 13F | Connor, Clark & Lunn Investment Management Ltd. | 188.435 | -3,82 | 4.551 | -1,17 | ||||
| 2026-02-11 | 13F | MCF Advisors LLC | 1.014 | 4,54 | 24 | 9,09 | ||||
| 2026-02-13 | 13F | Toroso Investments, LLC | 21.212 | -3,63 | 512 | -0,97 | ||||
| 2026-02-17 | 13F | Trexquant Investment LP | 135.049 | 272,61 | 3.261 | 283,20 | ||||
| 2026-02-17 | 13F | Citadel Advisors Llc | 17.197 | 57,97 | 415 | 62,75 | ||||
| 2026-02-17 | 13F | Citadel Advisors Llc | Call | 14.400 | -49,83 | 348 | -48,52 | |||
| 2026-02-17 | 13F | Wellington Management Group Llp | 588.511 | 18,72 | 14.213 | 22,00 | ||||
| 2026-02-13 | 13F | State Street Corp | 589.215 | -1,97 | 14.230 | 0,74 | ||||
| 2026-02-17 | 13F | 4D Advisors, LLC | 185.000 | 4.468 | ||||||
| 2025-11-13 | 13F | Mackenzie Financial Corp | 0 | -100,00 | 0 | |||||
| 2025-11-14 | 13F | Walleye Capital LLC | Put | 0 | -100,00 | 0 | -100,00 | |||
| 2026-03-12 | 13F/A | Peak6 Llc | Call | 8.300 | -66,12 | 200 | -65,22 | |||
| 2026-02-17 | 13F | Oberweis Asset Management Inc/ | 309.100 | 2,49 | 7.465 | 5,32 | ||||
| 2026-04-13 | 13F | True Wealth Design, LLC | 16 | 0,00 | 1 | |||||
| 2025-11-14 | 13F | Walleye Capital LLC | Call | 0 | -100,00 | 0 | -100,00 | |||
| 2026-02-13 | 13F | MYDA Advisors LLC | 60.104 | 1.452 | ||||||
| 2026-01-27 | 13F | Journey Advisory Group, LLC | 251.754 | -1,30 | 6.080 | 1,42 | ||||
| 2026-02-17 | 13F | Northern Trust Corp | 227.535 | -5,01 | 5.495 | -2,40 | ||||
| 2026-02-12 | 13F | Commonwealth Equity Services, Llc | 13.246 | 1,19 | 320 | |||||
| 2026-02-17 | 13F | Susquehanna International Group, Llp | 12.616 | 38,24 | 305 | 42,06 | ||||
| 2026-02-17 | 13F | Susquehanna International Group, Llp | Put | 16.900 | -14,21 | 408 | -11,69 | |||
| 2026-04-21 | 13F | Penbrook Management LLC | 12.740 | -25,17 | 518 | 26,03 | ||||
| 2026-02-17 | 13F | Price T Rowe Associates Inc /md/ | 16.976 | 8,99 | 0 | |||||
| 2026-02-17 | 13F | Cannell Capital Llc | 0 | -100,00 | 0 | |||||
| 2026-04-22 | 13F | Sterling Capital Management LLC | 193 | -4,46 | 8 | 75,00 | ||||
| 2026-02-13 | 13F | Squarepoint Ops LLC | 63.994 | -44,77 | 1.545 | -43,24 | ||||
| 2026-02-06 | 13F | FourThought Financial Partners, LLC | 0 | -100,00 | 0 | |||||
| 2026-02-17 | 13F | Fmr Llc | 4.114 | 48,57 | 99 | 52,31 | ||||
| 2026-02-17 | 13F/A | Sentinus, LLC | 38.800 | 937 | ||||||
| 2026-02-17 | 13F | Advisor Group Holdings, Inc. | 88 | -98,67 | 2 | -98,40 | ||||
| 2026-04-16 | 13F | Ellsworth Advisors, LLC | 24.978 | 1.016 | ||||||
| 2026-02-13 | 13F | Parkside Financial Bank & Trust | 35 | 0,00 | 1 | |||||
| 2026-02-13 | 13F | Needham Investment Management Llc | 1.125.000 | 30,06 | 27.169 | 33,65 | ||||
| 2026-04-09 | 13F | Secure Asset Management, LLC | 9.102 | -85,47 | 370 | -75,55 | ||||
| 2026-02-12 | 13F | Jane Street Group, Llc | 0 | -100,00 | 0 | |||||
| 2026-02-17 | 13F | Bank Of America Corp /de/ | 145.440 | 5,60 | 3.512 | 8,53 | ||||
| 2026-02-18 | 13F | Garton & Associates Financial Advisors LLC | 349 | 8 | ||||||
| 2025-11-14 | 13F | Peak6 Llc | Put | 0 | -100,00 | 0 | -100,00 | |||
| 2026-02-12 | 13F | MetLife Investment Management, LLC | 16.825 | -5,33 | 406 | -2,64 | ||||
| 2026-02-13 | 13F | Barclays Plc | 54.852 | 27,46 | 1.325 | 30,96 | ||||
| 2026-02-11 | 13F | Heartland Advisors Inc | 1.290.000 | 0,00 | 31.154 | 2,76 | ||||
| 2026-04-15 | 13F | Brady Martz Wealth Solutions, LLC | 6.061 | 247 | ||||||
| 2026-02-17 | 13F | Citadel Advisors Llc | Put | 0 | -100,00 | 0 | ||||
| 2026-02-13 | 13F | American Century Companies Inc | 675.648 | 18,01 | 16.317 | 21,27 | ||||
| 2026-02-13 | 13F | Smartleaf Asset Management LLC | 500 | 12 | ||||||
| 2026-04-23 | 13F | North Star Investment Management Corp. | 168.275 | 17,45 | 6.845 | 97,83 | ||||
| 2026-02-12 | 13F | Renaissance Technologies Llc | 353.878 | -32,42 | 8.546 | -30,55 | ||||
| 2026-02-13 | 13F | Essex Investment Management Co Llc | 388.819 | -2,15 | 9.390 | 0,56 | ||||
| 2025-11-14 | 13F | Archon Capital Management LLC | 0 | -100,00 | 0 | |||||
| 2026-04-20 | 13F | State of Alaska, Department of Revenue | 5.835 | 0,00 | 0 | |||||
| 2026-02-17 | 13F | Juniper Investment Company, LLC | 2.363.311 | 0,00 | 57.074 | 2,77 | ||||
| 2026-02-13 | 13F | Marshall Wace, Llp | 63.010 | 1.522 | ||||||
| 2026-02-17 | 13F | Jump Financial, LLC | 0 | -100,00 | 0 | |||||
| 2026-02-13 | 13F | Caitong International Asset Management Co., Ltd | 0 | -100,00 | 0 | |||||
| 2026-02-11 | 13F | Group One Trading, L.p. | 0 | -100,00 | 0 | -100,00 | ||||
| 2026-02-17 | 13F | Dauntless Investment Group, LLC | 56.023 | 0,00 | 1.353 | 2,74 | ||||
| 2026-04-07 | 13F | Signaturefd, Llc | 22 | 0,00 | 1 | |||||
| 2026-02-17 | 13F | Point72 Asset Management, L.P. | 431.401 | -3,05 | 10.418 | -0,37 | ||||
| 2025-11-10 | 13F | Counterpoint Mutual Funds LLC | 0 | -100,00 | 0 | |||||
| 2026-02-14 | 13F | Rockefeller Capital Management L.P. | 1.000 | 0,00 | 24 | 4,35 | ||||
| 2026-01-29 | 13F | Calamos Advisors LLC | 0 | -100,00 | 0 | |||||
| 2026-01-27 | 13F | Zurcher Kantonalbank (Zurich Cantonalbank) | 306 | 7 | ||||||
| 2026-04-23 | 13F | CWM Advisors, LLC | 12.649 | -34,34 | 515 | 10,54 | ||||
| 2026-02-17 | 13F | Aqr Capital Management Llc | 17.172 | -5,44 | 415 | -2,82 | ||||
| 2026-02-03 | 13F | Alpha Cubed Investments, LLC | 8.750 | 0,00 | 211 | 2,93 | ||||
| 2025-11-14 | 13F | Centiva Capital, LP | 0 | -100,00 | 0 | |||||
| 2025-11-17 | 13F | PDT Partners, LLC | 0 | -100,00 | 0 | |||||
| 2026-04-24 | 13F | Private Advisor Group, LLC | 126.527 | 7,73 | 5.147 | 81,49 | ||||
| 2025-11-14 | 13F | EAM Investors, LLC | 0 | -100,00 | 0 | -100,00 | ||||
| 2026-02-10 | 13F | Rothschild Investment Llc | 62 | 3,33 | 1 | 0,00 | ||||
| 2026-02-18 | 13F | Galaxy Group Investments LLC | 908 | 22 | ||||||
| 2026-02-06 | 13F | Pnc Financial Services Group, Inc. | 2.159 | -0,09 | 52 | 4,00 | ||||
| 2026-02-03 | 13F | SBI Securities Co., Ltd. | 37 | 0,00 | 1 | |||||
| 2026-02-18 | 13F | Pillsbury Lake Capital LLC | 705.108 | 17.028 | ||||||
| 2026-02-14 | 13F | Militia Capital Partners, LP | 62.958 | 9,95 | 1.520 | 13,01 | ||||
| 2026-04-13 | 13F | IFP Advisors, Inc | 0 | -100,00 | 0 | |||||
| 2026-02-11 | 13F | O'shaughnessy Asset Management, Llc | 14.083 | -19,34 | 340 | -17,07 | ||||
| 2026-01-29 | 13F | UBS Group AG | 58.534 | -25,07 | 1.414 | -23,00 | ||||
| 2026-02-11 | 13F | Parallel Advisors, LLC | 9.978 | 12,39 | 241 | 15,38 | ||||
| 2026-02-17 | 13F | Quantinno Capital Management LP | 12.430 | 26,54 | 300 | 30,43 | ||||
| 2026-02-17 | 13F | Punch & Associates Investment Management, Inc. | 362.295 | -2,54 | 8.749 | 0,15 | ||||
| 2026-02-17 | 13F | Royal Bank Of Canada | 1.536 | 246,73 | 38 | 280,00 | ||||
| 2026-02-04 | 13F | Bailard, Inc. | 42.071 | -37,92 | 1.016 | -36,18 | ||||
| 2025-11-07 | 13F | SG Capital Management LLC | 0 | -100,00 | 0 | -100,00 | ||||
| 2026-01-29 | 13F | Sanctuary Advisors, LLC | 0 | -100,00 | 0 | -100,00 | ||||
| 2026-02-13 | 13F | Rhumbline Advisers | 44.934 | -14,18 | 1.085 | -11,79 | ||||
| 2026-02-17 | 13F | Portolan Capital Management, LLC | 14.007 | -95,62 | 338 | -95,50 | ||||
| 2026-02-06 | 13F | Global Retirement Partners, LLC | 236 | 0,00 | 6 | 0,00 | ||||
| 2026-02-13 | 13F | Rice Hall James & Associates, Llc | 110.087 | -14,76 | 2.659 | -12,39 | ||||
| 2026-02-12 | 13F | Campbell & CO Investment Adviser LLC | 18.587 | 62,30 | 449 | 66,54 | ||||
| 2026-02-13 | 13F | Lord, Abbett & Co. Llc | 222.402 | 0,06 | 5 | 0,00 | ||||
| 2026-02-17 | 13F | Alliancebernstein L.p. | 29.360 | 0,00 | 709 | 2,90 | ||||
| 2026-02-09 | 13F | Royce & Associates Lp | 173.243 | -9,34 | 4.184 | -6,84 | ||||
| 2026-02-13 | 13F | Morgan Stanley | 112.821 | -50,67 | 2.725 | -49,32 | ||||
| 2026-02-10 | 13F | State of Wyoming | 10.000 | 331,41 | 242 | 346,30 | ||||
| 2026-02-17 | 13F | Algert Global Llc | 0 | -100,00 | 0 | |||||
| 2026-01-26 | 13F | Cwm, Llc | 598 | 15,89 | 0 | |||||
| 2026-02-13 | 13F | Police & Firemen's Retirement System of New Jersey | 8.194 | 0,00 | 198 | 2,60 | ||||
| 2026-02-17 | 13F | California State Teachers Retirement System | 1.825 | -1,08 | 44 | 2,33 | ||||
| 2026-01-29 | 13F | Vanguard Group Inc | 1.711.213 | 1,72 | 41.326 | 4,53 | ||||
| 2026-04-16 | 13F | SG Americas Securities, LLC | 5.687 | -59,91 | 0 | |||||
| 2026-02-17 | 13F | Two Sigma Investments, Lp | 183.266 | 0,28 | 4.426 | 3,05 | ||||
| 2026-02-05 | 13F | Amalgamated Bank | 931 | 3,44 | 0 | |||||
| 2026-02-17 | 13F | Engineers Gate Manager LP | 19.204 | -0,38 | 464 | 2,21 | ||||
| 2026-02-17 | 13F/A | RBF Capital, LLC | 499.070 | 0,00 | 12.053 | 2,76 | ||||
| 2026-04-06 | 13F | GAMMA Investing LLC | 1.007 | 2,97 | 41 | 73,91 | ||||
| 2026-02-11 | 13F | Ameritas Investment Partners, Inc. | 2.731 | 66 | ||||||
| 2026-01-15 | 13F | Nisa Investment Advisors, Llc | 458 | 0,00 | 11 | 10,00 | ||||
| 2026-02-13 | 13F | Quarry LP | 320 | 8 | ||||||
| 2026-02-11 | 13F | Deutsche Bank Ag\ | 23.293 | 4,67 | 563 | 7,66 | ||||
| 2026-02-13 | 13F | Natixis | 19.900 | 481 | ||||||
| 2026-02-04 | 13F | Versor Investments LP | 11.200 | 270 | ||||||
| 2026-02-17 | 13F | Optiver Holding B.V. | 181 | -12,98 | 4 | 0,00 | ||||
| 2026-02-17 | 13F | Auxier Asset Management | 236.544 | -0,02 | 5.713 | 2,75 | ||||
| 2026-02-17 | 13F | Russell Investments Group, Ltd. | 2.523 | -97,56 | 61 | -97,53 | ||||
| 2026-02-12 | 13F | Nuveen, LLC | 60.637 | 0,00 | 1.464 | 2,81 | ||||
| 2026-02-17 | 13F | Prelude Capital Management, Llc | 193.411 | 3,08 | 4.671 | 5,92 | ||||
| 2025-11-14 | 13F | Verition Fund Management LLC | 0 | -100,00 | 0 | |||||
| 2026-02-17 | 13F | Creative Planning | 14.922 | 58,69 | 360 | 63,64 | ||||
| 2026-02-17 | 13F | Driehaus Capital Management Llc | 443.031 | 10,31 | 10.699 | 13,37 | ||||
| 2026-01-23 | 13F | Stanley-Laman Group, Ltd. | 0 | -100,00 | 0 | |||||
| 2026-02-06 | 13F | EverSource Wealth Advisors, LLC | 504 | 3.260,00 | 12 | |||||
| 2026-02-17 | 13F | Boothbay Fund Management, Llc | 103.286 | 4,08 | 2.494 | 6,95 | ||||
| 2026-03-04 | 13F | SHP Wealth Management | 50 | 1 | ||||||
| 2026-01-29 | 13F | IMC-Chicago, LLC | Call | 17.200 | 415 | |||||
| 2026-02-11 | 13F | Jpmorgan Chase & Co | 14.074 | -2,67 | 340 | 0,00 | ||||
| 2026-02-17 | 13F | Harvest Investment Services, LLC | 114.900 | 2,66 | 2.775 | 5,48 | ||||
| 2026-02-11 | 13F | Simplex Trading, Llc | 2.201 | -34,12 | 53 | |||||
| 2026-02-03 | 13F | McIlrath & Eck, LLC | 2.267 | -19,47 | 55 | -18,18 | ||||
| 2026-02-17 | 13F | Atom Investors LP | 0 | -100,00 | 0 | |||||
| 2026-02-17 | 13F | Susquehanna International Group, Llp | Call | 0 | -100,00 | 0 | ||||
| 2026-02-11 | 13F | Simplex Trading, Llc | Call | 5.700 | 714,29 | 138 | ||||
| 2026-02-12 | 13F | Dimensional Fund Advisors Lp | 786.800 | -2,31 | 19.002 | 0,40 | ||||
| 2026-02-17 | 13F | Tower Research Capital LLC (TRC) | 1.087 | -53,25 | 26 | -51,85 | ||||
| 2026-04-15 | 13F | Steadtrust LLC | 28.540 | -5,93 | 1.161 | 58,61 | ||||
| 2026-02-10 | 13F | Acadian Asset Management Llc | 15.008 | -82,78 | 0 | -100,00 | ||||
| 2026-01-26 | 13F | Whittier Trust Co | 213 | 0,00 | 5 | 25,00 | ||||
| 2026-02-13 | 13F | Ubs Asset Management Americas Inc | 17 | 0 | ||||||
| 2026-02-09 | 13F | Quest Partners LLC | 947 | 1,18 | 23 | 4,76 | ||||
| 2026-01-30 | 13F | Us Bancorp \de\ | 43 | 1 | ||||||
| 2026-02-11 | 13F | Simplex Trading, Llc | Put | 0 | -100,00 | 0 | ||||
| 2026-02-17 | 13F | MIRAE ASSET GLOBAL ETFS HOLDINGS Ltd. | 13.753 | 0,89 | 332 | 3,75 | ||||
| 2025-11-14 | 13F | Petrus Trust Company, LTA | 0 | -100,00 | 0 | |||||
| 2026-04-07 | 13F | Farther Finance Advisors, LLC | 4 | 0 | ||||||
| 2026-02-12 | 13F | Hrt Financial Lp | 52.968 | -52,68 | 1 | -50,00 | ||||
| 2026-02-17 | 13F | Perritt Capital Management Inc | 38.800 | 0,00 | 937 | 2,85 | ||||
| 2026-02-04 | 13F | First Eagle Investment Management, LLC | 778.630 | 0,52 | 18.804 | 3,30 | ||||
| 2026-02-10 | 13F | Sittner & Nelson, Llc | 50 | 1 | ||||||
| 2025-11-12 | 13F | First Trust Advisors Lp | 0 | -100,00 | 0 | -100,00 | ||||
| 2026-02-13 | 13F | Wells Fargo & Company/mn | 34.515 | 80,66 | 834 | 85,94 | ||||
| 2026-02-09 | 13F | Legal & General Group Plc | 5.542 | -2,57 | 134 | 0,00 | ||||
| 2026-02-04 | 13F | Pacific Ridge Capital Partners, LLC | 303.558 | -2,88 | 7.331 | -0,20 | ||||
| 2026-02-10 | 13F | Bank of New York Mellon Corp | 77.622 | -1,45 | 1.875 | 1,30 | ||||
| 2026-02-12 | 13F | Skopos Labs, Inc. | 0 | -100,00 | 0 | |||||
| 2026-02-17 | 13F | Captrust Financial Advisors | 13.562 | -5,04 | 328 | -2,39 | ||||
| 2026-02-03 | 13F | Channel Wealth Llc | 20.759 | -44,10 | 501 | -42,55 | ||||
| 2026-02-12 | 13F | BlackRock, Inc. | 2.207.303 | 2,90 | 53.306 | 5,74 | ||||
| 2025-12-09 | 13F/A | Tudor Investment Corp Et Al | 0 | -100,00 | 0 | -100,00 | ||||
| 2026-02-17 | 13F | Raymond James Financial Inc | 8.351 | -8,37 | 202 | -6,07 | ||||
| 2026-04-21 | 13F | Huntleigh Advisors, Inc. | 52.744 | 2.146 | ||||||
| 2026-02-19 | 13F | Invesco Ltd. | 178.892 | 275,04 | 4.320 | 285,71 | ||||
| 2026-02-12 | 13F | New York State Common Retirement Fund | 8.600 | 0,00 | 208 | 2,48 | ||||
| 2025-11-14 | 13F | Numerai GP LLC | 0 | -100,00 | 0 | |||||
| 2026-02-13 | 13F | Mariner, LLC | 134.006 | -23,69 | 3.236 | -21,57 | ||||
| 2026-04-24 | 13F | Strs Ohio | 18.200 | -34,06 | 740 | 11,11 | ||||
| 2026-04-21 | 13F | Wasatch Advisors Inc | 777.351 | -30,33 | 31.623 | 17,35 |
Other Listings
| US:LINC | 39,11 $ |