Grundlæggende statistik
| Institutionelle aktier (lange) | 17.010.060 - 27,13% (ex 13D/G) - change of -0,84MM shares -4,69% MRQ |
| Institutionel værdi (lang) | $ 10.800 USD ($1000) |
Institutionelt ejerskab og aktionærer
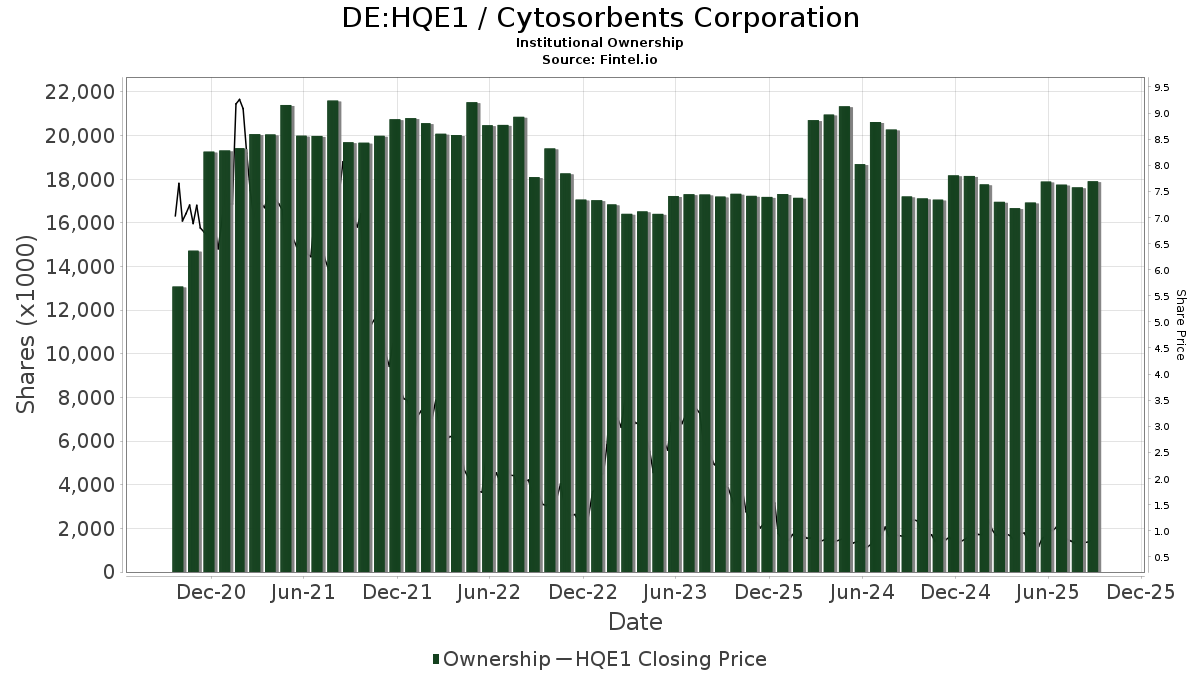
Cytosorbents Corporation (DE:HQE1) har 54 institutionelle ejere og aktionærer, der har indsendt 13D/G- eller 13F-formularer til Securities Exchange Commission (SEC). Disse institutioner har i alt 17,010,060 aktier. Største aktionærer omfatter Avenir Corp, Vanguard Group Inc, Skylands Capital, LLC, Neuberger Berman Group LLC, CM Management, LLC, BlackRock, Inc., Group One Trading, L.p., Sargent Investment Group, LLC, Geode Capital Management, Llc, and IMC-Chicago, LLC .
Cytosorbents Corporation (DB:HQE1) institutionel ejerskabsstruktur viser aktuelle positioner i virksomheden efter institutioner og fonde, samt seneste ændringer i positionsstørrelse. Større aktionærer kan omfatte individuelle investorer, investeringsforeninger, hedgefonde eller institutioner. Skema 13D angiver, at investoren besidder (eller besidder) mere end 5 % af virksomheden og har til hensigt (eller har til hensigt at) aktivt at forfølge en ændring i forretningsstrategi. Skema 13G indikerer en passiv investering på over 5%.
The share price as of April 2, 2026 is 0,44 / share. Previously, on April 9, 2025, the share price was 0,82 / share. This represents a decline of 46,72% over that period.
Fondens stemningsscore
Fund Sentiment Score (fka Ownership Accumulation Score) finder de aktier, der bliver mest købt af fonde. Det er resultatet af en sofistikeret, multi-faktor kvantitativ model, der identificerer virksomheder med de højeste niveauer af institutionel akkumulering. Scoringsmodellen bruger en kombination af den samlede stigning i oplyste ejere, ændringerne i porteføljeallokeringer i disse ejere og andre målinger. Tallet går fra 0 til 100, hvor højere tal indikerer et højere niveau af akkumulering for sine jævnaldrende, og 50 er gennemsnittet.
Opdateringsfrekvens: Dagligt
Se Ownership Explorer, som giver en liste over højest rangerende virksomheder.
AI+ Ask Fintel’s AI assistant about Cytosorbents Corporation.
Select a question to share a public post with an AI-crafted answer.
Thinking of good questions…
13F og NPORT arkivering
Detaljer om 13F-arkivering er gratis. Detaljer om NP-ansøgninger kræver et premium-medlemskab. Grønne rækker angiver nye positioner. Røde rækker angiver lukkede positioner. Klik på linket ikon for at se den fulde transaktionshistorik.
Opgrader
for at låse premium-data op og eksportere til Excel ![]() .
.
| Fil dato | Kilde | Investor | Type | Gennemsnitlig pris (Øst) |
Aktier | Δ Aktier (%) |
Rapporteret Værdi ($1000) |
Δ Værdi (%) |
Port Alloc (%) |
|
|---|---|---|---|---|---|---|---|---|---|---|
| 2026-02-17 | 13F | Susquehanna International Group, Llp | 83.363 | -15,13 | 53 | -41,76 | ||||
| 2026-02-17 | 13F | Millennium Management Llc | 10.205 | 7 | ||||||
| 2026-02-17 | 13F | XTX Topco Ltd | 29.682 | 19 | ||||||
| 2026-03-03 | 13F | NWF Advisory Services Inc. | 104.139 | 0,00 | 67 | -31,96 | ||||
| 2026-02-13 | 13F | Neuberger Berman Group LLC | 1.625.640 | 1,73 | 1.040 | -30,27 | ||||
| 2026-02-13 | 13F | MAI Capital Management | 233 | 0,00 | 0 | |||||
| 2026-02-17 | 13F | Two Sigma Securities, Llc | 0 | -100,00 | 0 | -100,00 | ||||
| 2026-01-29 | 13F | IMC-Chicago, LLC | Call | 564.900 | -45,71 | 18.557 | -45,92 | |||
| 2026-02-17 | 13F | Creative Planning | 21.295 | -0,75 | 14 | -35,00 | ||||
| 2025-11-14 | 13F | Citadel Advisors Llc | Call | 0 | -100,00 | 0 | -100,00 | |||
| 2026-02-02 | 13F | Your Advocates Ltd., LLP | 250 | 0,00 | 0 | |||||
| 2026-02-13 | 13F | Avenir Corp | 5.230.099 | 2,90 | 3.343 | -29,58 | ||||
| 2026-02-11 | 13F | LPL Financial LLC | 23.066 | 54,74 | 15 | 7,69 | ||||
| 2026-02-13 | 13F | Centiva Capital, LP | 0 | -100,00 | 0 | |||||
| 2026-02-13 | 13F | Wells Fargo & Company/mn | 730 | 0,00 | 0 | |||||
| 2026-02-13 | 13F | State Street Corp | 159.293 | 0,00 | 102 | -31,76 | ||||
| 2026-02-17 | 13F | ACT Capital Management, LLLP | 0 | -100,00 | 0 | |||||
| 2025-10-27 | 13F | N.E.W. Advisory Services LLC | 0 | -100,00 | 0 | |||||
| 2026-02-17 | 13F | Fmr Llc | 384 | 0 | ||||||
| 2026-02-06 | 13F | Global Retirement Partners, LLC | 2.265 | 1 | ||||||
| 2025-11-20 | 13F | Maven Securities LTD | Call | 0 | -100,00 | 0 | ||||
| 2026-02-17 | 13F | Tower Research Capital LLC (TRC) | 2.170 | -61,30 | 1 | -80,00 | ||||
| 2026-03-25 | 13F/A | Barclays Plc | 0 | -100,00 | 0 | |||||
| 2026-02-17 | 13F | Northern Trust Corp | 92.540 | 1,07 | 59 | -30,59 | ||||
| 2026-02-11 | 13F | Jpmorgan Chase & Co | Call | 350.000 | -69,57 | 11.498 | -69,69 | |||
| 2025-11-12 | 13F | Simplex Trading, Llc | 0 | -100,00 | 0 | |||||
| 2025-11-12 | 13F | CIBC Bancorp USA Inc. | 172.649 | 161 | ||||||
| 2026-01-28 | 13F | Chicago Partners Investment Group LLC | 0 | -100,00 | 0 | |||||
| 2026-02-06 | 13F | Gsa Capital Partners Llp | 148.374 | 32,22 | 0 | |||||
| 2025-12-08 | 13F | NWF Advisory Services Inc. | Call | 0 | -100,00 | 0 | ||||
| 2026-02-13 | 13F | Morgan Stanley | 116.480 | 8,60 | 74 | -26,00 | ||||
| 2026-01-28 | 13F | Key Client Fiduciary Advisors, LLC | 78.457 | 0,00 | 50 | -31,51 | ||||
| 2026-01-29 | 13F | Comerica Bank | 4.376 | 23,03 | 3 | -33,33 | ||||
| 2026-02-10 | 13F | Goldman Sachs Group Inc | 35.952 | -40,63 | 23 | -60,71 | ||||
| 2026-02-19 | 13F | Atomi Financial Group, Inc. | 27.443 | 0,00 | 18 | -32,00 | ||||
| 2026-01-29 | 13F | Vanguard Group Inc | 2.204.294 | 0,00 | 1.409 | -31,58 | ||||
| 2026-02-10 | 13F | Bnp Paribas Arbitrage, Sa | 20 | 0,00 | 0 | |||||
| 2026-02-12 | 13F | BlackRock, Inc. | 770.551 | 0,75 | 493 | -31,09 | ||||
| 2026-02-13 | 13F | Kestra Advisory Services, LLC | 0 | -100,00 | 0 | |||||
| 2026-02-13 | 13F | Pathstone Holdings, LLC | 499.955 | 320 | ||||||
| 2026-02-13 | 13F | Stifel Financial Corp | 48.000 | 0,00 | 31 | -31,82 | ||||
| 2026-02-09 | 13F | Geode Capital Management, Llc | 603.767 | 0,39 | 386 | -31,19 | ||||
| 2026-02-17 | 13F | Royal Bank Of Canada | 0 | -100,00 | 0 | |||||
| 2026-02-09 | 13F | Texas Capital Bank Wealth Management Services Inc | 11.000 | 7 | ||||||
| 2025-11-14 | 13F | Squarepoint Ops LLC | 0 | -100,00 | 0 | |||||
| 2026-02-17 | 13F | Bank Of America Corp /de/ | 38.706 | 0,01 | 25 | -33,33 | ||||
| 2026-02-12 | 13F | CIBC Private Wealth Group, LLC | 172.649 | 0,00 | 110 | -31,68 | ||||
| 2026-02-18 | 13F | EP Wealth Advisors, Inc. | 28.000 | 0,00 | 18 | -51,43 | ||||
| 2026-04-07 | 13F | Farther Finance Advisors, LLC | 6 | 0 | ||||||
| 2026-02-13 | 13F | Sargent Investment Group, LLC | 612.000 | -17,15 | 391 | -43,33 | ||||
| 2026-02-13 | 13F | First National Bank Of Omaha | 15.225 | 10 | ||||||
| 2026-02-06 | 13F | Pnc Financial Services Group, Inc. | 31 | 0,00 | 0 | |||||
| 2026-02-17 | 13F | Warren Averett Asset Management, LLC | 55.556 | 0,00 | 36 | -31,37 | ||||
| 2026-02-17 | 13F | Citadel Advisors Llc | 149.279 | 127,25 | 95 | 55,74 | ||||
| 2026-02-17 | 13F | Advisor Group Holdings, Inc. | 130.419 | 0,00 | 83 | -31,97 | ||||
| 2026-02-11 | 13F | Group One Trading, L.p. | Call | 737.700 | -42,32 | 24.233 | -42,55 | |||
| 2026-02-17 | 13F | Jones Financial Companies Lllp | 93 | -84,32 | 0 | |||||
| 2026-02-23 | 13F | Virtu Financial LLC | 10.780 | 0 | ||||||
| 2026-01-26 | 13F | Merit Financial Group, LLC | 15.297 | 0,00 | 10 | -35,71 | ||||
| 2026-02-03 | 13F | SBI Securities Co., Ltd. | 0 | -100,00 | 0 | |||||
| 2026-02-11 | 13F | Jpmorgan Chase & Co | 372 | 0,00 | 0 | |||||
| 2026-02-13 | 13F | Sei Investments Co | 0 | -100,00 | 0 | |||||
| 2026-02-04 | 13F | Seelaus Asset Management LLC | 17.300 | 0,00 | 11 | -31,25 | ||||
| 2026-02-12 | 13F | Renaissance Technologies Llc | 100.120 | -25,73 | 64 | -49,60 | ||||
| 2026-02-02 | 13F | CM Management, LLC | 1.476.500 | 14,62 | 944 | -21,61 | ||||
| 2025-10-31 | 13F | Ping Capital Management, Inc. | Call | 0 | -100,00 | 0 | ||||
| 2026-02-14 | 13F | Rockefeller Capital Management L.P. | 2.566 | 156,60 | 2 | |||||
| 2026-01-29 | 13F | UBS Group AG | 115.272 | 0,06 | 74 | -31,78 | ||||
| 2026-02-11 | 13F | Simplex Trading, Llc | Call | 430.700 | -81,59 | 14.151 | 18.277,92 | |||
| 2026-02-17 | 13F | Raymond James Financial Inc | 108.702 | -0,02 | 69 | -31,68 | ||||
| 2026-01-30 | 13F | Skylands Capital, LLC | 1.854.515 | -12,82 | 1.185 | -40,36 |
Other Listings
| US:CTSO | 0,64 $ |