Grundlæggende statistik
| Institutionelle aktier (lange) | 14.962.093 - 20,96% (ex 13D/G) - change of -0,30MM shares -1,97% MRQ |
| Institutionel værdi (lang) | $ 56.201 USD ($1000) |
Institutionelt ejerskab og aktionærer
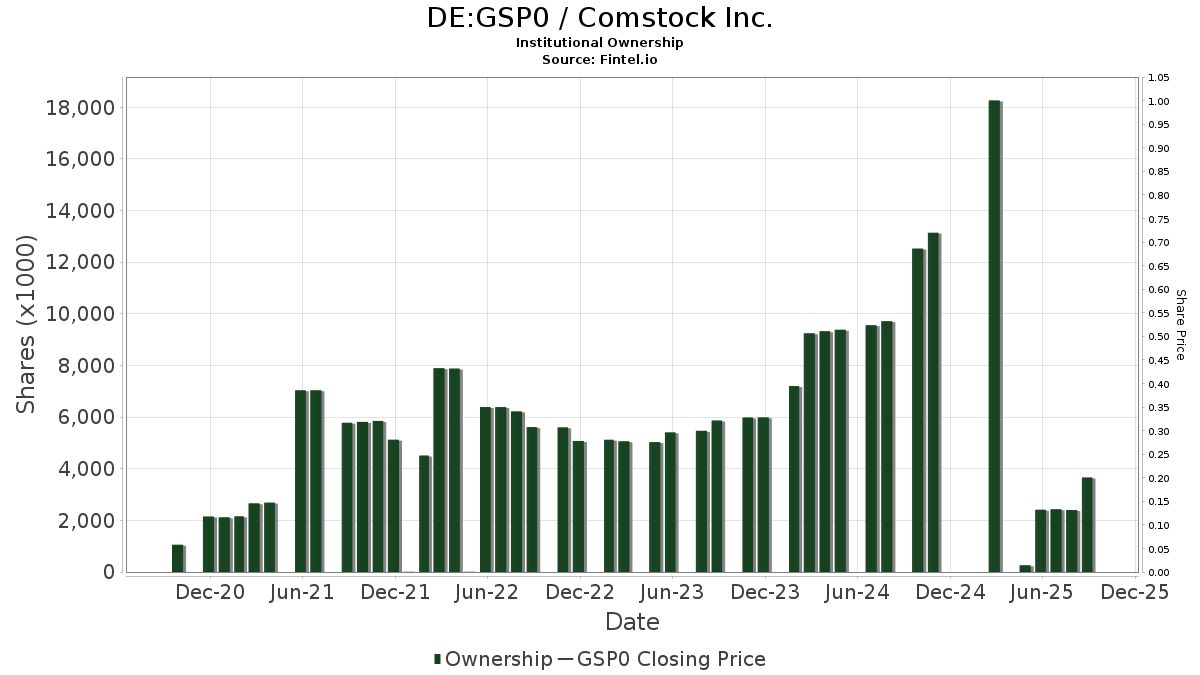
Comstock Inc. (DE:GSP0) har 78 institutionelle ejere og aktionærer, der har indsendt 13D/G- eller 13F-formularer til Securities Exchange Commission (SEC). Disse institutioner har i alt 14,962,093 aktier. Største aktionærer omfatter Vanguard Group Inc, Hood River Capital Management LLC, Gratia Capital, Llc, Caption Management, LLC, Citadel Advisors Llc, Susquehanna International Group, Llp, Marshall Wace, Llp, Diametric Capital, LP, Corsair Capital Management, L.p., and Geode Capital Management, Llc .
Comstock Inc. (DB:GSP0) institutionel ejerskabsstruktur viser aktuelle positioner i virksomheden efter institutioner og fonde, samt seneste ændringer i positionsstørrelse. Større aktionærer kan omfatte individuelle investorer, investeringsforeninger, hedgefonde eller institutioner. Skema 13D angiver, at investoren besidder (eller besidder) mere end 5 % af virksomheden og har til hensigt (eller har til hensigt at) aktivt at forfølge en ændring i forretningsstrategi. Skema 13G indikerer en passiv investering på over 5%.
The share price as of March 3, 2026 is 2,64 / share. Previously, on March 10, 2025, the share price was 2,33 / share. This represents an increase of 13,30% over that period.
Fondens stemningsscore
Fund Sentiment Score (fka Ownership Accumulation Score) finder de aktier, der bliver mest købt af fonde. Det er resultatet af en sofistikeret, multi-faktor kvantitativ model, der identificerer virksomheder med de højeste niveauer af institutionel akkumulering. Scoringsmodellen bruger en kombination af den samlede stigning i oplyste ejere, ændringerne i porteføljeallokeringer i disse ejere og andre målinger. Tallet går fra 0 til 100, hvor højere tal indikerer et højere niveau af akkumulering for sine jævnaldrende, og 50 er gennemsnittet.
Opdateringsfrekvens: Dagligt
Se Ownership Explorer, som giver en liste over højest rangerende virksomheder.
AI+ Ask Fintel’s AI assistant about Comstock Inc..
Select a question to share a public post with an AI-crafted answer.
Thinking of good questions…
13F og NPORT arkivering
Detaljer om 13F-arkivering er gratis. Detaljer om NP-ansøgninger kræver et premium-medlemskab. Grønne rækker angiver nye positioner. Røde rækker angiver lukkede positioner. Klik på linket ikon for at se den fulde transaktionshistorik.
Opgrader
for at låse premium-data op og eksportere til Excel ![]() .
.
| Fil dato | Kilde | Investor | Type | Gennemsnitlig pris (Øst) |
Aktier | Δ Aktier (%) |
Rapporteret Værdi ($1000) |
Δ Værdi (%) |
Port Alloc (%) |
|
|---|---|---|---|---|---|---|---|---|---|---|
| 2026-02-17 | 13F | Northern Trust Corp | 118.216 | 15,89 | 444 | 27,59 | ||||
| 2025-09-25 | NP | DFAS - Dimensional U.S. Small Cap ETF | 18.946 | 0,00 | 62 | 0,00 | ||||
| 2026-02-11 | 13F | LPL Financial LLC | 19.650 | -30,06 | 74 | -23,96 | ||||
| 2026-02-17 | 13F | Advisor Group Holdings, Inc. | 1.667 | -13,49 | 6 | 50,00 | ||||
| 2026-02-13 | 13F | Motiv8 Investments LLC | 20 | 0 | ||||||
| 2026-02-13 | 13F | Morgan Stanley | 56.878 | -83,32 | 214 | -81,73 | ||||
| 2026-02-17 | 13F | Tower Research Capital LLC (TRC) | 20.958 | 13.249,04 | 79 | |||||
| 2026-02-13 | 13F | Diametric Capital, LP | 631.525 | 330,30 | 2.375 | 373,85 | ||||
| 2026-02-17 | 13F | Citadel Advisors Llc | Put | 78.700 | -48,00 | 296 | -42,94 | |||
| 2026-02-17 | 13F | Citadel Advisors Llc | Call | 104.200 | 20,05 | 392 | 32,09 | |||
| 2026-02-13 | 13F | Alyeska Investment Group, L.P. | 0 | -100,00 | 0 | -100,00 | ||||
| 2026-01-29 | 13F | Vanguard Group Inc | 2.421.251 | 13,60 | 9.104 | 24,89 | ||||
| 2026-02-17 | 13F | Citadel Advisors Llc | 804.127 | -16,86 | 3.024 | -8,59 | ||||
| 2026-02-10 | 13F | Goldman Sachs Group Inc | 205.251 | 16,33 | 772 | 27,86 | ||||
| 2026-02-11 | 13F | Group One Trading, L.p. | 37.206 | 183,22 | 140 | 215,91 | ||||
| 2026-02-17 | 13F | Quadrature Capital Ltd | 39.151 | -60,29 | 147 | -56,51 | ||||
| 2026-01-29 | 13F | UBS Group AG | 60.864 | -65,14 | 229 | -61,81 | ||||
| 2026-02-17 | 13F | Gratia Capital, Llc | 1.156.423 | 20,78 | 4.348 | 32,80 | ||||
| 2026-02-17 | 13F | Prelude Capital Management, Llc | 101.109 | 149,03 | 380 | 175,36 | ||||
| 2025-09-25 | NP | DFFVX - U.S. Targeted Value Portfolio - Institutional Class This fund is a listed as child fund of Dimensional Fund Advisors Lp and if that institution has disclosed ownership in this security, then these positions will not be double counted when calculating total shares and total value | 5.664 | 19 | ||||||
| 2026-02-17 | 13F | Millennium Management Llc | 80.587 | 303 | ||||||
| 2026-02-12 | 13F | Cruiser Capital Advisors, Llc | 50.776 | -67,24 | 191 | -64,15 | ||||
| 2025-10-23 | 13F | Kingswood Wealth Advisors, Llc | 0 | -100,00 | 0 | -100,00 | ||||
| 2025-11-12 | 13F | Creekmur Asset Management LLC | 3.343 | 0,00 | 11 | -8,33 | ||||
| 2026-02-06 | 13F | IFP Advisors, Inc | 600 | 0,00 | 2 | 0,00 | ||||
| 2026-02-12 | 13F | Aristides Capital LLC | 0 | -100,00 | 0 | -100,00 | ||||
| 2026-02-17 | 13F | Susquehanna International Group, Llp | Call | 117.200 | 1,91 | 441 | 11,96 | |||
| 2025-09-25 | NP | DFAC - Dimensional U.S. Core Equity 2 ETF | 10.133 | 0,00 | 33 | 43,48 | ||||
| 2026-01-16 | 13F | FNY Investment Advisers, LLC | Call | 0 | -100,00 | 0 | ||||
| 2026-02-23 | 13F | Virtu Financial LLC | 0 | -100,00 | 0 | |||||
| 2026-02-17 | 13F | Susquehanna International Group, Llp | 691.997 | 225,44 | 2.602 | 257,77 | ||||
| 2026-02-17 | 13F | Susquehanna International Group, Llp | Put | 70.300 | -31,88 | 264 | -25,00 | |||
| 2026-02-12 | 13F | Dimensional Fund Advisors Lp | 190.824 | 118,13 | 718 | 140,13 | ||||
| 2026-02-12 | 13F | BlackRock, Inc. | 281.101 | 27,60 | 1.057 | 40,24 | ||||
| 2026-01-29 | 13F | Marathon Capital Management | 17.500 | -12,50 | 66 | -4,41 | ||||
| 2026-02-11 | 13F | Jpmorgan Chase & Co | 24.682 | 93 | ||||||
| 2026-02-17 | 13F | XTX Topco Ltd | 49.821 | -19,50 | 187 | -11,37 | ||||
| 2026-02-12 | 13F | Renaissance Technologies Llc | 0 | -100,00 | 0 | -100,00 | ||||
| 2026-02-13 | 13F | Wells Fargo & Company/mn | 558 | 0,00 | 2 | 100,00 | ||||
| 2026-02-17 | 13F | Raymond James Financial Inc | 52.338 | 0,00 | 197 | 10,11 | ||||
| 2026-02-09 | 13F | Geode Capital Management, Llc | 547.877 | 20,08 | 2.061 | 32,12 | ||||
| 2026-02-17 | 13F | Caption Management, LLC | Call | 1.000.000 | 0,00 | 3.760 | 9,94 | |||
| 2026-02-17 | 13F | Jones Financial Companies Lllp | 1.846 | 0,00 | 7 | 0,00 | ||||
| 2026-02-17 | 13F | Caption Management, LLC | 234.999 | 0,00 | 884 | 9,96 | ||||
| 2026-02-11 | 13F | Gwn Securities Inc. | 0 | -100,00 | 0 | |||||
| 2025-11-14 | 13F | Wolverine Trading, Llc | Call | 39.600 | -13,91 | 140 | -20,90 | |||
| 2026-02-10 | 13F | Belvedere Trading LLC | 0 | -100,00 | 0 | -100,00 | ||||
| 2025-11-14 | 13F | Wolverine Trading, Llc | Put | 17.400 | 62 | |||||
| 2025-09-25 | NP | DFAT - Dimensional U.S. Targeted Value ETF | 10.769 | 332,84 | 35 | 600,00 | ||||
| 2026-02-17 | 13F | Royal Bank Of Canada | 478.215 | 1.798 | ||||||
| 2026-02-13 | 13F | Centiva Capital, LP | 0 | -100,00 | 0 | -100,00 | ||||
| 2026-02-17 | 13F | Qube Research & Technologies Ltd | 75.856 | 234,59 | 285 | 270,13 | ||||
| 2026-02-17 | 13F | Two Sigma Securities, Llc | 26.139 | 98 | ||||||
| 2026-02-14 | 13F | Torrey Growth & Income Advisors | 29.269 | 76,09 | 110 | 96,43 | ||||
| 2026-02-17 | 13F | Lighthouse Investment Partners, LLC | 29.700 | 112 | ||||||
| 2026-01-26 | 13F | Quadrant Private Wealth Management, LLC | 95.080 | -0,08 | 358 | 9,85 | ||||
| 2026-02-13 | 13F | American Century Companies Inc | 45.109 | 77,19 | 170 | 94,25 | ||||
| 2026-02-13 | 13F | Sei Investments Co | 440.582 | 15,36 | 1.657 | 26,80 | ||||
| 2026-01-29 | 13F | Quent Capital, LLC | 4 | 0,00 | 0 | |||||
| 2026-02-13 | 13F | Hudson Bay Capital Management LP | 77.678 | 292 | ||||||
| 2026-01-20 | 13F | Signaturefd, Llc | 2.122 | 4,95 | 8 | 16,67 | ||||
| 2026-02-17 | 13F | Advisory Services Network, LLC | 0 | -100,00 | 0 | |||||
| 2026-02-13 | 13F | Barclays Plc | 399 | 2 | ||||||
| 2026-02-13 | 13F | Mariner, LLC | 249.428 | 41,04 | 938 | 55,13 | ||||
| 2026-02-17 | 13F | Two Sigma Investments, Lp | 68.807 | 18,63 | 259 | 30,30 | ||||
| 2025-11-14 | 13F | Larson Financial Group LLC | 0 | -100,00 | 0 | |||||
| 2026-02-13 | 13F | Mml Investors Services, Llc | 12.000 | 45 | ||||||
| 2026-02-13 | 13F | Citigroup Inc | 7.984 | 75,55 | 30 | 100,00 | ||||
| 2026-02-12 | 13F | Jane Street Group, Llc | Put | 61.100 | 230 | |||||
| 2026-02-12 | 13F | Jane Street Group, Llc | 353.873 | 62,93 | 1.331 | 79,25 | ||||
| 2025-11-07 | 13F | Pnc Financial Services Group, Inc. | 0 | -100,00 | 0 | |||||
| 2026-02-13 | 13F | State Street Corp | 217.314 | 14,13 | 817 | 25,50 | ||||
| 2026-02-11 | 13F | Simplex Trading, Llc | 13.013 | -68,26 | 49 | |||||
| 2025-11-14 | 13F | Cubist Systematic Strategies, LLC | 0 | -100,00 | 0 | |||||
| 2026-02-13 | 13F | Marshall Wace, Llp | 669.494 | 3.811,05 | 2.517 | 4.239,66 | ||||
| 2026-02-17 | 13F | Balyasny Asset Management Llc | 26.495 | 100 | ||||||
| 2026-02-17 | 13F | Cable Car Capital LLC | 0 | -100,00 | 0 | -100,00 | ||||
| 2025-09-25 | NP | DFSTX - U.s. Small Cap Portfolio - Institutional Class This fund is a listed as child fund of Dimensional Fund Advisors Lp and if that institution has disclosed ownership in this security, then these positions will not be double counted when calculating total shares and total value | 6.142 | 20 | ||||||
| 2026-02-17 | 13F | Corsair Capital Management, L.p. | 550.118 | 0,02 | 2.068 | 9,94 | ||||
| 2026-02-03 | 13F | Costello Asset Management, INC | 150 | 0,00 | 1 | |||||
| 2025-09-25 | NP | DFSCX - U.s. Micro Cap Portfolio - Institutional Class This fund is a listed as child fund of Dimensional Fund Advisors Lp and if that institution has disclosed ownership in this security, then these positions will not be double counted when calculating total shares and total value | 8.699 | 29 | ||||||
| 2026-02-13 | 13F | MYDA Advisors LLC | 180.000 | -48,57 | 677 | -43,53 | ||||
| 2026-02-09 | 13F | Jefferies Financial Group Inc. | 10.396 | 39 | ||||||
| 2026-02-14 | 13F | Rockefeller Capital Management L.P. | 7.000 | 133,33 | 26 | 160,00 | ||||
| 2026-02-09 | 13F | Harbour Investments, Inc. | 156 | 0,00 | 1 | |||||
| 2026-01-20 | 13F | Savvy Advisors, Inc. | Call | 22.700 | 34 | |||||
| 2026-02-17 | 13F | Apis Capital Advisors, LLC | 484.000 | -3,97 | 1.820 | 5,57 | ||||
| 2026-02-02 | 13F | Danske Bank A/s | 1 | 0,00 | 0 | |||||
| 2025-10-24 | 13F | Citizens Financial Group Inc/ri | 0 | -100,00 | 0 | -100,00 | ||||
| 2026-02-13 | 13F | OMERS ADMINISTRATION Corp | 103.400 | 733,87 | 389 | 823,81 | ||||
| 2026-02-17 | 13F | Hood River Capital Management LLC | 1.815.267 | -0,98 | 6.825 | 8,87 | ||||
| 2026-02-13 | 13F | Charles Schwab Investment Management Inc | 56.249 | 211 | ||||||
| 2026-01-23 | 13F | Westside Investment Management, Inc. | 200 | 0,00 | 1 | |||||
| 2026-02-17 | 13F | 683 Capital Management, LLC | 276.243 | 1.039 | ||||||
| 2026-01-20 | 13F | Savvy Advisors, Inc. | 467.615 | 1,15 | 1.758 | 11,27 | ||||
| 2026-02-18 | 13F | VGI Partners Ltd | 0 | -100,00 | 0 | -100,00 | ||||
| 2026-02-03 | 13F | SBI Securities Co., Ltd. | 263 | 0,00 | 1 | |||||
| 2026-02-13 | 13F | Squarepoint Ops LLC | 81.516 | 62,25 | 306 | 78,95 | ||||
| 2026-02-17 | 13F | Bank Of America Corp /de/ | 28.829 | -83,22 | 108 | -81,60 | ||||
| 2026-01-21 | 13F | Country Trust Bank | 72 | 0,00 | 0 | |||||
| 2025-09-26 | NP | USMIX - Extended Market Index Fund | 3.304 | 11 | ||||||
| 2026-02-10 | 13F | Bnp Paribas Arbitrage, Sa | 35.760 | 1.302,90 | 134 | 1.575,00 |
Other Listings
| US:LODE | 3,27 $ |