Grundlæggende statistik
| Institutionelle aktier (lange) | 12.858.174 - 19,15% (ex 13D/G) - change of 2,23MM shares 20,96% MRQ |
| Institutionel værdi (lang) | $ 27.134 USD ($1000) |
Institutionelt ejerskab og aktionærer
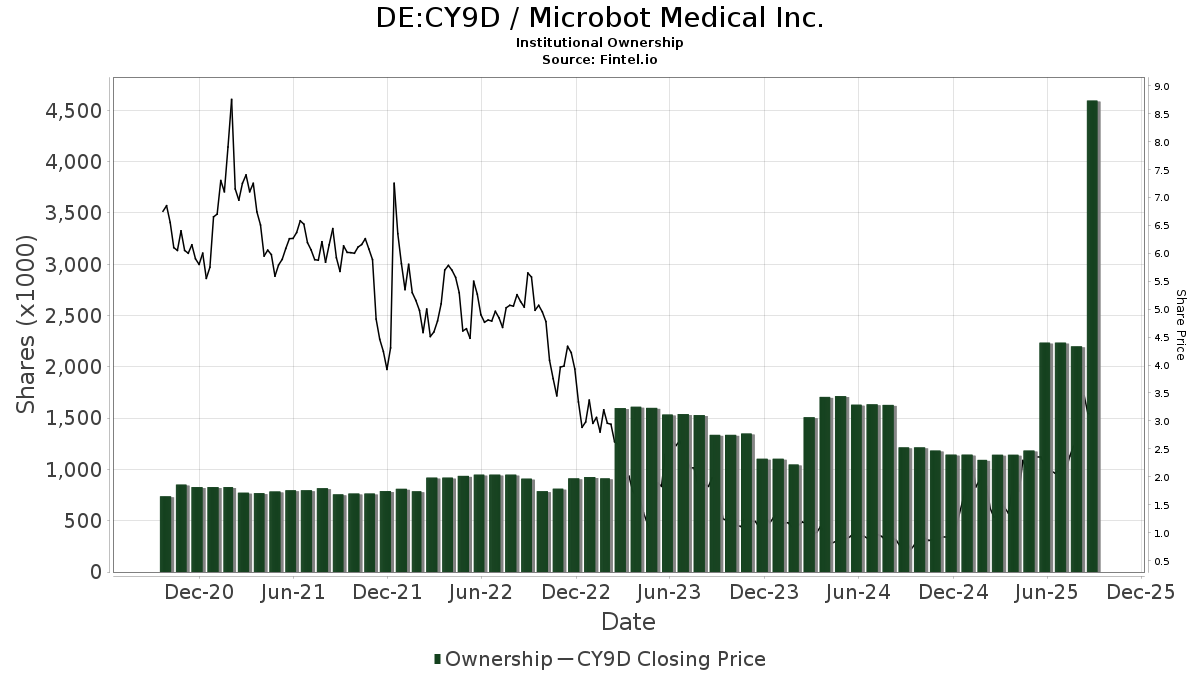
Microbot Medical Inc. (DE:CY9D) har 77 institutionelle ejere og aktionærer, der har indsendt 13D/G- eller 13F-formularer til Securities Exchange Commission (SEC). Disse institutioner har i alt 12,858,174 aktier. Største aktionærer omfatter Vanguard Group Inc, CIBC Private Wealth Group, LLC, CIBC Bancorp USA Inc., Susquehanna International Group, Llp, BlackRock, Inc., Geode Capital Management, Llc, DnB Asset Management AS, UBS Group AG, Stifel Financial Corp, and 683 Capital Management, LLC .
Microbot Medical Inc. (DB:CY9D) institutionel ejerskabsstruktur viser aktuelle positioner i virksomheden efter institutioner og fonde, samt seneste ændringer i positionsstørrelse. Større aktionærer kan omfatte individuelle investorer, investeringsforeninger, hedgefonde eller institutioner. Skema 13D angiver, at investoren besidder (eller besidder) mere end 5 % af virksomheden og har til hensigt (eller har til hensigt at) aktivt at forfølge en ændring i forretningsstrategi. Skema 13G indikerer en passiv investering på over 5%.
The share price as of March 12, 2026 is 2,39 / share. Previously, on March 13, 2025, the share price was 1,38 / share. This represents an increase of 73,55% over that period.
Fondens stemningsscore
Fund Sentiment Score (fka Ownership Accumulation Score) finder de aktier, der bliver mest købt af fonde. Det er resultatet af en sofistikeret, multi-faktor kvantitativ model, der identificerer virksomheder med de højeste niveauer af institutionel akkumulering. Scoringsmodellen bruger en kombination af den samlede stigning i oplyste ejere, ændringerne i porteføljeallokeringer i disse ejere og andre målinger. Tallet går fra 0 til 100, hvor højere tal indikerer et højere niveau af akkumulering for sine jævnaldrende, og 50 er gennemsnittet.
Opdateringsfrekvens: Dagligt
Se Ownership Explorer, som giver en liste over højest rangerende virksomheder.
AI+ Ask Fintel’s AI assistant about Microbot Medical Inc..
Select a question to share a public post with an AI-crafted answer.
Thinking of good questions…
13F og NPORT arkivering
Detaljer om 13F-arkivering er gratis. Detaljer om NP-ansøgninger kræver et premium-medlemskab. Grønne rækker angiver nye positioner. Røde rækker angiver lukkede positioner. Klik på linket ikon for at se den fulde transaktionshistorik.
Opgrader
for at låse premium-data op og eksportere til Excel ![]() .
.
| Fil dato | Kilde | Investor | Type | Gennemsnitlig pris (Øst) |
Aktier | Δ Aktier (%) |
Rapporteret Værdi ($1000) |
Δ Værdi (%) |
Port Alloc (%) |
|
|---|---|---|---|---|---|---|---|---|---|---|
| 2026-02-13 | 13F | Citigroup Inc | 4.866 | 10 | ||||||
| 2026-02-23 | 13F | Virtu Financial LLC | 58.674 | 0 | ||||||
| 2026-02-11 | 13F | LPL Financial LLC | 47.932 | -3,95 | 96 | -37,50 | ||||
| 2026-02-17 | 13F | Cetera Investment Advisers | 29.313 | 38,85 | 59 | -9,37 | ||||
| 2026-02-13 | 13F | Evelyn Partners Investment Management Services Ltd | 1 | 0,00 | 0 | |||||
| 2026-02-09 | 13F | Hartland & Co., LLC | 275 | 1 | ||||||
| 2026-02-09 | 13F | Harbour Investments, Inc. | 1 | 0 | ||||||
| 2025-10-24 | 13F | Hemington Wealth Management | 1 | 0,00 | 0 | |||||
| 2026-02-17 | 13F | Millennium Management Llc | 46.805 | -44,79 | 94 | -63,95 | ||||
| 2026-02-17 | 13F | Man Group plc | 17.424 | 35 | ||||||
| 2025-11-14 | 13F | Cubist Systematic Strategies, LLC | 38.985 | 119 | ||||||
| 2025-11-14 | 13F | Larson Financial Group LLC | 0 | -100,00 | 0 | |||||
| 2025-12-16 | 13F | Garde Capital, Inc. | 0 | -100,00 | 0 | |||||
| 2026-02-17 | 13F | Caption Management, LLC | Call | 20.000 | 40 | |||||
| 2026-01-14 | 13F | Wolff Wiese Magana Llc | 1 | 0,00 | 0 | |||||
| 2026-02-13 | 13F | Morgan Stanley | 68.972 | 779,41 | 138 | 495,65 | ||||
| 2025-11-12 | 13F | CIBC Bancorp USA Inc. | 1.454.000 | 4.435 | ||||||
| 2026-02-09 | 13F | SLT Holdings LLC | 0 | -100,00 | 0 | -100,00 | ||||
| 2026-01-07 | 13F | Hilltop National Bank | 0 | -100,00 | 0 | |||||
| 2026-02-17 | 13F | Royal Bank Of Canada | 1.901 | 0,00 | 4 | -33,33 | ||||
| 2025-11-12 | 13F | American Century Companies Inc | 0 | -100,00 | 0 | -100,00 | ||||
| 2026-02-10 | 13F | Goldman Sachs Group Inc | 34.463 | 69 | ||||||
| 2026-02-17 | 13F | XTX Topco Ltd | 31.389 | 63 | ||||||
| 2026-02-19 | 13F | Invesco Ltd. | 24.512 | 49 | ||||||
| 2026-01-23 | 13F | Avion Wealth | 1.500 | 50,00 | 0 | |||||
| 2026-02-12 | 13F | Jane Street Group, Llc | 197.408 | 1,94 | 395 | -33,22 | ||||
| 2026-02-12 | 13F | Jane Street Group, Llc | Put | 11.300 | -31,52 | 23 | -56,00 | |||
| 2026-01-20 | 13F | Signaturefd, Llc | 18 | 0,00 | 0 | |||||
| 2026-02-13 | 13F | OMERS ADMINISTRATION Corp | 146.000 | 292 | ||||||
| 2026-02-17 | 13F | Two Sigma Investments, Lp | 61.098 | -2,09 | 122 | -35,79 | ||||
| 2026-02-12 | 13F | Renaissance Technologies Llc | 24.560 | 49 | ||||||
| 2026-02-13 | 13F | Caitong International Asset Management Co., Ltd | 7.668 | 15 | ||||||
| 2026-03-04 | 13F | SHP Wealth Management | 50 | 0 | ||||||
| 2026-02-12 | 13F | CIBC Private Wealth Group, LLC | 1.480.000 | 1,79 | 2.960 | -33,24 | ||||
| 2026-02-17 | 13F | Hilltop Holdings Inc. | 35.764 | 0,00 | 72 | -34,86 | ||||
| 2026-01-28 | 13F | Cornerstone Advisory, LLC | 10.000 | 0,00 | 20 | -33,33 | ||||
| 2026-02-09 | 13F | Geode Capital Management, Llc | 761.995 | 54,44 | 1.524 | 1,26 | ||||
| 2026-02-12 | 13F | Wealthspire Advisors, LLC | 0 | -100,00 | 0 | |||||
| 2026-02-12 | 13F | Steward Partners Investment Advisory, Llc | 1.300 | 0,00 | 3 | -33,33 | ||||
| 2026-02-17 | 13F | Bridgeway Capital Management Inc | 111.000 | 222 | ||||||
| 2026-02-17 | 13F | Lighthouse Investment Partners, LLC | 41.100 | 82 | ||||||
| 2026-02-17 | 13F | Heights Capital Management, Inc | 0 | -100,00 | 0 | -100,00 | ||||
| 2026-01-23 | 13F | U.S. Capital Wealth Advisors, LLC | 10.000 | -11,50 | 20 | -41,18 | ||||
| 2026-02-10 | 13F | Foundations Investment Advisors, LLC | 0 | -100,00 | 0 | -100,00 | ||||
| 2026-01-26 | 13F | Cwm, Llc | 2.747 | 0,00 | 0 | |||||
| 2026-02-13 | 13F | Stifel Financial Corp | 265.990 | 68,89 | 532 | 10,63 | ||||
| 2026-02-04 | 13F | Atlantic Union Bankshares Corp | 1 | 0,00 | 0 | |||||
| 2026-02-12 | 13F | Scotia Capital Inc. | 26.476 | 0,00 | 53 | -35,00 | ||||
| 2025-11-14 | 13F | Raymond James Financial Inc | 0 | -100,00 | 0 | |||||
| 2026-02-17 | 13F | Two Sigma Securities, Llc | 10.613 | -64,79 | 21 | -76,92 | ||||
| 2026-01-22 | 13F | Bfsg, Llc | 5.500 | 0,00 | 11 | -31,25 | ||||
| 2026-02-17 | 13F | Jones Financial Companies Lllp | 1 | 0,00 | 0 | |||||
| 2026-02-13 | 13F | SRS Capital Advisors, Inc. | 688 | 124,84 | 1 | |||||
| 2026-02-04 | 13F | Ameritas Advisory Services, LLC | 0 | -100,00 | 0 | -100,00 | ||||
| 2026-02-12 | 13F | Federation des caisses Desjardins du Quebec | 1 | -99,93 | 0 | -100,00 | ||||
| 2026-02-13 | 13F | Beacon Capital Management, LLC | 22.000 | 0,00 | 44 | -34,33 | ||||
| 2026-02-17 | 13F | Oxford Asset Management Llp | 0 | -100,00 | 0 | -100,00 | ||||
| 2026-02-13 | 13F | Vontobel Holding Ltd. | 30.862 | 0,00 | 62 | -35,11 | ||||
| 2025-11-14 | 13F | Point72 (DIFC) Ltd | 244 | 1 | ||||||
| 2026-02-12 | 13F | StoneX Group Inc. | 12.046 | 24 | ||||||
| 2026-01-29 | 13F | UBS Group AG | 445.132 | 119,44 | 890 | 44,01 | ||||
| 2026-01-29 | 13F | Lee Danner & Bass Inc | 10.250 | -3,63 | 20 | -37,50 | ||||
| 2026-02-06 | 13F | Leonteq Securities AG | 660 | 0,00 | 1 | -50,00 | ||||
| 2026-01-29 | 13F | Vanguard Group Inc | 3.329.721 | 42,08 | 6.659 | -6,83 | ||||
| 2026-02-10 | 13F | Financially Speaking Inc | 1 | 0,00 | 0 | |||||
| 2026-01-29 | 13F/A | Lazari Capital Management, Inc. | 21.255 | 0,00 | 43 | -34,37 | ||||
| 2026-02-13 | 13F | Wexford Capital Lp | 0 | -100,00 | 0 | -100,00 | ||||
| 2025-11-14 | 13F | Wolverine Trading, Llc | Call | 104.900 | 239,48 | 336 | 335,06 | |||
| 2025-11-14 | 13F | Wolverine Trading, Llc | Put | 23.600 | 76 | |||||
| 2026-02-13 | 13F | National Bank Of Canada /fi/ | 0 | -100,00 | 0 | -100,00 | ||||
| 2026-02-17 | 13F | 683 Capital Management, LLC | 256.033 | 512 | ||||||
| 2026-02-11 | 13F | Group One Trading, L.p. | 0 | -100,00 | 0 | -100,00 | ||||
| 2026-02-05 | 13F | Allworth Financial LP | 130 | 0,00 | 0 | |||||
| 2026-02-17 | 13F | Citadel Advisors Llc | Put | 127.800 | 719,23 | 256 | 442,55 | |||
| 2026-02-17 | 13F | Citadel Advisors Llc | Call | 100.400 | -58,63 | 201 | -72,97 | |||
| 2026-02-06 | 13F | EverSource Wealth Advisors, LLC | 357 | 0,00 | 1 | -100,00 | ||||
| 2026-02-10 | 13F | Quantbot Technologies LP | 13.683 | 27 | ||||||
| 2026-02-12 | 13F | EAM Investors, LLC | 0 | -100,00 | 0 | -100,00 | ||||
| 2026-02-12 | 13F | BlackRock, Inc. | 868.652 | 77,21 | 1.737 | 16,19 | ||||
| 2026-02-13 | 13F | Wells Fargo & Company/mn | 8.735 | -15,77 | 17 | -45,16 | ||||
| 2026-02-17 | 13F | Bank Of America Corp /de/ | 4.239 | -81,69 | 8 | -88,57 | ||||
| 2026-02-17 | 13F | Susquehanna International Group, Llp | Call | 0 | -100,00 | 0 | -100,00 | |||
| 2025-11-12 | 13F | Transce3nd, LLC | 0 | -100,00 | 0 | |||||
| 2026-02-13 | 13F | State Street Corp | 207.169 | -0,62 | 414 | -34,80 | ||||
| 2026-02-12 | 13F | EHP Funds Inc. | 0 | -100,00 | 0 | -100,00 | ||||
| 2026-02-17 | 13F | Advisor Group Holdings, Inc. | 3.004 | -77,42 | 6 | -88,00 | ||||
| 2026-02-12 | 13F | AlphaCentric Advisors LLC | 200.000 | 400,00 | 400 | 809,09 | ||||
| 2026-02-11 | 13F | Simplex Trading, Llc | 71.227 | 254,56 | 142 | |||||
| 2026-02-17 | 13F | Susquehanna International Group, Llp | Put | 218.700 | -25,43 | 437 | -51,12 | |||
| 2026-02-17 | 13F | Susquehanna International Group, Llp | 1.245.123 | -0,39 | 2.490 | -34,68 | ||||
| 2026-02-17 | 13F | Northern Trust Corp | 114.205 | 42,57 | 228 | -6,56 | ||||
| 2026-02-17 | 13F | Tower Research Capital LLC (TRC) | 1.061 | -97,06 | 2 | -98,18 | ||||
| 2026-02-10 | 13F | Envestnet Asset Management Inc | 35.663 | 10,53 | 71 | -27,55 | ||||
| 2026-02-13 | 13F | Squarepoint Ops LLC | 24.526 | 102,58 | 49 | 36,11 | ||||
| 2026-02-03 | 13F | SBI Securities Co., Ltd. | 2.631 | -26,32 | 5 | -50,00 | ||||
| 2026-02-05 | 13F | DnB Asset Management AS | 677.498 | 178,09 | 1.355 | 82,23 | ||||
| 2026-02-17 | 13F | Zacks Investment Management | 0 | -100,00 | 0 | -100,00 | ||||
| 2026-02-17 | 13F | Qube Research & Technologies Ltd | 131.696 | 263 | ||||||
| 2026-02-17 | 13F | Fmr Llc | 1 | -99,68 | 0 | |||||
| 2026-02-13 | 13F | Barclays Plc | 59.377 | 5.937.600,00 | 119 |
Other Listings
| US:MBOT | 2,73 $ |