Grundlæggende statistik
| Institutionelle ejere | 58 total, 58 long only, 0 short only, 0 long/short - change of -3,33% MRQ |
| Del pris | 3,58 |
| Gennemsnitlig porteføljeallokering | 0.0045 % - change of 11,88% MRQ |
| Institutionelle aktier (lange) | 3.356.005 (ex 13D/G) - change of -0,27MM shares -7,42% MRQ |
| Institutionel værdi (lang) | $ 9.237 USD ($1000) |
Institutionelt ejerskab og aktionærer
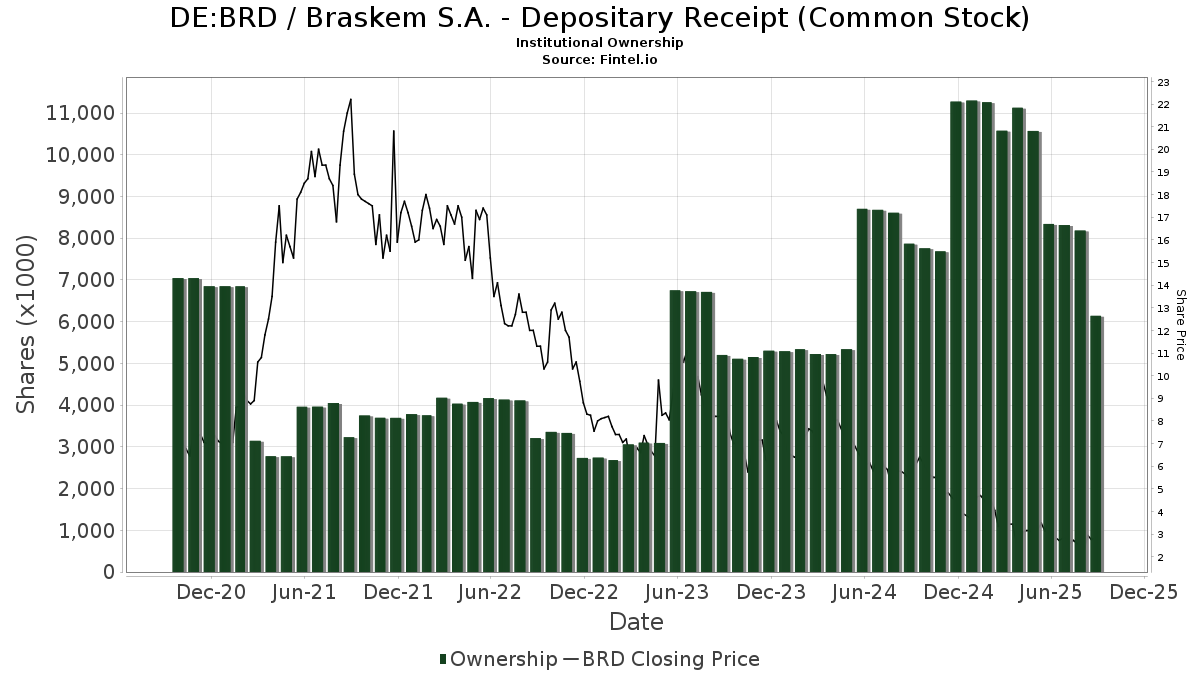
Braskem S.A. - Depositary Receipt (Common Stock) (DE:BRD) har 58 institutionelle ejere og aktionærer, der har indsendt 13D/G- eller 13F-formularer til Securities Exchange Commission (SEC). Disse institutioner har i alt 3,356,005 aktier. Største aktionærer omfatter Vanguard Group Inc, State Street Corp, BlackRock, Inc., UBS Group AG, VEIEX - Vanguard Emerging Markets Stock Index Fund Investor Shares, Renaissance Technologies Llc, Jane Street Group, Llc, VGTSX - Vanguard Total International Stock Index Fund Investor Shares, X-Square Capital, LLC, and Marshall Wace, Llp .
Braskem S.A. - Depositary Receipt (Common Stock) (DB:BRD) institutionel ejerskabsstruktur viser aktuelle positioner i virksomheden efter institutioner og fonde, samt seneste ændringer i positionsstørrelse. Større aktionærer kan omfatte individuelle investorer, investeringsforeninger, hedgefonde eller institutioner. Skema 13D angiver, at investoren besidder (eller besidder) mere end 5 % af virksomheden og har til hensigt (eller har til hensigt at) aktivt at forfølge en ændring i forretningsstrategi. Skema 13G indikerer en passiv investering på over 5%.
The share price as of March 4, 2026 is 3,58 / share. Previously, on March 6, 2025, the share price was 3,40 / share. This represents an increase of 5,29% over that period.
Fondens stemningsscore
Fund Sentiment Score (fka Ownership Accumulation Score) finder de aktier, der bliver mest købt af fonde. Det er resultatet af en sofistikeret, multi-faktor kvantitativ model, der identificerer virksomheder med de højeste niveauer af institutionel akkumulering. Scoringsmodellen bruger en kombination af den samlede stigning i oplyste ejere, ændringerne i porteføljeallokeringer i disse ejere og andre målinger. Tallet går fra 0 til 100, hvor højere tal indikerer et højere niveau af akkumulering for sine jævnaldrende, og 50 er gennemsnittet.
Opdateringsfrekvens: Dagligt
Se Ownership Explorer, som giver en liste over højest rangerende virksomheder.
AI+ Ask Fintel’s AI assistant about Braskem S.A. - Depositary Receipt (Common Stock).
Select a question to share a public post with an AI-crafted answer.
Thinking of good questions…
13F og NPORT arkivering
Detaljer om 13F-arkivering er gratis. Detaljer om NP-ansøgninger kræver et premium-medlemskab. Grønne rækker angiver nye positioner. Røde rækker angiver lukkede positioner. Klik på linket ikon for at se den fulde transaktionshistorik.
Opgrader
for at låse premium-data op og eksportere til Excel ![]() .
.
| Fil dato | Kilde | Investor | Type | Gennemsnitlig pris (Øst) |
Aktier | Δ Aktier (%) |
Rapporteret Værdi ($1000) |
Δ Værdi (%) |
Port Alloc (%) |
|
|---|---|---|---|---|---|---|---|---|---|---|
| 2026-02-13 | 13F | Marshall Wace, Llp | 161.631 | 477 | ||||||
| 2026-02-13 | 13F | OMERS ADMINISTRATION Corp | 0 | -100,00 | 0 | |||||
| 2026-01-23 | 13F | Farther Finance Advisors, LLC | 337 | 1 | ||||||
| 2026-02-12 | 13F | Hrt Financial Lp | 65.092 | 0 | ||||||
| 2026-02-13 | 13F | State Street Corp | 311.507 | 7,16 | 919 | 30,58 | ||||
| 2026-02-17 | 13F | Dark Forest Capital Management Lp | 0 | -100,00 | 0 | |||||
| 2025-09-25 | NP | VEIEX - Vanguard Emerging Markets Stock Index Fund Investor Shares | 272.413 | 0,00 | 861 | -15,10 | ||||
| 2026-02-17 | 13F | Brevan Howard Capital Management LP | 0 | -100,00 | 0 | |||||
| 2025-11-14 | 13F | Tudor Investment Corp Et Al | 0 | -100,00 | 0 | |||||
| 2026-02-13 | 13F | JustInvest LLC | 10.530 | 1,50 | 31 | -79,05 | ||||
| 2026-02-13 | 13F | American Century Companies Inc | 113.641 | 0,81 | 335 | 23,16 | ||||
| 2026-02-13 | 13F | Van Eck Associates Corp | 28.537 | -40,99 | 0 | |||||
| 2026-02-17 | 13F | Dv Equities, Llc | 200 | 1 | ||||||
| 2026-01-20 | 13F | Signaturefd, Llc | 13.524 | 50,08 | 40 | 85,71 | ||||
| 2026-02-03 | 13F | SBI Securities Co., Ltd. | 5.212 | -4,09 | 15 | 15,38 | ||||
| 2026-02-17 | 13F | Tower Research Capital LLC (TRC) | 878 | -74,18 | 3 | -75,00 | ||||
| 2026-02-23 | 13F | Virtu Financial LLC | 0 | -100,00 | 0 | |||||
| 2026-02-17 | 13F | Point72 Asset Management, L.P. | 55.251 | -60,07 | 163 | -51,50 | ||||
| 2026-02-12 | 13F | Quadrant Capital Group Llc | 12.809 | 222,08 | 38 | 311,11 | ||||
| 2026-02-13 | 13F | Cornerstone Financial Management LLC | 168 | 0 | ||||||
| 2026-02-06 | 13F | EverSource Wealth Advisors, LLC | 8.579 | 444,35 | 25 | 733,33 | ||||
| 2025-11-14 | 13F | Vident Advisory, LLC | 0 | -100,00 | 0 | |||||
| 2026-02-17 | 13F | Dauntless Investment Group, LLC | 312 | 1 | ||||||
| 2025-11-14 | 13F | Aquatic Capital Management LLC | 0 | -100,00 | 0 | |||||
| 2026-01-30 | 13F | Us Bancorp \de\ | 68 | 0 | ||||||
| 2026-02-13 | 13F | Caitong International Asset Management Co., Ltd | 0 | -100,00 | 0 | |||||
| 2026-01-26 | 13F | Mirae Asset Global Investments Co., Ltd. | 3.361 | -2,27 | 10 | 12,50 | ||||
| 2026-01-27 | 13F | WealthCollab, LLC | 549 | 2 | ||||||
| 2026-02-12 | 13F | BlackRock, Inc. | 291.983 | 22,55 | 861 | 49,48 | ||||
| 2026-02-04 | 13F | Centric Wealth Management | 0 | -100,00 | 0 | |||||
| 2026-02-13 | 13F | Rhumbline Advisers | 3.766 | 17,17 | 11 | 57,14 | ||||
| 2026-02-17 | 13F | Schonfeld Strategic Advisors LLC | 78.641 | 232 | ||||||
| 2026-02-17 | 13F | Millennium Management Llc | 38.061 | 112 | ||||||
| 2026-02-12 | 13F | Ci Investments Inc. | 0 | -100,00 | 0 | |||||
| 2026-02-13 | 13F | VPR Management LLC | 9.510 | 0,00 | 28 | 21,74 | ||||
| 2026-02-13 | 13F | Wells Fargo & Company/mn | 1.301 | -60,58 | 4 | -57,14 | ||||
| 2026-02-12 | 13F | Jane Street Group, Llc | 220.898 | 193,58 | 652 | 257,69 | ||||
| 2026-02-13 | 13F | Morgan Stanley | 20.471 | -94,01 | 60 | -92,74 | ||||
| 2026-02-11 | 13F | X-Square Capital, LLC | 185.000 | 117,65 | 1 | |||||
| 2026-02-10 | 13F | Goldman Sachs Group Inc | 90.892 | -55,29 | 268 | -45,42 | ||||
| 2026-02-11 | 13F | SmartHarvest Portfolios, LLC | 36.381 | 107 | ||||||
| 2026-02-11 | 13F | LPL Financial LLC | 134.827 | 115,60 | 398 | 162,91 | ||||
| 2026-02-13 | 13F | MAI Capital Management | 210 | 0,00 | 1 | |||||
| 2026-02-13 | 13F | Citigroup Inc | 0 | -100,00 | 0 | |||||
| 2025-11-12 | 13F | R Squared Ltd | 0 | -100,00 | 0 | |||||
| 2025-09-25 | NP | DEXC - Dimensional Emerging Markets ex China Core Equity ETF | 1.200 | 0,00 | 4 | -25,00 | ||||
| 2025-09-25 | NP | VGTSX - Vanguard Total International Stock Index Fund Investor Shares | 213.266 | 0,00 | 674 | -15,13 | ||||
| 2025-09-25 | NP | DFEM - Dimensional Emerging Markets Core Equity 2 ETF | 0 | -100,00 | 0 | -100,00 | ||||
| 2026-02-11 | 13F | Group One Trading, L.p. | 83 | 0,00 | 0 | |||||
| 2025-11-13 | 13F | Jump Financial, LLC | 0 | -100,00 | 0 | |||||
| 2025-11-12 | 13F/A | Norges Bank | 41.063 | 0,00 | 301 | 14,02 | ||||
| 2026-02-12 | 13F | Dimensional Fund Advisors Lp | 0 | -100,00 | 0 | |||||
| 2026-02-13 | 13F | Centiva Capital, LP | 25.923 | 72,82 | 76 | 111,11 | ||||
| 2025-11-13 | 13F | Riggs Asset Managment Co. Inc. | 0 | -100,00 | 0 | |||||
| 2026-02-12 | 13F | Renaissance Technologies Llc | 265.488 | 619,48 | 783 | 779,78 | ||||
| 2025-09-25 | NP | VEU - Vanguard FTSE All-World ex-US Index Fund ETF Shares | 60.561 | 0,00 | 191 | -15,11 | ||||
| 2026-02-13 | 13F | Squarepoint Ops LLC | 26.928 | 79 | ||||||
| 2026-01-29 | 13F | Vanguard Group Inc | 560.466 | 0,00 | 1.653 | 21,90 | ||||
| 2026-02-05 | 13F | Allworth Financial LP | 857 | -54,24 | 3 | -50,00 | ||||
| 2026-02-17 | 13F | Mirabella Financial Services Llp | 51.600 | 152 | ||||||
| 2026-01-29 | 13F | UBS Group AG | 288.093 | -63,23 | 850 | -55,20 | ||||
| 2026-02-11 | 13F | Parallel Advisors, LLC | 4.656 | 80,54 | 14 | 116,67 | ||||
| 2025-11-04 | 13F | Jones Financial Companies Lllp | 0 | -100,00 | 0 | |||||
| 2026-02-13 | 13F | Hurley Capital, LLC | 200 | 1 | ||||||
| 2025-11-14 | 13F | Raymond James Financial Inc | 0 | -100,00 | 0 | |||||
| 2026-02-04 | 13F | LRI Investments, LLC | 66 | 0,00 | 0 | |||||
| 2026-01-28 | 13F | Kapitalo Investimentos Ltda | 0 | -100,00 | 0 | |||||
| 2025-11-21 | 13F/A | Royal Bank Of Canada | 0 | -100,00 | 0 | |||||
| 2025-11-13 | 13F | Oaktree Capital Management Lp | 0 | -100,00 | 0 | -100,00 | ||||
| 2026-01-27 | 13F | Evergreen Capital Management Llc | 14.819 | 44 | ||||||
| 2026-02-17 | 13F | Citadel Advisors Llc | 59.781 | 176 | ||||||
| 2026-01-14 | 13F | Jfs Wealth Advisors, Llc | 535 | 0,00 | 2 | 0,00 | ||||
| 2026-02-12 | 13F | Banco BTG Pactual S.A. | 0 | -100,00 | 0 | |||||
| 2026-01-05 | 13F | GAMMA Investing LLC | 1.420 | -19,68 | 4 | 0,00 | ||||
| 2025-09-25 | NP | DFAX - Dimensional World ex U.S. Core Equity 2 ETF | 13.928 | 0,00 | 44 | -13,73 | ||||
| 2026-02-09 | 13F | Legal & General Group Plc | 11.635 | 0,00 | 34 | 21,43 | ||||
| 2026-02-17 | 13F | Bank Of America Corp /de/ | 28 | -80,42 | 0 | |||||
| 2026-02-10 | 13F | Eurizon Capital SGR S.p.A. | 35 | 0 | ||||||
| 2026-02-03 | 13F | Ballentine Partners, LLC | 35.604 | 153,00 | 105 | 208,82 | ||||
| 2026-02-17 | 13F | Creative Planning | 47.470 | -16,41 | 140 | 2,19 |
Other Listings
| US:BAK | 4,91 $ |