Grundlæggende statistik
| Institutionelle aktier (lange) | 138.266.510 - 53,22% (ex 13D/G) - change of -24,70MM shares -15,16% MRQ |
| Institutionel værdi (lang) | $ 326.526 USD ($1000) |
Institutionelt ejerskab og aktionærer
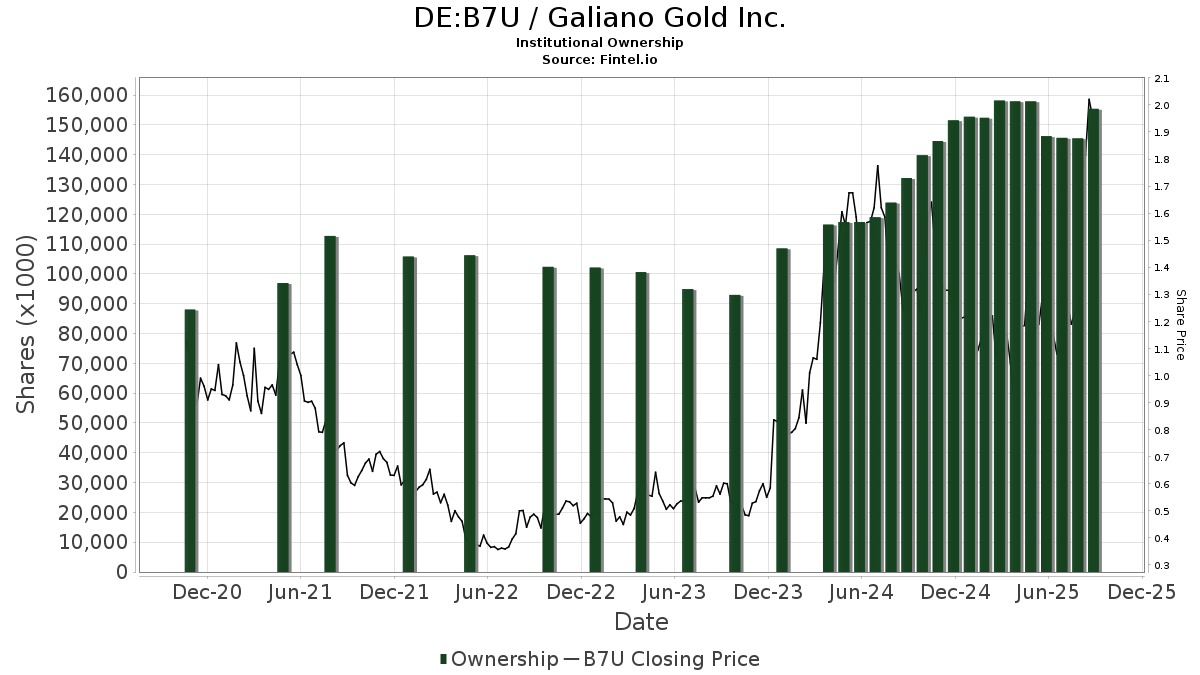
Galiano Gold Inc. (DE:B7U) har 91 institutionelle ejere og aktionærer, der har indsendt 13D/G- eller 13F-formularer til Securities Exchange Commission (SEC). Disse institutioner har i alt 138,266,510 aktier. Største aktionærer omfatter Donald Smith & Co., Inc., Ruffer LLP, Franklin Resources Inc, Mason Hill Advisors Llc, Pale Fire Capital SE, Aegis Financial Corp, Arrowstreet Capital, Limited Partnership, Millennium Management Llc, Renaissance Technologies Llc, and American Century Companies Inc .
Galiano Gold Inc. (DB:B7U) institutionel ejerskabsstruktur viser aktuelle positioner i virksomheden efter institutioner og fonde, samt seneste ændringer i positionsstørrelse. Større aktionærer kan omfatte individuelle investorer, investeringsforeninger, hedgefonde eller institutioner. Skema 13D angiver, at investoren besidder (eller besidder) mere end 5 % af virksomheden og har til hensigt (eller har til hensigt at) aktivt at forfølge en ændring i forretningsstrategi. Skema 13G indikerer en passiv investering på over 5%.
The share price as of April 24, 2026 is 2,06 / share. Previously, on April 28, 2025, the share price was 1,14 / share. This represents an increase of 81,05% over that period.
Fondens stemningsscore
Fund Sentiment Score (fka Ownership Accumulation Score) finder de aktier, der bliver mest købt af fonde. Det er resultatet af en sofistikeret, multi-faktor kvantitativ model, der identificerer virksomheder med de højeste niveauer af institutionel akkumulering. Scoringsmodellen bruger en kombination af den samlede stigning i oplyste ejere, ændringerne i porteføljeallokeringer i disse ejere og andre målinger. Tallet går fra 0 til 100, hvor højere tal indikerer et højere niveau af akkumulering for sine jævnaldrende, og 50 er gennemsnittet.
Opdateringsfrekvens: Dagligt
Se Ownership Explorer, som giver en liste over højest rangerende virksomheder.
AI+ Ask Fintel’s AI assistant about Galiano Gold Inc..
Select a question to share a public post with an AI-crafted answer.
Thinking of good questions…
13F og NPORT arkivering
Detaljer om 13F-arkivering er gratis. Detaljer om NP-ansøgninger kræver et premium-medlemskab. Grønne rækker angiver nye positioner. Røde rækker angiver lukkede positioner. Klik på linket ikon for at se den fulde transaktionshistorik.
Opgrader
for at låse premium-data op og eksportere til Excel ![]() .
.
| Fil dato | Kilde | Investor | Type | Gennemsnitlig pris (Øst) |
Aktier | Δ Aktier (%) |
Rapporteret Værdi ($1000) |
Δ Værdi (%) |
Port Alloc (%) |
|
|---|---|---|---|---|---|---|---|---|---|---|
| 2026-04-22 | 13F | Stone House Investment Management, LLC | 675 | 0,00 | 2 | 0,00 | ||||
| 2026-02-06 | 13F | HighTower Advisors, LLC | 25.010 | 0,00 | 63 | 16,67 | ||||
| 2026-02-10 | 13F | Quantbot Technologies LP | 158.076 | -52,84 | 400 | -45,64 | ||||
| 2026-02-17 | 13F | Graham Capital Management, L.P. | 0 | -100,00 | 0 | |||||
| 2026-02-17 | 13F | Anson Funds Management LP | 0 | -100,00 | 0 | |||||
| 2026-02-17 | 13F | Oxford Asset Management Llp | 46.159 | 117 | ||||||
| 2026-02-17 | 13F | Qube Research & Technologies Ltd | 257.250 | 13,49 | 651 | 31,05 | ||||
| 2026-02-04 | 13F | Tsfg, Llc | 0 | -100,00 | 0 | |||||
| 2026-02-06 | 13F | Global Retirement Partners, LLC | 200 | 1 | ||||||
| 2026-01-28 | 13F | Ruffer LLP | 14.305.507 | -13,88 | 36.479 | 0,85 | ||||
| 2026-02-13 | 13F | Prudential Financial Inc | 24.200 | -19,33 | 62 | -6,15 | ||||
| 2026-02-17 | 13F | Tudor Investment Corp Et Al | 0 | -100,00 | 0 | -100,00 | ||||
| 2026-02-12 | 13F | Jane Street Group, Llc | 1.467.551 | -54,46 | 3.713 | -47,40 | ||||
| 2026-02-13 | 13F | Mariner, LLC | 15.000 | 38 | ||||||
| 2026-02-12 | 13F | Jane Street Group, Llc | Put | 19.100 | 34,51 | 48 | 54,84 | |||
| 2026-02-11 | 13F | Group One Trading, L.p. | Put | 14.300 | -54,75 | 36 | -47,83 | |||
| 2026-02-13 | 13F | De Lisle Partners LLP | 543.453 | 22,55 | 1.383 | 43,46 | ||||
| 2026-02-11 | 13F | Group One Trading, L.p. | Call | 139.600 | -14,72 | 353 | -1,40 | |||
| 2026-02-17 | 13F | Amundi | 72.700 | 184 | ||||||
| 2026-04-07 | 13F | CoreCap Advisors, LLC | 30.000 | 0,00 | 75 | 0,00 | ||||
| 2026-02-13 | 13F | OMERS ADMINISTRATION Corp | 0 | -100,00 | 0 | |||||
| 2026-02-12 | 13F | Orvieto Partners, L.P. | 100.000 | 0,00 | 253 | 15,53 | ||||
| 2026-02-13 | 13F | Gts Securities Llc | 10.537 | 27 | ||||||
| 2025-11-14 | 13F | Cubist Systematic Strategies, LLC | 316.858 | 693 | ||||||
| 2026-01-29 | 13F | UBS Group AG | 382.459 | -70,87 | 968 | -66,37 | ||||
| 2026-02-13 | 13F | State Street Corp | 114.397 | -1,55 | 289 | 13,78 | ||||
| 2026-02-12 | 13F | Bank Of Montreal /can/ | 217.216 | -2,72 | 552 | 13,58 | ||||
| 2025-11-14 | 13F | Wolverine Trading, Llc | 45.628 | 102 | ||||||
| 2025-11-14 | 13F | Wolverine Trading, Llc | Call | 18.100 | 41 | |||||
| 2025-11-14 | 13F | Wolverine Trading, Llc | Put | 27.600 | 62 | |||||
| 2026-02-10 | 13F | Td Asset Management Inc | 349.966 | 891 | ||||||
| 2026-02-17 | 13F | DZ BANK AG Deutsche Zentral Genossenschafts Bank, Frankfurt am Main | 3.500.000 | 0,00 | 8.855 | 16,24 | ||||
| 2026-02-13 | 13F | Van Eck Associates Corp | 3.914.974 | 0,00 | 10 | 12,50 | ||||
| 2026-02-17 | 13F | Citadel Advisors Llc | Call | 78.000 | 461,15 | 197 | 556,67 | |||
| 2026-02-13 | 13F | Barclays Plc | 0 | -100,00 | 0 | |||||
| 2026-02-13 | 13F | Arrowstreet Capital, Limited Partnership | 6.199.984 | 19,99 | 15.723 | 39,26 | ||||
| 2026-02-17 | 13F | Citadel Advisors Llc | 1.730.687 | -57,82 | 4.379 | -51,27 | ||||
| 2026-02-17 | 13F | Citadel Advisors Llc | Put | 219.200 | 93,64 | 555 | 124,29 | |||
| 2026-02-13 | 13F | Diametric Capital, LP | 105.096 | 267 | ||||||
| 2026-02-11 | 13F | Buckingham Strategic Partners | 13.360 | -50,00 | 34 | -44,07 | ||||
| 2026-02-17 | 13F | Raymond James Financial Inc | 0 | -100,00 | 0 | |||||
| 2025-11-14 | 13F | Virtu Financial LLC | 0 | -100,00 | 0 | |||||
| 2026-02-09 | 13F | MMCAP International Inc. SPC | 0 | -100,00 | 0 | |||||
| 2026-02-17 | 13F | Prelude Capital Management, Llc | 16.832 | 43 | ||||||
| 2026-02-17 | 13F | Susquehanna International Group, Llp | 1.411.393 | 261,52 | 3.571 | 318,03 | ||||
| 2026-02-17 | 13F | Balyasny Asset Management Llc | 0 | -100,00 | 0 | |||||
| 2026-02-17 | 13F | Susquehanna International Group, Llp | Put | 98.300 | -14,00 | 249 | -0,80 | |||
| 2026-02-13 | 13F | Squarepoint Ops LLC | 108.384 | 274 | ||||||
| 2026-02-17 | 13F | Toronto Dominion Bank | 76.778 | -87,45 | 195 | -85,35 | ||||
| 2026-02-10 | 13F | Connor, Clark & Lunn Investment Management Ltd. | 3.445.273 | 31,74 | 8.761 | 53,90 | ||||
| 2026-02-17 | 13F | Susquehanna International Group, Llp | Call | 17.200 | -60,46 | 44 | -54,74 | |||
| 2026-02-12 | 13F | Renaissance Technologies Llc | 4.433.653 | 15,25 | 11.217 | 33,16 | ||||
| 2026-02-17 | 13F | D. E. Shaw & Co., Inc. | 3.486.100 | 70,58 | 8.865 | 99,30 | ||||
| 2026-02-10 | 13F | Goldman Sachs Group Inc | 1.370.576 | -1,02 | 3.468 | 14,35 | ||||
| 2026-02-12 | 13F | BlackRock, Inc. | 1 | 0,00 | 0 | |||||
| 2026-02-17 | 13F | Cetera Investment Advisers | 0 | -100,00 | 0 | |||||
| 2026-02-12 | 13F | Sprott Inc. | 76.662 | 28,06 | 194 | 47,33 | ||||
| 2026-02-06 | 13F | Pnc Financial Services Group, Inc. | 1.068 | 3 | ||||||
| 2026-02-17 | 13F | Tower Research Capital LLC (TRC) | 3.062 | 8 | ||||||
| 2026-02-12 | 13F | Commonwealth Equity Services, Llc | 0 | -100,00 | 0 | |||||
| 2026-02-18 | 13F | Mackenzie Financial Corp | 249.144 | 643 | ||||||
| 2026-02-17 | 13F | Public Employees Retirement System Of Ohio | 207.430 | 61,80 | 528 | 89,25 | ||||
| 2026-01-28 | 13F | U S Global Investors Inc | 2.193.071 | 5.548 | ||||||
| 2026-04-24 | 13F | Mason Hill Advisors Llc | 9.357.961 | -32,39 | 23.402 | -33,51 | ||||
| 2026-04-08 | 13F | Afg Fiduciary Services Limited Partnership | 26.500 | 67 | ||||||
| 2026-02-12 | 13F | Hrt Financial Lp | 21.327 | -83,42 | 0 | |||||
| 2026-02-12 | 13F | Federation des caisses Desjardins du Quebec | 2.400 | 6 | ||||||
| 2026-02-17 | 13F | Jain Global LLC | 0 | -100,00 | 0 | |||||
| 2026-02-17 | 13F | Two Sigma Advisers, Lp | 569.900 | -0,58 | 1.442 | 14,82 | ||||
| 2026-02-17 | 13F | Bank Of America Corp /de/ | 3.400.017 | -54,98 | 8.602 | -47,99 | ||||
| 2026-02-03 | 13F | SBI Securities Co., Ltd. | 1.812 | 0,00 | 5 | 33,33 | ||||
| 2026-02-11 | 13F | Jpmorgan Chase & Co | 154.710 | -8,97 | 391 | 5,11 | ||||
| 2026-02-12 | 13F | Dimensional Fund Advisors Lp | 91.462 | 1,72 | 231 | 17,86 | ||||
| 2026-02-17 | 13F | Advisor Group Holdings, Inc. | 2.800 | 0,00 | 7 | 16,67 | ||||
| 2026-02-17 | 13F | Quadrature Capital Ltd | 1.343.391 | -3,36 | 3.414 | 12,79 | ||||
| 2026-02-13 | 13F | Wells Fargo & Company/mn | 1.500 | 0,00 | 4 | 0,00 | ||||
| 2026-02-13 | 13F | Marshall Wace, Llp | 0 | -100,00 | 0 | |||||
| 2026-02-12 | 13F | StoneX Group Inc. | 12.000 | 0,00 | 30 | 15,38 | ||||
| 2026-02-17 | 13F | Point72 Asset Management, L.P. | 601.395 | 1.527 | ||||||
| 2026-02-17 | 13F | Boothbay Fund Management, Llc | 42.991 | -67,22 | 109 | -62,37 | ||||
| 2025-11-12 | 13F | Artisan Partners Limited Partnership | 0 | -100,00 | 0 | -100,00 | ||||
| 2026-02-17 | 13F | Russell Investments Group, Ltd. | 21.600 | 55 | ||||||
| 2025-11-12 | 13F | Stifel Financial Corp | 0 | -100,00 | 0 | |||||
| 2026-02-13 | 13F | Pale Fire Capital SE | 7.914.409 | 18,91 | 20.023 | 37,37 | ||||
| 2026-02-17 | 13F | Castle Hook Partners LP | 0 | -100,00 | 0 | |||||
| 2026-02-11 | 13F | Franklin Resources Inc | 12.017.262 | 11,03 | 30.557 | 29,70 | ||||
| 2026-02-17 | 13F | LMR Partners LLP | 53.525 | 136 | ||||||
| 2026-02-17 | 13F | Mirabella Financial Services Llp | 24.311 | -11,85 | 62 | 1,67 | ||||
| 2026-02-13 | 13F | Centiva Capital, LP | 13.675 | -93,74 | 35 | -92,89 | ||||
| 2026-02-13 | 13F | Dynamic Technology Lab Private Ltd | 77.964 | -71,87 | 197 | -67,55 | ||||
| 2026-02-10 | 13F | CIBC World Markets Inc. | 170.793 | 434 | ||||||
| 2026-01-27 | 13F | TD Waterhouse Canada Inc. | 9.619 | 20,24 | 24 | 41,18 | ||||
| 2026-02-13 | 13F | Morgan Stanley | 3.032.195 | 47,42 | 7.671 | 70,32 | ||||
| 2026-02-17 | 13F | Engineers Gate Manager LP | 15.185 | -21,81 | 38 | -9,52 | ||||
| 2026-02-12 | 13F | Aegis Financial Corp | 6.409.321 | -3,75 | 16.320 | 12,53 | ||||
| 2026-01-14 | 13F | Net Worth Advisory Group | 108.782 | 0,22 | 275 | 16,03 | ||||
| 2026-02-12 | 13F | Northwest & Ethical Investments L.P. | 0 | -100,00 | 0 | |||||
| 2026-03-03 | 13F/A | Caitong International Asset Management Co., Ltd | 21.573 | 55 | ||||||
| 2026-02-17 | 13F | Royal Bank Of Canada | 484.122 | 62,09 | 1.225 | 87,31 | ||||
| 2026-02-09 | 13F | Valtinson Bruner Financial Planning LLC | Call | 10.000 | 5 | |||||
| 2026-02-10 | 13F | Hillsdale Investment Management Inc. | 0 | -100,00 | 0 | |||||
| 2026-02-17 | 13F | Aquatic Capital Management LLC | 12.677 | 32 | ||||||
| 2026-02-11 | 13F | Donald Smith & Co., Inc. | 22.956.283 | -4,81 | 58.079 | 9,97 | ||||
| 2026-04-15 | 13F | Polunin Capital Partners Ltd | 1.847.117 | -0,70 | 5 | -20,00 | ||||
| 2026-02-13 | 13F | Timelo Investment Management Inc. | 0 | -100,00 | 0 | |||||
| 2026-02-17 | 13F | XTX Topco Ltd | 623.919 | 23,91 | 1.579 | 43,19 | ||||
| 2025-11-12 | 13F | Forge First Asset Management Inc. | 1.000.000 | 2.177 | ||||||
| 2026-02-17 | 13F | Schonfeld Strategic Advisors LLC | 155.421 | 255,00 | 393 | 313,68 | ||||
| 2026-02-11 | 13F | Simplex Trading, Llc | Put | 11.900 | -51,23 | 30 | ||||
| 2026-02-13 | 13F | Alberta Investment Management Corp | 0 | -100,00 | 0 | |||||
| 2026-02-11 | 13F | Simplex Trading, Llc | 333.965 | 2.303,49 | 845 | |||||
| 2026-02-11 | 13F | Simplex Trading, Llc | Call | 44.600 | 369,47 | 113 | ||||
| 2026-02-14 | 13F | Rockefeller Capital Management L.P. | 3.000 | 0,00 | 8 | 16,67 | ||||
| 2026-02-10 | 13F | Periscope Capital Inc. | 0 | -100,00 | 0 | -100,00 | ||||
| 2026-02-11 | 13F | Gwn Securities Inc. | 101.944 | 258 | ||||||
| 2026-02-17 | 13F | Two Sigma Investments, Lp | 1.469.113 | -7,07 | 3.717 | 7,34 | ||||
| 2026-02-17 | 13F | Millennium Management Llc | 4.812.612 | 23,88 | 12.205 | 43,73 | ||||
| 2026-02-05 | 13F | Allworth Financial LP | 5.000 | -78,72 | 13 | -76,47 | ||||
| 2026-02-13 | 13F | Walleye Capital LLC | 26.791 | -98,73 | 68 | -98,55 | ||||
| 2026-02-17 | 13F | Man Group plc | 90.926 | 230 | ||||||
| 2026-02-10 | 13F | Acadian Asset Management Llc | 3.434.712 | 139,27 | 9 | 166,67 | ||||
| 2026-02-13 | 13F | National Bank Of Canada /fi/ | 335.785 | 2.090,52 | 844 | 2.457,58 | ||||
| 2026-02-13 | 13F | American Century Companies Inc | 4.026.373 | 822,08 | 10.238 | 977,58 |