Grundlæggende statistik
| Institutionelle aktier (lange) | 33.330.177 - 46,29% (ex 13D/G) - change of -4,22MM shares -11,23% MRQ |
| Institutionel værdi (lang) | $ 504.363 USD ($1000) |
Institutionelt ejerskab og aktionærer
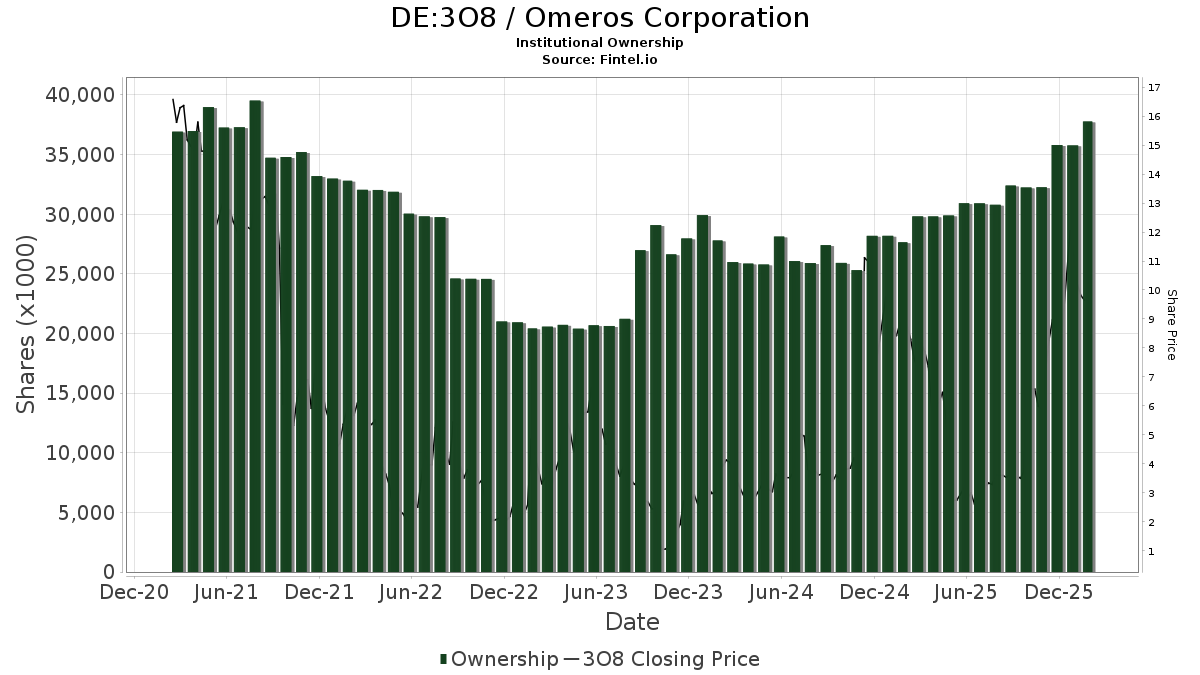
Omeros Corporation (DE:3O8) har 158 institutionelle ejere og aktionærer, der har indsendt 13D/G- eller 13F-formularer til Securities Exchange Commission (SEC). Disse institutioner har i alt 33,330,177 aktier. Største aktionærer omfatter BlackRock, Inc., Vanguard Group Inc, Ingalls & Snyder Llc, UBS Group AG, Stifel Financial Corp, Geode Capital Management, Llc, State Street Corp, Susquehanna International Group, Llp, Ikarian Capital, LLC, and Kotler Kevin .
Omeros Corporation (DB:3O8) institutionel ejerskabsstruktur viser aktuelle positioner i virksomheden efter institutioner og fonde, samt seneste ændringer i positionsstørrelse. Større aktionærer kan omfatte individuelle investorer, investeringsforeninger, hedgefonde eller institutioner. Skema 13D angiver, at investoren besidder (eller besidder) mere end 5 % af virksomheden og har til hensigt (eller har til hensigt at) aktivt at forfølge en ændring i forretningsstrategi. Skema 13G indikerer en passiv investering på over 5%.
The share price as of April 28, 2026 is 12,45 / share. Previously, on May 5, 2025, the share price was 6,00 / share. This represents an increase of 107,67% over that period.
Fondens stemningsscore
Fund Sentiment Score (fka Ownership Accumulation Score) finder de aktier, der bliver mest købt af fonde. Det er resultatet af en sofistikeret, multi-faktor kvantitativ model, der identificerer virksomheder med de højeste niveauer af institutionel akkumulering. Scoringsmodellen bruger en kombination af den samlede stigning i oplyste ejere, ændringerne i porteføljeallokeringer i disse ejere og andre målinger. Tallet går fra 0 til 100, hvor højere tal indikerer et højere niveau af akkumulering for sine jævnaldrende, og 50 er gennemsnittet.
Opdateringsfrekvens: Dagligt
Se Ownership Explorer, som giver en liste over højest rangerende virksomheder.
AI+ Ask Fintel’s AI assistant about Omeros Corporation.
Select a question to share a public post with an AI-crafted answer.
Thinking of good questions…
13F og NPORT arkivering
Detaljer om 13F-arkivering er gratis. Detaljer om NP-ansøgninger kræver et premium-medlemskab. Grønne rækker angiver nye positioner. Røde rækker angiver lukkede positioner. Klik på linket ikon for at se den fulde transaktionshistorik.
Opgrader
for at låse premium-data op og eksportere til Excel ![]() .
.
| Fil dato | Kilde | Investor | Type | Gennemsnitlig pris (Øst) |
Aktier | Δ Aktier (%) |
Rapporteret Værdi ($1000) |
Δ Værdi (%) |
Port Alloc (%) |
|
|---|---|---|---|---|---|---|---|---|---|---|
| 2026-02-06 | 13F | EverSource Wealth Advisors, LLC | 115 | 0,00 | 2 | |||||
| 2026-04-22 | 13F | Mindset Wealth Management, Llc | 59.500 | 14,42 | 628 | -29,68 | ||||
| 2026-02-17 | 13F | Bridgeway Capital Management Inc | 56.715 | 0,00 | 974 | 319,83 | ||||
| 2026-04-13 | 13F | IFP Advisors, Inc | 26 | 0,00 | 0 | |||||
| 2026-01-16 | 13F | Empirical Financial Services, LLC d.b.a. Empirical Wealth Management | 10.500 | -74,07 | 180 | 8,43 | ||||
| 2026-02-04 | 13F | Pandora Wealth, Inc. | 330 | 0,00 | 6 | 400,00 | ||||
| 2026-02-17 | 13F | Alliancebernstein L.p. | 73.490 | 8,73 | 1.262 | 355,60 | ||||
| 2026-02-17 | 13F | Bank Of America Corp /de/ | 114.808 | -58,31 | 1.972 | 74,58 | ||||
| 2026-04-30 | 13F | Nisa Investment Advisors, Llc | 3.425 | 326,00 | 36 | 176,92 | ||||
| 2026-02-12 | 13F | Dimensional Fund Advisors Lp | 96.948 | 1.665 | ||||||
| 2026-04-08 | 13F | Wealth Enhancement Advisory Services, Llc | 17.475 | -44,92 | 190 | -55,71 | ||||
| 2026-02-12 | 13F | Bank Of Montreal /can/ | 601.643 | 6,85 | 10.333 | 347,70 | ||||
| 2026-02-17 | 13F | Two Sigma Investments, Lp | 524.757 | -43,77 | 9.013 | 135,55 | ||||
| 2026-01-13 | 13F/A | Sanctuary Advisors, LLC | 0 | -100,00 | 0 | -100,00 | ||||
| 2025-11-14 | 13F | Capstone Investment Advisors, Llc | Put | 111.400 | 221,04 | 457 | 338,46 | |||
| 2026-02-18 | 13F | GWM Advisors LLC | 1.000 | 17 | ||||||
| 2026-01-27 | 13F | Brighton Jones Llc | 0 | -100,00 | 0 | -100,00 | ||||
| 2026-02-09 | 13F | Geode Capital Management, Llc | 1.631.350 | 6,25 | 28.026 | 345,12 | ||||
| 2026-02-17 | 13F | Ancora Advisors, LLC | 59.250 | 1.875,00 | 1.018 | 8.375,00 | ||||
| 2026-02-17 | 13F | Ameriprise Financial Inc | 117.004 | 0,40 | 2.010 | 321,17 | ||||
| 2026-01-27 | 13F | Zurcher Kantonalbank (Zurich Cantonalbank) | 765 | -23,50 | 13 | 225,00 | ||||
| 2026-02-10 | 13F | Bank of New York Mellon Corp | 165.782 | 2,12 | 2.847 | 328,12 | ||||
| 2026-04-27 | 13F | Leonteq Securities AG | 10.000 | 106 | ||||||
| 2026-02-17 | 13F | Canada Pension Plan Investment Board | 21.700 | 373 | ||||||
| 2026-02-17 | 13F | Raymond James Financial Inc | 12.242 | 210 | ||||||
| 2026-02-13 | 13F | Charles Schwab Investment Management Inc | 593.222 | 7,18 | 10.189 | 349,01 | ||||
| 2026-02-09 | 13F | Legal & General Group Plc | 6.971 | -1,61 | 120 | 310,34 | ||||
| 2026-02-19 | 13F | Invesco Ltd. | 154.782 | 26,79 | 2.658 | 431,60 | ||||
| 2026-02-13 | 13F | Mml Investors Services, Llc | 77.875 | 31,60 | 1.338 | 452,48 | ||||
| 2026-02-17 | 13F | California State Teachers Retirement System | 4.055 | -0,02 | 70 | 331,25 | ||||
| 2026-02-17 | 13F | Susquehanna International Group, Llp | Put | 593.500 | 248,71 | 10.196 | 1.362,84 | |||
| 2026-02-17 | 13F | Susquehanna International Group, Llp | Call | 1.159.600 | 108,75 | 19.922 | 774,88 | |||
| 2026-02-17 | 13F | Farallon Capital Management Llc | 23.000 | 395 | ||||||
| 2026-04-15 | 13F | Badgley Phelps Wealth Managers, LLC | 263.556 | 0,00 | 2.783 | -38,51 | ||||
| 2026-02-13 | 13F | Ubs Asset Management Americas Inc | 231 | 4 | ||||||
| 2026-02-17 | 13F | Susquehanna International Group, Llp | 741.895 | 570,92 | 12.742 | 2.712,80 | ||||
| 2026-02-17 | 13F | Graham Capital Management, L.P. | 13.222 | -61,63 | 227 | 60,99 | ||||
| 2026-01-21 | 13F | Newbridge Financial Services Group, Inc. | 34.310 | -74,49 | 589 | 6,90 | ||||
| 2026-02-12 | 13F | American Financial Group Inc | 64.113 | 0,00 | 1.101 | 320,23 | ||||
| 2026-02-17 | 13F | Royal Bank Of Canada | Call | 24.900 | 428 | |||||
| 2026-02-17 | 13F | Royal Bank Of Canada | 498.399 | -8,33 | 8.560 | 284,03 | ||||
| 2026-02-12 | 13F | New York State Common Retirement Fund | 20.713 | 81,49 | 356 | 671,74 | ||||
| 2026-02-09 | 13F | Jefferies Financial Group Inc. | Put | 0 | -100,00 | 0 | -100,00 | |||
| 2026-02-17 | 13F | Optiver Holding B.V. | 3.747 | 596,47 | 64 | 3.100,00 | ||||
| 2026-02-11 | 13F | Los Angeles Capital Management Llc | 30.920 | 233 | ||||||
| 2026-02-17 | 13F | MIRAE ASSET GLOBAL ETFS HOLDINGS Ltd. | 30.585 | 1,32 | 525 | 326,83 | ||||
| 2026-02-17 | 13F | Engineers Gate Manager LP | 20.082 | 345 | ||||||
| 2026-02-06 | 13F | Larson Financial Group LLC | 151 | 0,67 | 3 | |||||
| 2026-02-13 | 13F | SRS Capital Advisors, Inc. | 5.255 | 56,35 | 90 | 592,31 | ||||
| 2026-02-10 | 13F | Rothschild Investment Llc | 60 | 1 | ||||||
| 2026-02-13 | 13F | State Street Corp | 1.573.526 | 26,93 | 27.025 | 431,78 | ||||
| 2026-02-13 | 13F | Squarepoint Ops LLC | 0 | -100,00 | 0 | -100,00 | ||||
| 2026-02-13 | 13F | Barclays Plc | 120.490 | -8,68 | 2.069 | 283,15 | ||||
| 2026-04-28 | 13F | Abel Hall, LLC | 0 | -100,00 | 0 | -100,00 | ||||
| 2026-01-30 | 13F | Us Bancorp \de\ | 0 | -100,00 | 0 | |||||
| 2026-02-10 | 13F/A | Northwestern Mutual Wealth Management Co | 500 | 0,00 | 9 | 300,00 | ||||
| 2026-02-12 | 13F | Voya Investment Management Llc | 11.405 | 1,93 | 196 | 333,33 | ||||
| 2026-02-13 | 13F | Truvestments Capital Llc | 1.682 | 0,00 | 29 | 366,67 | ||||
| 2026-02-09 | 13F | Quest Partners LLC | 82.597 | 8.259.600,00 | 1.419 | |||||
| 2026-02-12 | 13F | Renaissance Technologies Llc | 0 | -100,00 | 0 | -100,00 | ||||
| 2026-02-17 | 13F | Boothbay Fund Management, Llc | Put | 247.000 | 4.242 | |||||
| 2026-02-13 | 13F | MAI Capital Management | 0 | -100,00 | 0 | -100,00 | ||||
| 2026-02-13 | 13F | Stifel Financial Corp | 1.809.766 | -0,14 | 31.083 | 318,33 | ||||
| 2026-02-14 | 13F | Rockefeller Capital Management L.P. | 195 | 3 | ||||||
| 2026-02-17 | 13F | State Of Wisconsin Investment Board | 0 | -100,00 | 0 | -100,00 | ||||
| 2026-02-17 | 13F | Boothbay Fund Management, Llc | Call | 141.300 | 2.427 | |||||
| 2026-02-10 | 13F | State of Wyoming | 1.433 | 25 | ||||||
| 2026-04-24 | 13F | National Asset Management, Inc. | 11.369 | 0,00 | 112 | -43,08 | ||||
| 2026-02-11 | 13F | Ameritas Investment Partners, Inc. | 5.027 | 0,00 | 86 | 330,00 | ||||
| 2026-02-17 | 13F | Fmr Llc | 18.068 | 36,98 | 310 | 474,07 | ||||
| 2026-02-10 | 13F | Intech Investment Management Llc | 29.967 | 16,86 | 515 | 389,52 | ||||
| 2026-02-13 | 13F | Ingalls & Snyder Llc | Call | 0 | -100,00 | 0 | ||||
| 2026-02-17 | 13F | Toronto Dominion Bank | Put | 317.900 | 1.171,60 | 5.460 | 5.251,96 | |||
| 2026-02-05 | 13F | Amalgamated Bank | 2.069 | 0,83 | 0 | |||||
| 2026-02-05 | 13F | Plante Moran Financial Advisors, LLC | 1.000 | 0,00 | 17 | 325,00 | ||||
| 2026-02-17 | 13F | Caption Management, LLC | Call | 475.700 | 8.170 | |||||
| 2026-02-13 | 13F | Walleye Trading LLC | Put | 43.200 | 742 | |||||
| 2026-02-13 | 13F | Walleye Trading LLC | Call | 35.400 | 608 | |||||
| 2026-02-17 | 13F | Brevan Howard Capital Management LP | 64.957 | -49,80 | 1.116 | 110,38 | ||||
| 2025-11-05 | 13F | SPC Financial, Inc. | 17.400 | 0,00 | 71 | 36,54 | ||||
| 2026-02-11 | 13F | Jpmorgan Chase & Co | 37.191 | -91,06 | 639 | -62,60 | ||||
| 2026-02-13 | 13F | Walleye Trading LLC | 69.653 | 409,42 | 1.196 | 2.035,71 | ||||
| 2026-02-17 | 13F | Susquehanna Portfolio Strategies, LLC | 92.759 | -45,78 | 1.593 | 127,25 | ||||
| 2026-02-12 | 13F | EAM Investors, LLC | 207.480 | 3.563 | ||||||
| 2026-02-09 | 13F | Coldstream Capital Management Inc | 53.605 | 107,53 | 921 | 776,19 | ||||
| 2026-02-17 | 13F | Polar Asset Management Partners Inc. | Call | 200.000 | -85,45 | 3.435 | -39,02 | |||
| 2026-02-17 | 13F | Polar Asset Management Partners Inc. | 68.800 | -95,41 | 1.182 | -80,78 | ||||
| 2026-04-29 | 13F | Police & Firemen's Retirement System of New Jersey | 16.360 | 0,00 | 173 | -38,57 | ||||
| 2026-04-28 | 13F | SBI Securities Co., Ltd. | 208 | 0,00 | 2 | -33,33 | ||||
| 2026-04-20 | 13F | Apella Capital, LLC | 14.288 | 0,00 | 192 | -21,63 | ||||
| 2026-02-17 | 13F | Northern Trust Corp | 526.732 | -1,67 | 9.047 | 311,93 | ||||
| 2026-02-10 | 13F | Axq Capital, Lp | 29.151 | 501 | ||||||
| 2026-04-02 | 13F | Marex Group plc | 0 | 0 | ||||||
| 2026-02-17 | 13F | Two Sigma Advisers, Lp | 76.100 | -86,84 | 1.307 | -44,85 | ||||
| 2026-02-17 | 13F | Creative Planning | 16.916 | 291 | ||||||
| 2026-02-13 | 13F | Rhumbline Advisers | 100.105 | -5,45 | 1.719 | 296,08 | ||||
| 2026-02-17 | 13F | Ikarian Capital, LLC | Put | 950.000 | 16.316 | |||||
| 2026-01-26 | 13F | Mirae Asset Global Investments Co., Ltd. | 3.445 | 30,94 | 59 | 490,00 | ||||
| 2026-02-17 | 13F | Ikarian Capital, LLC | Call | 550.000 | 9.446 | |||||
| 2026-02-11 | 13F | Parallel Advisors, LLC | 3.909 | 23,74 | 67 | 458,33 | ||||
| 2026-02-13 | 13F | Colony Group, LLC | 31.034 | 533 | ||||||
| 2026-02-17 | 13F | Toronto Dominion Bank | Call | 1.000 | 17 | |||||
| 2026-04-15 | 13F | Gf Fund Management Co. Ltd. | 1.583 | 13,72 | 17 | -30,43 | ||||
| 2026-02-12 | 13F | Skopos Labs, Inc. | 0 | -100,00 | 0 | -100,00 | ||||
| 2026-02-13 | 13F | Marshall Wace, Llp | 0 | -100,00 | 0 | -100,00 | ||||
| 2026-02-13 | 13F | Wells Fargo & Company/mn | 165.280 | 23,25 | 2.839 | 416,94 | ||||
| 2026-02-17 | 13F | Jump Financial, LLC | 228.000 | 3.916 | ||||||
| 2026-02-26 | 13F/A | Sculptor Capital LP | Put | 0 | -100,00 | 0 | -100,00 | |||
| 2026-02-09 | 13F | Hartland & Co., LLC | 0 | -100,00 | 0 | |||||
| 2026-02-26 | 13F/A | Sculptor Capital LP | 0 | -100,00 | 0 | -100,00 | ||||
| 2026-04-06 | 13F | GAMMA Investing LLC | 128 | 19,63 | 1 | 0,00 | ||||
| 2026-04-30 | 13F | Cambridge Investment Research Advisors, Inc. | 88.568 | 8,48 | 1 | -100,00 | ||||
| 2026-02-13 | 13F | Manufacturers Life Insurance Company, The | 19.850 | -0,24 | 341 | 319,75 | ||||
| 2026-02-13 | 13F/A | Virtus ETF Advisers LLC | 0 | -100,00 | 0 | -100,00 | ||||
| 2026-02-13 | 13F | Clutterbuck Capital Management LLC | 150.000 | 2.576 | ||||||
| 2025-11-14 | 13F | Corton Capital Inc. | 0 | -100,00 | 0 | -100,00 | ||||
| 2025-11-14 | 13F | State Board Of Administration Of Florida Retirement System | 0 | -100,00 | 0 | -100,00 | ||||
| 2026-02-17 | 13F | Caption Management, LLC | Put | 0 | -100,00 | 0 | ||||
| 2026-02-13 | 13F | Vontobel Holding Ltd. | 5.450 | 94 | ||||||
| 2026-02-13 | 13F | Vontobel Holding Ltd. | Call | 20.000 | 344 | |||||
| 2026-02-17 | 13F | Kynam Capital Management, LP | Put | 200.000 | 3.436 | |||||
| 2026-02-02 | 13F | Breakwater Investment Management | 17.048 | 0,00 | 293 | 323,19 | ||||
| 2026-01-29 | 13F | UBS Group AG | 2.222.982 | 213,50 | 38.180 | 1.213,35 | ||||
| 2025-11-06 | 13F | CBIZ Investment Advisory Services, LLC | 0 | -100,00 | 0 | |||||
| 2026-02-17 | 13F | Atom Investors LP | 0 | -100,00 | 0 | -100,00 | ||||
| 2026-04-24 | 13F | ProShare Advisors LLC | 13.118 | -13,53 | 139 | -46,92 | ||||
| 2026-04-22 | 13F | Sterling Capital Management LLC | 669 | -25,75 | 7 | -53,33 | ||||
| 2025-11-06 | 13F | Ameritas Advisory Services, LLC | 0 | -100,00 | 0 | |||||
| 2026-03-03 | 13F/A | Caitong International Asset Management Co., Ltd | 9.276 | 159 | ||||||
| 2025-11-13 | 13F | Hsbc Holdings Plc | 0 | -100,00 | 0 | -100,00 | ||||
| 2026-02-13 | 13F | Walleye Capital LLC | 109.956 | 636,82 | 1.888 | 2.995,08 | ||||
| 2026-02-09 | 13F | Harbour Investments, Inc. | 21.835 | 62,11 | 375 | 581,82 | ||||
| 2026-02-10 | 13F | Quantbot Technologies LP | 7.220 | 124 | ||||||
| 2026-02-13 | 13F | Walleye Capital LLC | Call | 20.500 | 10,22 | 352 | 363,16 | |||
| 2026-05-01 | 13F | Strategic Investment Solutions, Inc. /IL | 1.827 | 0,00 | 19 | -38,71 | ||||
| 2026-02-17 | 13F | Aqr Capital Management Llc | 22.838 | 7,19 | 392 | 350,57 | ||||
| 2026-04-15 | 13F | Merit Financial Group, LLC | 26.993 | 285 | ||||||
| 2026-02-13 | 13F | Walleye Capital LLC | Put | 35.000 | 601 | |||||
| 2026-04-29 | 13F | Rocky Mountain Advisers, Llc | 0 | -100,00 | 0 | |||||
| 2026-02-17 | 13F | D. E. Shaw & Co., Inc. | 754.999 | -24,89 | 12.967 | 214,66 | ||||
| 2026-02-17 | 13F | Kotler Kevin | Call | 218.700 | 3.794 | |||||
| 2026-02-12 | 13F | MetLife Investment Management, LLC | 36.200 | 76,55 | 622 | 639,29 | ||||
| 2026-02-13 | 13F | Morgan Stanley | 386.152 | -80,59 | 6.632 | -18,70 | ||||
| 2026-02-11 | 13F | Cerity Partners LLC | 30.450 | 6,10 | 523 | 346,15 | ||||
| 2026-02-06 | 13F | HighTower Advisors, LLC | 104.059 | 9,32 | 1.787 | 358,21 | ||||
| 2026-04-20 | 13F | Sowell Financial Services LLC | 10.650 | 0,00 | 112 | -38,46 | ||||
| 2026-02-17 | 13F | Millennium Management Llc | 441.811 | 9,95 | 7.588 | 360,72 | ||||
| 2026-02-13 | 13F | Sei Investments Co | 31.766 | 142,23 | 546 | 928,30 | ||||
| 2026-04-16 | 13F | SG Americas Securities, LLC | 0 | -100,00 | 0 | |||||
| 2026-02-17 | 13F | Kotler Kevin | 905.635 | 15.554 | ||||||
| 2026-04-15 | 13F | Stordahl Capital Management, Inc. | 22.860 | 0,00 | 241 | -38,52 | ||||
| 2026-02-17 | 13F | Man Group plc | 27.099 | 465 | 159,78 | |||||
| 2026-02-11 | 13F | Simplex Trading, Llc | Put | 119.700 | 35,25 | 2.056 | ||||
| 2026-02-05 | 13F | Allworth Financial LP | 44 | -22,81 | 1 | |||||
| 2026-02-12 | 13F | Jane Street Group, Llc | Put | 171.100 | 352,65 | 2.939 | 1.807,79 | |||
| 2026-02-05 | 13F | Avantax Planning Partners, Inc. | 13.200 | 30,69 | 227 | 451,22 | ||||
| 2026-02-17 | 13F | Advisor Group Holdings, Inc. | 7.547 | 34,55 | 130 | 460,87 | ||||
| 2026-01-29 | 13F | Comerica Bank | 38.000 | 8,57 | 653 | 355,94 | ||||
| 2026-02-11 | 13F | Simplex Trading, Llc | 123.979 | 457,96 | 2.129 | |||||
| 2026-02-12 | 13F | Jane Street Group, Llc | 463.622 | 64,94 | 7.963 | 591,15 | ||||
| 2026-02-11 | 13F | Cypress Capital Group | 42.000 | 0,00 | 721 | 319,19 | ||||
| 2026-02-11 | 13F | Simplex Trading, Llc | Call | 129.500 | 43,09 | 2.224 | ||||
| 2026-02-12 | 13F | Jane Street Group, Llc | Call | 109.500 | 665,73 | 1.881 | 3.141,38 | |||
| 2026-02-17 | 13F | ADAR1 Capital Management, LLC | Put | 75.000 | 1.288 | |||||
| 2026-02-17 | 13F | ADAR1 Capital Management, LLC | 25.000 | 429 | ||||||
| 2026-02-17 | 13F | Nomura Holdings Inc | 655.021 | 1.399,56 | 11.250 | 6.184,36 | ||||
| 2026-02-17 | 13F | Nomura Holdings Inc | Call | 126.400 | 2.171 | |||||
| 2026-02-17 | 13F | Nomura Holdings Inc | Put | 30.000 | 515 | |||||
| 2026-02-11 | 13F | Group One Trading, L.p. | Put | 178.600 | 151,20 | 3.067 | 953,95 | |||
| 2026-02-06 | 13F | Gsa Capital Partners Llp | 0 | -100,00 | 0 | |||||
| 2026-02-13 | 13F | Ingalls & Snyder Llc | 3.448.699 | -16,02 | 59 | 268,75 | ||||
| 2026-02-05 | 13F | AlphaCore Capital LLC | 17.647 | 303 | ||||||
| 2026-02-11 | 13F | Group One Trading, L.p. | Call | 277.300 | 13,79 | 4.763 | 376,68 | |||
| 2026-02-11 | 13F | Deutsche Bank Ag\ | 48.694 | 19,34 | 837 | 400,60 | ||||
| 2026-02-11 | 13F | Group One Trading, L.p. | 133.269 | 35,58 | 2.289 | 467,74 | ||||
| 2026-02-13 | 13F | Affinity Asset Advisors, LLC | Put | 0 | -100,00 | 0 | -100,00 | |||
| 2026-02-17 | 13F | Virtus Investment Advisers, Inc. | 26.212 | 450 | ||||||
| 2026-02-12 | 13F | Federation des caisses Desjardins du Quebec | 300 | 0,00 | 5 | 400,00 | ||||
| 2026-02-13 | 13F | Citigroup Inc | 27.489 | 398,26 | 472 | 2.045,45 | ||||
| 2025-11-14 | 13F | Wolverine Trading, Llc | 25.971 | 48,52 | 109 | 96,36 | ||||
| 2025-11-14 | 13F | Wolverine Trading, Llc | Call | 97.000 | 370,87 | 405 | 523,08 | |||
| 2026-05-01 | 13F | Fifth Third Bancorp | 39.000 | 3.800,00 | 412 | 2.317,65 | ||||
| 2025-11-14 | 13F | Wolverine Trading, Llc | Put | 70.800 | 187,80 | 296 | 278,21 | |||
| 2026-02-17 | 13F | Citadel Advisors Llc | Call | 394.600 | 378,88 | 6.777 | 1.910,98 | |||
| 2026-02-17 | 13F | Citadel Advisors Llc | Put | 408.400 | 25,97 | 7.014 | 427,77 | |||
| 2026-02-17 | 13F | Citadel Advisors Llc | 240.352 | -38,88 | 4.128 | 156,08 | ||||
| 2026-04-24 | 13F | Profund Advisors Llc | 20.647 | 44,08 | 218 | -11,38 | ||||
| 2026-02-06 | 13F | Pnc Financial Services Group, Inc. | 377 | -44,07 | 6 | 200,00 | ||||
| 2026-02-13 | 13F | Verition Fund Management LLC | 63.493 | 1.090 | ||||||
| 2026-02-13 | 13F | Parkside Financial Bank & Trust | 40 | 1 | ||||||
| 2026-05-01 | 13F | International Assets Investment Management, Llc | 5.800 | 16,00 | 70 | -17,65 | ||||
| 2026-02-10 | 13F | Daiwa Securities Group Inc. | 191 | 0,00 | 0 | |||||
| 2026-02-12 | 13F | BlackRock, Inc. | 5.062.438 | 13,71 | 86.947 | 376,34 | ||||
| 2026-02-10 | 13F | Bnp Paribas Arbitrage, Sa | 16.351 | -81,44 | 281 | -22,44 | ||||
| 2026-02-13 | 13F | Itau Unibanco Holding S.A. | 180.000 | 3.053 | ||||||
| 2026-04-13 | 13F | Massmutual Trust Co Fsb/adv | 583 | 61,94 | 6 | 0,00 | ||||
| 2026-04-22 | 13F | Stone House Investment Management, LLC | 39 | 0 | ||||||
| 2026-02-17 | 13F | Tower Research Capital LLC (TRC) | 1.916 | -44,11 | 33 | 128,57 | ||||
| 2026-02-19 | 13F | CI Private Wealth, LLC | 687.325 | 12,91 | 11.805 | 373,11 | ||||
| 2026-02-17 | 13F | Quadrature Capital Ltd | 0 | -100,00 | 0 | -100,00 | ||||
| 2026-02-17 | 13F | Wellington Management Group Llp | 202.617 | 4,20 | 3.480 | 336,51 | ||||
| 2026-04-28 | 13F | China Universal Asset Management Co., Ltd. | 18.982 | 14,67 | 200 | -29,58 | ||||
| 2026-02-17 | 13F | Russell Investments Group, Ltd. | 14.014 | 31,03 | 241 | 458,14 | ||||
| 2026-01-26 | 13F | Cwm, Llc | 1.232 | -2,22 | 0 | |||||
| 2026-04-07 | 13F | Farther Finance Advisors, LLC | 7.106 | 0,00 | 86 | -30,33 | ||||
| 2026-02-17 | 13F | Schonfeld Strategic Advisors LLC | 12.667 | 218 | ||||||
| 2026-02-12 | 13F | Bank Of Montreal /can/ | Call | 600.000 | 10.305 | |||||
| 2026-01-29 | 13F | Vanguard Group Inc | 4.013.315 | 19,91 | 68.929 | 402,32 | ||||
| 2026-02-12 | 13F | Bank Of Montreal /can/ | Put | 320.400 | 5.503 | |||||
| 2026-04-30 | 13F | Nuveen, LLC | 154.201 | 0,66 | 1.628 | -38,10 | ||||
| 2026-02-13 | 13F | Rafferty Asset Management, LLC | 12.226 | 210 | ||||||
| 2026-02-10 | 13F | Goldman Sachs Group Inc | 227.294 | -32,37 | 3.904 | 183,44 | ||||
| 2026-02-17 | 13F | Quantinno Capital Management LP | 25.074 | 37,71 | 431 | 481,08 | ||||
| 2026-02-17 | 13F | Price T Rowe Associates Inc /md/ | 95.745 | 6,94 | 2 | |||||
| 2025-11-14 | 13F | XTX Topco Ltd | 0 | -100,00 | 0 | -100,00 | ||||
| 2026-02-11 | 13F | Capital Analysts, Inc. | 1.000 | 0,00 | 0 | |||||
| 2026-02-13 | 13F | DeepCurrents Investment Group LLC | 0 | -100,00 | 0 | -100,00 |