Grundlæggende statistik
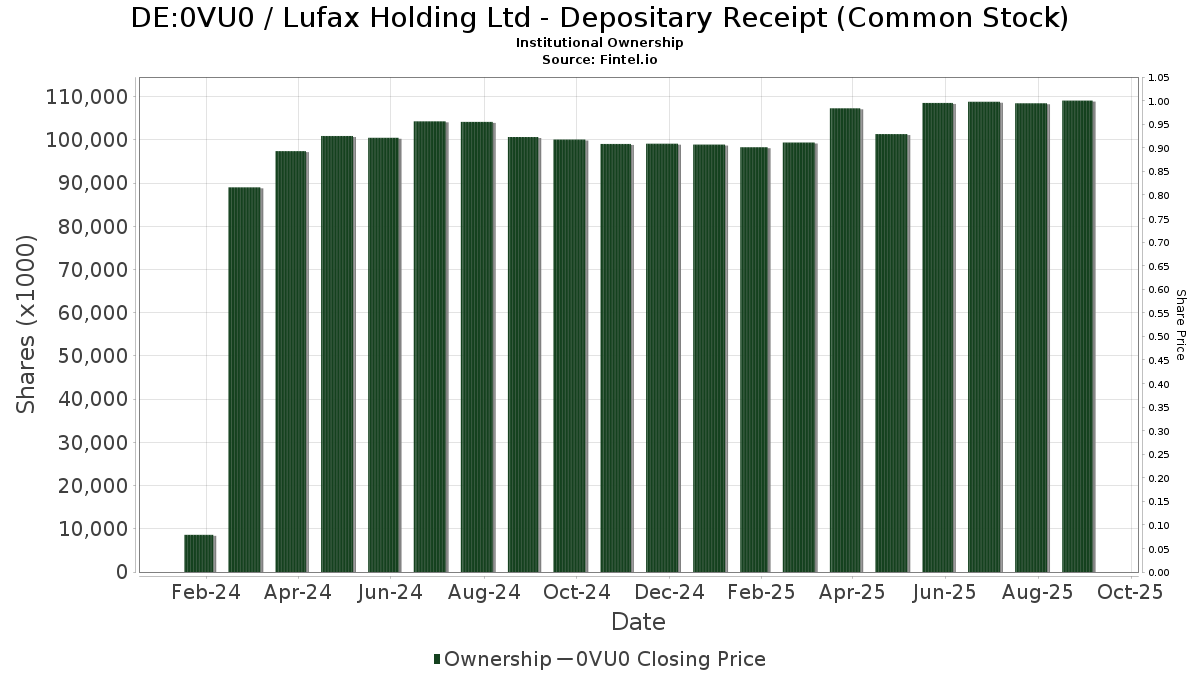
| Institutionelle ejere | 98 total, 93 long only, 0 short only, 5 long/short - change of -25,76% MRQ |
| Del pris | 2,06 |
| Gennemsnitlig porteføljeallokering | 0.7105 % - change of 17,90% MRQ |
| Institutionelle aktier (lange) | 85.885.315 (ex 13D/G) - change of -11,64MM shares -11,93% MRQ |
| Institutionel værdi (lang) | $ 203.322 USD ($1000) |
Institutionelt ejerskab og aktionærer
Lufax Holding Ltd - Depositary Receipt (Common Stock) (DE:0VU0) har 98 institutionelle ejere og aktionærer, der har indsendt 13D/G- eller 13F-formularer til Securities Exchange Commission (SEC). Disse institutioner har i alt 85,885,315 aktier. Største aktionærer omfatter Vanguard Group Inc, Yunqi Capital Ltd, Alpine Investment Management Ltd, Baillie Gifford & Co, Acadian Asset Management Llc, Charles Schwab Investment Management Inc, BlackRock, Inc., VGTSX - Vanguard Total International Stock Index Fund Investor Shares, Fmr Llc, and State Street Corp .
Lufax Holding Ltd - Depositary Receipt (Common Stock) (DB:0VU0) institutionel ejerskabsstruktur viser aktuelle positioner i virksomheden efter institutioner og fonde, samt seneste ændringer i positionsstørrelse. Større aktionærer kan omfatte individuelle investorer, investeringsforeninger, hedgefonde eller institutioner. Skema 13D angiver, at investoren besidder (eller besidder) mere end 5 % af virksomheden og har til hensigt (eller har til hensigt at) aktivt at forfølge en ændring i forretningsstrategi. Skema 13G indikerer en passiv investering på over 5%.
The share price as of March 6, 2026 is 2,06 / share. Previously, on March 7, 2025, the share price was 2,90 / share. This represents a decline of 28,97% over that period.
Fondens stemningsscore
Fund Sentiment Score (fka Ownership Accumulation Score) finder de aktier, der bliver mest købt af fonde. Det er resultatet af en sofistikeret, multi-faktor kvantitativ model, der identificerer virksomheder med de højeste niveauer af institutionel akkumulering. Scoringsmodellen bruger en kombination af den samlede stigning i oplyste ejere, ændringerne i porteføljeallokeringer i disse ejere og andre målinger. Tallet går fra 0 til 100, hvor højere tal indikerer et højere niveau af akkumulering for sine jævnaldrende, og 50 er gennemsnittet.
Opdateringsfrekvens: Dagligt
Se Ownership Explorer, som giver en liste over højest rangerende virksomheder.
AI+ Ask Fintel’s AI assistant about Lufax Holding Ltd - Depositary Receipt (Common Stock).
Select a question to share a public post with an AI-crafted answer.
Thinking of good questions…
13F og NPORT arkivering
Detaljer om 13F-arkivering er gratis. Detaljer om NP-ansøgninger kræver et premium-medlemskab. Grønne rækker angiver nye positioner. Røde rækker angiver lukkede positioner. Klik på linket ikon for at se den fulde transaktionshistorik.
Opgrader
for at låse premium-data op og eksportere til Excel ![]() .
.
| Fil dato | Kilde | Investor | Type | Gennemsnitlig pris (Øst) |
Aktier | Δ Aktier (%) |
Rapporteret Værdi ($1000) |
Δ Værdi (%) |
Port Alloc (%) |
|
|---|---|---|---|---|---|---|---|---|---|---|
| 2025-11-07 | 13F | Shell Asset Management Co | 4.740 | -68,28 | 0 | |||||
| 2026-02-19 | 13F | CI Private Wealth, LLC | 0 | -100,00 | 0 | |||||
| 2026-02-10 | 13F | Norges Bank | 3.151.227 | 8.067 | ||||||
| 2025-09-25 | NP | VT - Vanguard Total World Stock Index Fund ETF Shares | 198.785 | 102,85 | 574 | 102,11 | ||||
| 2026-03-04 | 13F/A | Savant Capital, LLC | 0 | -100,00 | 0 | |||||
| 2026-02-10 | 13F | Commonwealth Of Pennsylvania Public School Empls Retrmt Sys | 116.220 | -32,25 | 298 | -57,33 | ||||
| 2026-02-17 | 13F | Russell Investments Group, Ltd. | 0 | -100,00 | 0 | |||||
| 2026-02-12 | 13F | Barometer Capital Management Inc. | 0 | -100,00 | 0 | |||||
| 2026-02-17 | 13F | Two Sigma Investments, Lp | 146.900 | 376 | ||||||
| 2025-09-26 | NP | BKEM - BNY Mellon Emerging Markets Equity ETF | 1.498 | -43,58 | 4 | -42,86 | ||||
| 2026-02-11 | 13F | Deutsche Bank Ag\ | 8.991 | -81,12 | 23 | -88,08 | ||||
| 2025-09-29 | NP | PXH - Invesco FTSE RAFI Emerging Markets ETF This fund is a listed as child fund of Invesco Ltd. and if that institution has disclosed ownership in this security, then these positions will not be double counted when calculating total shares and total value | 487.120 | 13,57 | 1.408 | 13,19 | ||||
| 2026-02-13 | 13F | Walleye Capital LLC | 2.675 | 7 | ||||||
| 2025-09-26 | NP | FTIHX - Fidelity Total International Index Fund This fund is a listed as child fund of Fmr Llc and if that institution has disclosed ownership in this security, then these positions will not be double counted when calculating total shares and total value | 122.889 | 0,00 | 355 | -0,28 | ||||
| 2026-02-13 | 13F | Walleye Capital LLC | Put | 8.900 | 23 | |||||
| 2025-09-25 | NP | VEIEX - Vanguard Emerging Markets Stock Index Fund Investor Shares | 3.870.700 | 65,32 | 11.186 | 64,74 | ||||
| 2026-01-29 | 13F | Pictet Asset Management Holding SA | 17.282 | 0,00 | 44 | -37,14 | ||||
| 2026-02-13 | 13F | Pathstone Holdings, LLC | 23.677 | 18,47 | 61 | -25,93 | ||||
| 2026-02-12 | 13F | JBF Capital, Inc. | 339.884 | 0,00 | 870 | -36,91 | ||||
| 2026-02-13 | 13F | Charles Schwab Investment Management Inc | 5.802.005 | 4,32 | 14.853 | -34,22 | ||||
| 2026-02-23 | 13F | Virtu Financial LLC | 37.473 | 0 | ||||||
| 2026-02-12 | 13F | Skopos Labs, Inc. | 0 | -100,00 | 0 | |||||
| 2026-02-17 | 13F | Advisor Group Holdings, Inc. | 472 | 0,00 | 1 | 0,00 | ||||
| 2026-02-17 | 13F | Susquehanna International Group, Llp | Put | 474.900 | -43,70 | 1.216 | -64,52 | |||
| 2025-09-26 | NP | AEMGX - Acadian Emerging Markets Portfolio Investor Class Shares | 394.110 | 0,00 | 1.139 | -0,35 | ||||
| 2026-02-13 | 13F | Neuberger Berman Group LLC | 104.956 | 0,00 | 269 | -37,09 | ||||
| 2026-02-17 | 13F | Citadel Advisors Llc | 540.146 | -36,59 | 1.383 | -60,03 | ||||
| 2026-02-17 | 13F | Citadel Advisors Llc | Call | 78.500 | -41,24 | 201 | -63,10 | |||
| 2026-02-17 | 13F | Citadel Advisors Llc | Put | 25.200 | -51,45 | 65 | -69,52 | |||
| 2026-02-11 | 13F | Franklin Resources Inc | 234.142 | 5,03 | 599 | -33,81 | ||||
| 2026-02-13 | 13F | Peak6 Llc | Call | 0 | -100,00 | 0 | ||||
| 2026-02-13 | 13F | Police & Firemen's Retirement System of New Jersey | 130.739 | 29,12 | 335 | -18,73 | ||||
| 2026-02-12 | 13F | Renaissance Technologies Llc | 0 | -100,00 | 0 | |||||
| 2026-02-13 | 13F | JustInvest LLC | 13.189 | 25,78 | 34 | -21,43 | ||||
| 2025-09-26 | NP | PGJ - Invesco Golden Dragon China ETF This fund is a listed as child fund of Invesco Ltd. and if that institution has disclosed ownership in this security, then these positions will not be double counted when calculating total shares and total value | 197.474 | -7,11 | 571 | -7,47 | ||||
| 2026-02-10 | 13F | Goldman Sachs Group Inc | 348.727 | -60,23 | 893 | -74,94 | ||||
| 2026-02-10 | 13F | Bnp Paribas Arbitrage, Sa | 26.399 | -28,80 | 68 | -55,33 | ||||
| 2026-01-27 | 13F | Asset Management One Co., Ltd. | 31.946 | -16,32 | 82 | -47,10 | ||||
| 2026-02-13 | 13F | State Street Corp | 3.914.555 | -15,96 | 10.022 | -47,01 | ||||
| 2026-02-03 | 13F | SBI Securities Co., Ltd. | 2.003 | -0,40 | 5 | -37,50 | ||||
| 2026-02-11 | 13F | Jpmorgan Chase & Co | 52.485 | -47,94 | 134 | -67,24 | ||||
| 2026-02-13 | 13F | Hudson Bay Capital Management LP | 20.800 | 0,00 | 53 | -36,90 | ||||
| 2025-11-13 | 13F | Arrowstreet Capital, Limited Partnership | 0 | -100,00 | 0 | |||||
| 2025-09-26 | NP | UGPIX - UltraChina ProFund Investor Class | 28.284 | 35,03 | 82 | 35,00 | ||||
| 2026-02-17 | 13F | Alliancebernstein L.p. | 100.553 | 0,00 | 257 | -37,01 | ||||
| 2025-11-14 | 13F | Susquehanna International Group, Llp | Call | 0 | -100,00 | 0 | -100,00 | |||
| 2025-09-25 | NP | HERIX - Hartford Emerging Markets Equity Fund Class I | 165.198 | 477 | ||||||
| 2026-02-17 | 13F | Susquehanna International Group, Llp | 559.805 | -48,59 | 1.433 | -67,58 | ||||
| 2025-11-14 | 13F | Squarepoint Ops LLC | 0 | -100,00 | 0 | -100,00 | ||||
| 2025-09-26 | NP | TAISX - TIAA-CREF Quant International Small-Cap Equity Fund Advisor Class | 1.709.095 | -6,21 | 4.939 | -6,53 | ||||
| 2026-02-10 | 13F | Acadian Asset Management Llc | 6.723.451 | -8,56 | 17 | -41,38 | ||||
| 2026-02-11 | 13F | Simplex Trading, Llc | 152.713 | -51,13 | 391 | 38.900,00 | ||||
| 2026-02-11 | 13F | IMA Wealth, Inc. | 36 | 0 | ||||||
| 2026-02-17 | 13F | Fmr Llc | 3.947.461 | 78,07 | 10.106 | 12,29 | ||||
| 2026-02-10 | 13F | Fideuram Asset Management (Ireland) dac | 194.559 | 565 | ||||||
| 2026-01-23 | 13F | Baillie Gifford & Co | 7.942.847 | -5,52 | 20.334 | -40,43 | ||||
| 2026-01-29 | 13F | Vanguard Group Inc | 12.534.494 | 1,09 | 32.088 | -36,26 | ||||
| 2026-03-06 | 13F | Hsbc Holdings Plc | 79.547 | 11,48 | 204 | -29,76 | ||||
| 2026-02-12 | 13F | Jane Street Group, Llc | 1.003.517 | -34,00 | 2.569 | -58,38 | ||||
| 2026-02-11 | 13F | Group One Trading, L.p. | 113.052 | 29,86 | 289 | -18,13 | ||||
| 2026-02-12 | 13F | Jane Street Group, Llc | Put | 73.400 | 319,43 | 188 | 163,38 | |||
| 2026-02-12 | 13F | Jane Street Group, Llc | Call | 27.600 | 57,71 | 71 | -1,41 | |||
| 2026-02-10 | 13F | Nomura Asset Management Co Ltd | 0 | 0 | ||||||
| 2026-02-12 | 13F | SWAN Capital LLC | 28 | 0,00 | 0 | |||||
| 2026-01-16 | 13F | Standard Life Aberdeen plc | 181.758 | -0,74 | 465 | -37,42 | ||||
| 2025-11-14 | 13F | Wolverine Trading, Llc | Call | 40.600 | 17,68 | 165 | 74,47 | |||
| 2025-11-14 | 13F | Wolverine Trading, Llc | Put | 11.600 | 47 | |||||
| 2026-02-17 | 13F | Royal Bank Of Canada | 0 | -100,00 | 0 | -100,00 | ||||
| 2025-10-28 | 13F | Qrg Capital Management, Inc. | 0 | -100,00 | 0 | -100,00 | ||||
| 2026-02-17 | 13F | Bank Of America Corp /de/ | 248.423 | -21,13 | 636 | -50,31 | ||||
| 2026-02-17 | 13F | Tower Research Capital LLC (TRC) | 1.797 | 548,74 | 5 | 300,00 | ||||
| 2026-01-06 | 13F | Sanctuary Advisors, LLC | 0 | -100,00 | 0 | -100,00 | ||||
| 2026-02-10 | 13F | Bank of New York Mellon Corp | 304.141 | 779 | ||||||
| 2026-02-11 | 13F | Allianz Asset Management GmbH | 1.253.309 | 0,00 | 3.208 | -36,95 | ||||
| 2026-02-17 | 13F | Balyasny Asset Management Llc | 0 | -100,00 | 0 | |||||
| 2026-02-13 | 13F | Barclays Plc | 450 | -99,67 | 1 | -99,82 | ||||
| 2025-10-08 | 13F/A | New York State Common Retirement Fund | 0 | -100,00 | 0 | -100,00 | ||||
| 2026-02-24 | 13F | Bell Investment Advisors, Inc | 0 | -100,00 | 0 | |||||
| 2026-02-13 | 13F | Walleye Trading LLC | 0 | -100,00 | 0 | |||||
| 2025-09-24 | NP | SFENX - Schwab Fundamental Emerging Markets Large Company Index Fund Institutional Shares | 695.964 | 12,94 | 2.011 | 12,53 | ||||
| 2026-02-13 | 13F | Dymon Asia Capital (singapore) Pte. Ltd. | 0 | -100,00 | 0 | |||||
| 2026-02-13 | 13F | Ubs Asset Management Americas Inc | 77.930 | 200 | ||||||
| 2025-11-07 | 13F | Gsa Capital Partners Llp | 0 | -100,00 | 0 | |||||
| 2026-02-17 | 13F | SIH Partners, LLLP | 27.400 | 0,00 | 70 | -36,94 | ||||
| 2025-11-14 | 13F | First Beijing Investment Ltd | 0 | -100,00 | 0 | -100,00 | ||||
| 2026-01-29 | 13F | UBS Group AG | 738.033 | -53,03 | 1.889 | -70,38 | ||||
| 2025-11-14 | 13F | Centiva Capital, LP | 0 | -100,00 | 0 | -100,00 | ||||
| 2026-02-17 | 13F | Northern Trust Corp | 532.817 | -0,99 | 1.364 | -37,55 | ||||
| 2026-02-13 | 13F | Morgan Stanley | 651.599 | 105,36 | 1.668 | 29,50 | ||||
| 2026-02-13 | 13F | Wells Fargo & Company/mn | 25 | 0,00 | 0 | |||||
| 2026-02-17 | 13F | Wellington Management Group Llp | 174.664 | -61,75 | 447 | -75,89 | ||||
| 2025-09-24 | NP | IXUS - iShares Core MSCI Total International Stock ETF | 246.984 | 4,69 | 714 | 4,24 | ||||
| 2026-02-13 | 13F | Alpine Investment Management Ltd | 8.106.500 | 91,87 | 20.753 | 20,98 | ||||
| 2025-11-19 | 13F | Caitong International Asset Management Co., Ltd | 0 | -100,00 | 0 | -100,00 | ||||
| 2026-02-12 | 13F | Nuveen, LLC | 167.100 | 0,00 | 428 | -37,02 | ||||
| 2026-02-17 | 13F | MIRAE ASSET GLOBAL ETFS HOLDINGS Ltd. | 512.867 | -3,85 | 1.313 | -39,35 | ||||
| 2026-02-12 | 13F | Hrt Financial Lp | 109.823 | 4,23 | 0 | |||||
| 2025-10-31 | 13F | Mitsubishi UFJ Trust & Banking Corp | 0 | -100,00 | 0 | -100,00 | ||||
| 2026-02-13 | 13F | Marshall Wace, Llp | 0 | -100,00 | 0 | |||||
| 2026-02-12 | 13F | BlackRock, Inc. | 5.580.842 | -0,44 | 14.287 | -37,23 | ||||
| 2025-11-06 | 13F | Leading Securities Co Ltd | 514.323 | 37,77 | 2.088 | 100,58 | ||||
| 2026-01-26 | 13F | Cwm, Llc | 927 | 0,00 | 0 | |||||
| 2025-11-07 | 13F | May Hill Capital, LLC | 0 | -100,00 | 0 | -100,00 | ||||
| 2026-02-12 | 13F | California Public Employees Retirement System | 321.481 | -0,33 | 823 | -37,20 | ||||
| 2026-02-06 | 13F | EverSource Wealth Advisors, LLC | 780 | 111,38 | 2 | 0,00 | ||||
| 2026-02-06 | 13F | Profund Advisors Llc | 25.448 | -19,76 | 65 | -49,22 | ||||
| 2025-11-14 | 13F | Lazard Asset Management Llc | 0 | -100,00 | 0 | |||||
| 2026-02-17 | 13F | Scientech Research LLC | 0 | -100,00 | 0 | |||||
| 2025-09-25 | NP | VGTSX - Vanguard Total International Stock Index Fund Investor Shares | 4.420.605 | 70,40 | 12.776 | 69,81 | ||||
| 2026-02-17 | 13F | Tiger Pacific Capital LP | 0 | -100,00 | 0 | -100,00 | ||||
| 2025-11-13 | 13F | Canada Pension Plan Investment Board | 0 | -100,00 | 0 | |||||
| 2026-02-09 | 13F | Geode Capital Management, Llc | 184.122 | 20,46 | 471 | -24,03 | ||||
| 2026-01-23 | 13F | Farther Finance Advisors, LLC | 0 | -100,00 | 0 | -100,00 | ||||
| 2025-11-12 | 13F | Headlands Technologies LLC | 0 | -100,00 | 0 | |||||
| 2026-02-17 | 13F | Two Sigma Securities, Llc | 10.399 | 27 | ||||||
| 2026-02-17 | 13F | XTX Topco Ltd | 96.250 | 246 | ||||||
| 2026-02-17 | 13F | D. E. Shaw & Co., Inc. | 0 | -100,00 | 0 | |||||
| 2026-02-17 | 13F | Amundi | 93.820 | 44,39 | 240 | -9,43 | ||||
| 2026-02-17 | 13F | Millennium Management Llc | 259.472 | 529,83 | 664 | 297,60 | ||||
| 2026-02-13 | 13F | Sei Investments Co | 68.848 | -53,27 | 176 | -70,57 | ||||
| 2026-02-02 | 13F | Danske Bank A/s | 1 | 0,00 | 0 | |||||
| 2026-02-17 | 13F | Lighthouse Investment Partners, LLC | 0 | -100,00 | 0 | |||||
| 2026-02-17 | 13F | Two Sigma Advisers, Lp | 586.262 | -40,76 | 1.501 | -62,67 | ||||
| 2026-02-17 | 13F | Public Employees Retirement System Of Ohio | 239.900 | 3,98 | 614 | -34,40 | ||||
| 2026-02-06 | 13F | Vestmark Advisory Solutions, Inc. | 30.294 | 78 | ||||||
| 2026-02-13 | 13F | Rhumbline Advisers | 148 | 0,00 | 0 | |||||
| 2026-02-13 | 13F | Walleye Trading LLC | Call | 0 | -100,00 | 0 | ||||
| 2026-02-03 | 13F | Mitsubishi UFJ Kokusai Asset Management Co., Ltd. | 79.727 | 33,23 | 214 | -11,57 | ||||
| 2026-02-13 | 13F | Ariadne Wealth Management, LP | 20.701 | -6,76 | 57 | -5,00 | ||||
| 2026-02-19 | 13F | Invesco Ltd. | 707.634 | -1,12 | 1.812 | -37,66 | ||||
| 2026-02-13 | 13F | Hel Ved Capital Management Ltd | 0 | -100,00 | 0 | |||||
| 2026-01-26 | 13F | Mirae Asset Global Investments Co., Ltd. | 20.044 | 6,47 | 51 | -32,89 | ||||
| 2026-02-03 | 13F | Ethic Inc. | 13.244 | -7,51 | 34 | -43,10 | ||||
| 2026-02-10 | 13F | Yunqi Capital Ltd | 10.950.138 | 0,00 | 28.032 | -36,95 | ||||
| 2026-01-20 | 13F | Polunin Capital Partners Ltd | 41.924 | -53,22 | 0 | |||||
| 2025-09-25 | NP | VEU - Vanguard FTSE All-World ex-US Index Fund ETF Shares | 650.948 | 77,99 | 1.881 | 77,45 | ||||
| 2026-02-09 | 13F | Legal & General Group Plc | 1.560.906 | 106,47 | 3.996 | 30,30 | ||||
| 2026-02-13 | 13F | American Century Companies Inc | 150.720 | 4,96 | 386 | -33,85 | ||||
| 2026-01-09 | 13F | SG Americas Securities, LLC | 198.619 | 16,97 | 1 | |||||
| 2026-02-03 | 13F | Ewa, Llc | 13.513 | -0,04 | 35 | -37,04 | ||||
| 2026-02-13 | 13F | Citigroup Inc | 57.327 | 1,16 | 147 | -36,52 |
Other Listings
| US:LU | 2,42 $ |