Grundlæggende statistik
| Institutionelle aktier (lange) | 14.417.711 - 45,03% (ex 13D/G) - change of 1,17MM shares 8,86% MRQ |
| Institutionel værdi (lang) | $ 84.032 USD ($1000) |
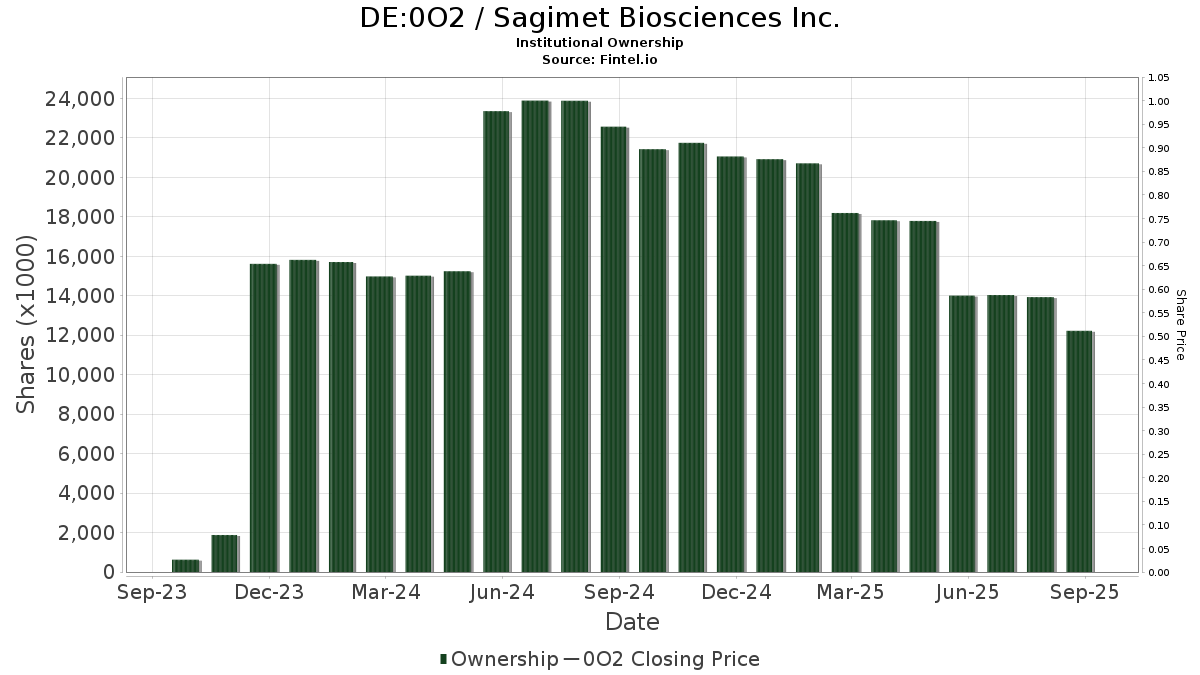
Institutionelt ejerskab og aktionærer
Sagimet Biosciences Inc. (DE:0O2) har 87 institutionelle ejere og aktionærer, der har indsendt 13D/G- eller 13F-formularer til Securities Exchange Commission (SEC). Disse institutioner har i alt 14,417,711 aktier. Største aktionærer omfatter Vanguard Group Inc, Blue Owl Capital Holdings LP, Affinity Asset Advisors, LLC, Woodline Partners LP, Baker Bros. Advisors Lp, BlackRock, Inc., Marshall Wace, Llp, Hillhouse Capital Advisors, Ltd., Siren, L.L.C., and Millennium Management Llc .
Sagimet Biosciences Inc. (DB:0O2) institutionel ejerskabsstruktur viser aktuelle positioner i virksomheden efter institutioner og fonde, samt seneste ændringer i positionsstørrelse. Større aktionærer kan omfatte individuelle investorer, investeringsforeninger, hedgefonde eller institutioner. Skema 13D angiver, at investoren besidder (eller besidder) mere end 5 % af virksomheden og har til hensigt (eller har til hensigt at) aktivt at forfølge en ændring i forretningsstrategi. Skema 13G indikerer en passiv investering på over 5%.
The share price as of April 24, 2026 is 4,90 / share. Previously, on December 1, 2025, the share price was 5,90 / share. This represents a decline of 16,95% over that period.
Fondens stemningsscore
Fund Sentiment Score (fka Ownership Accumulation Score) finder de aktier, der bliver mest købt af fonde. Det er resultatet af en sofistikeret, multi-faktor kvantitativ model, der identificerer virksomheder med de højeste niveauer af institutionel akkumulering. Scoringsmodellen bruger en kombination af den samlede stigning i oplyste ejere, ændringerne i porteføljeallokeringer i disse ejere og andre målinger. Tallet går fra 0 til 100, hvor højere tal indikerer et højere niveau af akkumulering for sine jævnaldrende, og 50 er gennemsnittet.
Opdateringsfrekvens: Dagligt
Se Ownership Explorer, som giver en liste over højest rangerende virksomheder.
AI+ Ask Fintel’s AI assistant about Sagimet Biosciences Inc..
Select a question to share a public post with an AI-crafted answer.
Thinking of good questions…
13F og NPORT arkivering
Detaljer om 13F-arkivering er gratis. Detaljer om NP-ansøgninger kræver et premium-medlemskab. Grønne rækker angiver nye positioner. Røde rækker angiver lukkede positioner. Klik på linket ikon for at se den fulde transaktionshistorik.
Opgrader
for at låse premium-data op og eksportere til Excel ![]() .
.
| Fil dato | Kilde | Investor | Type | Gennemsnitlig pris (Øst) |
Aktier | Δ Aktier (%) |
Rapporteret Værdi ($1000) |
Δ Værdi (%) |
Port Alloc (%) |
|
|---|---|---|---|---|---|---|---|---|---|---|
| 2026-02-13 | 13F | Stifel Financial Corp | 0 | -100,00 | 0 | |||||
| 2026-02-17 | 13F | Citadel Advisors Llc | Put | 68.100 | -38,76 | 403 | -47,11 | |||
| 2026-02-17 | 13F | Citadel Advisors Llc | Call | 92.600 | 104,87 | 548 | 76,77 | |||
| 2026-02-17 | 13F | XTX Topco Ltd | 91.737 | 53,58 | 543 | 32,76 | ||||
| 2026-02-17 | 13F | Citadel Advisors Llc | 63.119 | 528,61 | 374 | 448,53 | ||||
| 2026-02-17 | 13F | Bank Of America Corp /de/ | 9.876 | -61,58 | 58 | -67,05 | ||||
| 2026-01-14 | 13F | ORG Wealth Partners, LLC | 0 | -100,00 | 0 | |||||
| 2026-02-06 | 13F | VSM Wealth Advisory, LLC | 1.500 | 9 | ||||||
| 2026-02-10 | 13F | Bnp Paribas Arbitrage, Sa | 75.126 | 20.943,70 | 445 | 22.100,00 | ||||
| 2026-02-12 | 13F | BlackRock, Inc. | 813.953 | 32,84 | 4.819 | 14,63 | ||||
| 2026-02-17 | 13F | Raymond James Financial Inc | 286.250 | 2,88 | 1.695 | -11,22 | ||||
| 2026-02-06 | 13F | Gsa Capital Partners Llp | 25.196 | -70,44 | 0 | |||||
| 2026-02-12 | 13F | Federated Hermes, Inc. | 262 | -53,46 | 2 | -66,67 | ||||
| 2026-02-13 | 13F | Smartleaf Asset Management LLC | 500 | 3 | ||||||
| 2026-02-10 | 13F | Goldman Sachs Group Inc | 125.946 | 729,03 | 746 | 616,35 | ||||
| 2025-11-14 | 13F | Millennium Management Llc | Put | 0 | -100,00 | 0 | -100,00 | |||
| 2026-02-06 | 13F | HighTower Advisors, LLC | 37.189 | 10,09 | 220 | -4,76 | ||||
| 2026-02-13 | 13F | Mariner, LLC | 32.100 | 27,89 | 190 | 10,47 | ||||
| 2026-02-13 | 13F | Verition Fund Management LLC | 154.670 | 916 | ||||||
| 2026-02-11 | 13F | Simplex Trading, Llc | 14.227 | 84 | ||||||
| 2026-02-13 | 13F | Caitong International Asset Management Co., Ltd | 823 | 5 | ||||||
| 2025-11-14 | 13F | EAM Investors, LLC | 0 | -100,00 | 0 | |||||
| 2026-02-13 | 13F | Wells Fargo & Company/mn | 8.000 | 14,29 | 47 | -2,08 | ||||
| 2026-02-17 | 13F | Graham Capital Management, L.P. | 0 | -100,00 | 0 | |||||
| 2026-04-24 | 13F | UMA Financial Services, Inc. | 317 | 0,00 | 2 | 0,00 | ||||
| 2026-01-23 | 13F | Farther Finance Advisors, LLC | 0 | -100,00 | 0 | |||||
| 2026-02-09 | 13F | Quest Partners LLC | 6.174 | -94,73 | 37 | -95,52 | ||||
| 2026-04-16 | 13F | Toth Financial Advisory Corp | 0 | -100,00 | 0 | |||||
| 2026-01-30 | 13F | Us Bancorp \de\ | 0 | -100,00 | 0 | |||||
| 2026-02-14 | 13F | Rockefeller Capital Management L.P. | 9.000 | 0,00 | 53 | -13,11 | ||||
| 2026-02-17 | 13F | Tower Research Capital LLC (TRC) | 0 | -100,00 | 0 | |||||
| 2026-04-22 | 13F | 1492 Capital Management LLC | 15.000 | 0,00 | 78 | -11,36 | ||||
| 2026-02-13 | 13F | Barclays Plc | 29.338 | 357,76 | 174 | 302,33 | ||||
| 2025-11-14 | 13F | Cubist Systematic Strategies, LLC | 27.662 | 190 | ||||||
| 2026-02-12 | 13F | Jasper Ridge Partners, L.P. | 12.865 | -32,29 | 76 | -41,54 | ||||
| 2026-02-17 | 13F | Two Sigma Investments, Lp | 42.532 | -16,92 | 252 | -28,49 | ||||
| 2026-02-12 | 13F | Renaissance Technologies Llc | 342.500 | 112,21 | 2.028 | 83,11 | ||||
| 2026-02-17 | 13F | D. E. Shaw & Co., Inc. | 485.496 | -30,77 | 2.874 | -40,25 | ||||
| 2025-11-12 | 13F | Silverarc Capital Management, Llc | 0 | -100,00 | 0 | |||||
| 2026-02-13 | 13F | Marshall Wace, Llp | 780.446 | 4.620 | ||||||
| 2026-02-17 | 13F | Royal Bank Of Canada | 4.927 | 819,22 | 29 | 866,67 | ||||
| 2026-02-17 | 13F | Hillhouse Capital Advisors, Ltd. | 724.800 | 0,00 | 4.291 | -13,72 | ||||
| 2026-02-13 | 13F | Pale Fire Capital SE | 221.875 | 1.314 | ||||||
| 2026-02-13 | 13F | Hudson Bay Capital Management LP | 304.472 | 1.802 | ||||||
| 2026-02-12 | 13F | Dimensional Fund Advisors Lp | 136.039 | 436,98 | 805 | 365,32 | ||||
| 2026-02-13 | 13F | JustInvest LLC | 10.078 | 60 | ||||||
| 2026-02-17 | 13F | Bridgeway Capital Management Inc | 299.641 | 0,00 | 1.774 | -13,72 | ||||
| 2026-02-13 | 13F | American Century Companies Inc | 61.383 | 5,00 | 363 | -9,48 | ||||
| 2026-02-13 | 13F | Morgan Stanley | 89.244 | -63,73 | 528 | -68,72 | ||||
| 2026-02-04 | 13F | Bailard, Inc. | 0 | -100,00 | 0 | |||||
| 2026-04-09 | 13F | Wedmont Private Capital | 0 | -100,00 | 0 | |||||
| 2026-02-03 | 13F | RB Capital Management, LLC | 97.000 | 574 | ||||||
| 2026-02-05 | 13F | ANTIPODES PARTNERS Ltd | 3.176 | 0,00 | 19 | -14,29 | ||||
| 2026-01-21 | 13F | Newbridge Financial Services Group, Inc. | 1.500 | 0,00 | 9 | -20,00 | ||||
| 2026-02-17 | 13F | Man Group plc | 35.606 | -24,16 | 211 | -34,78 | ||||
| 2026-02-03 | 13F | RB Capital Management, LLC | Put | 80.000 | 474 | |||||
| 2026-02-11 | 13F | Rise Advisors, LLC | 0 | -100,00 | 0 | |||||
| 2026-02-17 | 13F | Woodline Partners LP | 1.000.943 | -33,33 | 5.926 | -42,47 | ||||
| 2025-11-13 | 13F | Jump Financial, LLC | 0 | -100,00 | 0 | |||||
| 2026-02-13 | 13F | Siren, L.L.C. | 724.771 | 0,00 | 4.291 | -13,70 | ||||
| 2026-02-17 | 13F | Schonfeld Strategic Advisors LLC | 0 | -100,00 | 0 | |||||
| 2026-02-17 | 13F | Qube Research & Technologies Ltd | 111.349 | 4,21 | 659 | -9,97 | ||||
| 2026-04-07 | 13F | Abacus Planning Group, Inc. | 18.064 | -39,72 | 94 | -46,89 | ||||
| 2026-02-11 | 13F | Parallel Advisors, LLC | 849 | 5 | ||||||
| 2026-02-03 | 13F | SBI Securities Co., Ltd. | 24 | -33,33 | 0 | |||||
| 2026-02-17 | 13F | Point72 Asset Management, L.P. | 175.830 | 1.041 | ||||||
| 2026-02-17 | 13F | Baker Bros. Advisors Lp | 952.996 | 0,00 | 5.642 | -13,71 | ||||
| 2026-02-10 | 13F | Dumac, Inc. | 71.192 | -5,08 | 421 | -26,27 | ||||
| 2026-01-29 | 13F | China Universal Asset Management Co., Ltd. | 5.052 | 30 | ||||||
| 2026-02-17 | 13F | 683 Capital Management, LLC | 126.349 | 748 | ||||||
| 2026-02-17 | 13F | Fmr Llc | 133 | -25,70 | 1 | -100,00 | ||||
| 2026-02-10 | 13F | Acadian Asset Management Llc | 7.980 | 0 | ||||||
| 2026-01-29 | 13F | Vanguard Group Inc | 1.259.550 | 4,68 | 7.457 | -9,67 | ||||
| 2026-01-28 | 13F | DekaBank Deutsche Girozentrale | 20.000 | 0,00 | 0 | |||||
| 2026-02-13 | 13F | Landscape Capital Management, L.l.c. | 25.901 | 14,09 | 153 | -1,29 | ||||
| 2026-02-17 | 13F | Readystate Asset Management Lp | 0 | -100,00 | 0 | |||||
| 2026-02-13 | 13F | MAI Capital Management | 500 | 0,00 | 3 | -33,33 | ||||
| 2026-01-29 | 13F | UBS Group AG | 201.759 | -34,23 | 1.194 | -43,25 | ||||
| 2026-04-08 | 13F | Miracle Mile Advisors, LLC | 21.376 | 112 | ||||||
| 2026-02-11 | 13F | LPL Financial LLC | 20.574 | 31,25 | 122 | 13,08 | ||||
| 2026-02-12 | 13F | Jane Street Group, Llc | 92.436 | 619,85 | 547 | 521,59 | ||||
| 2026-01-12 | 13F | Rialto Wealth Management, LLC | 359 | 0,00 | 2 | 0,00 | ||||
| 2026-02-12 | 13F | Jane Street Group, Llc | Call | 83.700 | 66,73 | 496 | 43,90 | |||
| 2026-02-13 | 13F | State Street Corp | 117.388 | 6,25 | 695 | -8,32 | ||||
| 2026-02-17 | 13F | Millennium Management Llc | 586.947 | -24,40 | 3.475 | -34,76 | ||||
| 2026-02-20 | 13F/A | Blue Owl Capital Holdings LP | 1.243.877 | -6,36 | 7.364 | -19,19 | ||||
| 2025-11-14 | 13F | Atom Investors LP | 0 | -100,00 | 0 | |||||
| 2026-04-15 | 13F | Gf Fund Management Co. Ltd. | 689 | 13,32 | 4 | 0,00 | ||||
| 2026-01-26 | 13F | Mirae Asset Global Investments Co., Ltd. | 1.506 | 9 | ||||||
| 2026-02-17 | 13F | Sherbrooke Park Advisers Llc | 10.135 | 60 | ||||||
| 2026-02-17 | 13F | Northern Trust Corp | 55.511 | 6,15 | 329 | -8,38 | ||||
| 2026-02-17 | 13F | Lighthouse Investment Partners, LLC | 22.740 | 135 | ||||||
| 2026-02-13 | 13F | Charles Schwab Investment Management Inc | 15.000 | 0,00 | 89 | -13,73 | ||||
| 2025-11-14 | 13F | Ikarian Capital, LLC | 0 | -100,00 | 0 | |||||
| 2026-04-08 | 13F | Hamilton Lane Advisors Llc | 0 | -100,00 | 0 | |||||
| 2026-02-11 | 13F | Jpmorgan Chase & Co | 2.488 | 2.438,78 | 15 | |||||
| 2026-02-09 | 13F | Geode Capital Management, Llc | 295.856 | 4,46 | 1.752 | -9,83 | ||||
| 2026-02-13 | 13F | Affinity Asset Advisors, LLC | 1.148.245 | 228,07 | 6.798 | 183,09 | ||||
| 2026-02-17 | 13F | Cresset Asset Management, LLC | 20.079 | 119 | ||||||
| 2025-11-14 | 13F | Hrt Financial Lp | 0 | -100,00 | 0 | |||||
| 2026-02-13 | 13F | OMERS ADMINISTRATION Corp | 53.400 | 316 | ||||||
| 2025-11-03 | 13F | Hollencrest Capital Management | 0 | -100,00 | 0 | |||||
| 2025-11-14 | 13F | PFM Health Sciences, LP | 0 | -100,00 | 0 | |||||
| 2026-02-13 | 13F | Kestra Advisory Services, LLC | 66.014 | 391 | ||||||
| 2026-02-23 | 13F | Virtu Financial LLC | 10.438 | 0 | ||||||
| 2025-11-14 | 13F | Point72 Europe (London) LLP | 52 | 0 | ||||||
| 2026-04-15 | 13F | FNY Investment Advisers, LLC | 149.761 | 4,82 | 1 | |||||
| 2026-02-13 | 13F | Citigroup Inc | 17.976 | 106 | ||||||
| 2026-02-17 | 13F | Susquehanna International Group, Llp | Put | 34.300 | -47,07 | 203 | -54,28 | |||
| 2026-02-17 | 13F | Susquehanna International Group, Llp | Call | 56.500 | -65,10 | 334 | -69,91 | |||
| 2026-02-17 | 13F | Susquehanna International Group, Llp | 179.024 | 449,81 | 1.060 | 374,89 | ||||
| 2026-02-09 | 13F | Jefferies Financial Group Inc. | 13.205 | -5,00 | 78 | -17,89 | ||||
| 2025-11-13 | 13F | Riggs Asset Managment Co. Inc. | 0 | -100,00 | 0 | |||||
| 2026-02-13 | 13F | Squarepoint Ops LLC | 84.733 | 141,65 | 502 | 108,75 | ||||
| 2026-02-13 | 13F | SRS Capital Advisors, Inc. | 115 | 0,00 | 1 | |||||
| 2025-11-14 | 13F | Jane Street Group, Llc | Put | 0 | -100,00 | 0 | -100,00 | |||
| 2026-02-06 | 13F | Global Retirement Partners, LLC | 3.000 | 0,00 | 18 | -15,00 | ||||
| 2026-04-15 | 13F | FNY Investment Advisers, LLC | Call | 0 | -100,00 | 0 |
Other Listings
| US:SGMT | 5,86 $ |