Grundlæggende statistik
| Institutionelle ejere | 63 total, 61 long only, 0 short only, 2 long/short - change of -11,27% MRQ |
| Gennemsnitlig porteføljeallokering | 0.0042 % - change of -85,99% MRQ |
| Institutionelle aktier (lange) | 2.874.551 (ex 13D/G) - change of -0,43MM shares -12,93% MRQ |
| Institutionel værdi (lang) | $ 30.400 USD ($1000) |
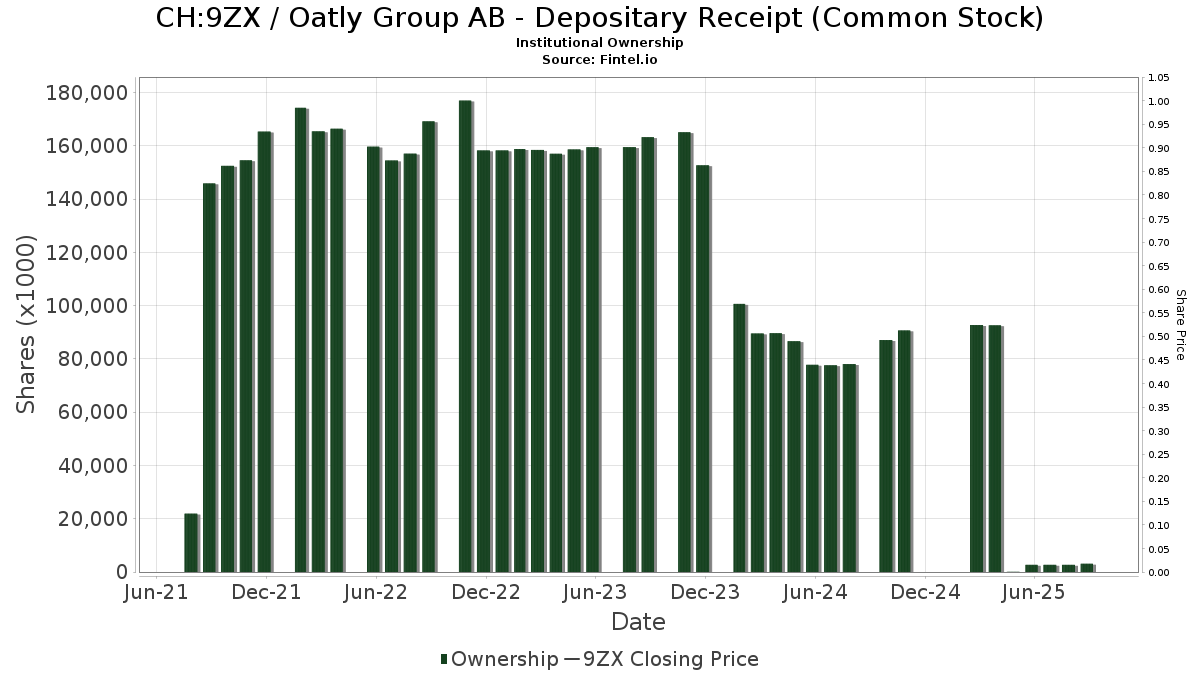
Institutionelt ejerskab og aktionærer
Oatly Group AB - Depositary Receipt (Common Stock) (CH:9ZX) har 63 institutionelle ejere og aktionærer, der har indsendt 13D/G- eller 13F-formularer til Securities Exchange Commission (SEC). Disse institutioner har i alt 2,874,551 aktier. Største aktionærer omfatter Blackstone Group Inc, Credit Agricole S A, Susquehanna International Group, Llp, Susquehanna International Group, Llp, UBS Group AG, Morgan Stanley, Citadel Advisors Llc, Davy Global Fund Management Ltd, Renaissance Technologies Llc, and Goldman Sachs Group Inc .
Oatly Group AB - Depositary Receipt (Common Stock) (BRSE:9ZX) institutionel ejerskabsstruktur viser aktuelle positioner i virksomheden efter institutioner og fonde, samt seneste ændringer i positionsstørrelse. Større aktionærer kan omfatte individuelle investorer, investeringsforeninger, hedgefonde eller institutioner. Skema 13D angiver, at investoren besidder (eller besidder) mere end 5 % af virksomheden og har til hensigt (eller har til hensigt at) aktivt at forfølge en ændring i forretningsstrategi. Skema 13G indikerer en passiv investering på over 5%.
Fondens stemningsscore
Fund Sentiment Score (fka Ownership Accumulation Score) finder de aktier, der bliver mest købt af fonde. Det er resultatet af en sofistikeret, multi-faktor kvantitativ model, der identificerer virksomheder med de højeste niveauer af institutionel akkumulering. Scoringsmodellen bruger en kombination af den samlede stigning i oplyste ejere, ændringerne i porteføljeallokeringer i disse ejere og andre målinger. Tallet går fra 0 til 100, hvor højere tal indikerer et højere niveau af akkumulering for sine jævnaldrende, og 50 er gennemsnittet.
Opdateringsfrekvens: Dagligt
Se Ownership Explorer, som giver en liste over højest rangerende virksomheder.
AI+ Ask Fintel’s AI assistant about Oatly Group AB - Depositary Receipt (Common Stock).
Select a question to share a public post with an AI-crafted answer.
Thinking of good questions…
13F og NPORT arkivering
Detaljer om 13F-arkivering er gratis. Detaljer om NP-ansøgninger kræver et premium-medlemskab. Grønne rækker angiver nye positioner. Røde rækker angiver lukkede positioner. Klik på linket ikon for at se den fulde transaktionshistorik.
Opgrader
for at låse premium-data op og eksportere til Excel ![]() .
.
| Fil dato | Kilde | Investor | Type | Gennemsnitlig pris (Øst) |
Aktier | Δ Aktier (%) |
Rapporteret Værdi ($1000) |
Δ Værdi (%) |
Port Alloc (%) |
|
|---|---|---|---|---|---|---|---|---|---|---|
| 2026-02-11 | 13F | Simplex Trading, Llc | 5.007 | -11,14 | 54 | |||||
| 2026-02-17 | 13F | Blackstone Group Inc | 1.988.909 | 0,00 | 21.261 | -34,01 | ||||
| 2026-02-12 | 13F | Wealthspire Advisors, LLC | 0 | -100,00 | 0 | |||||
| 2026-01-26 | 13F | Cwm, Llc | 49 | 0,00 | 0 | |||||
| 2026-02-06 | 13F | Leonteq Securities AG | 1.351 | 0,00 | 14 | -33,33 | ||||
| 2026-02-17 | 13F | Advisor Group Holdings, Inc. | 1.197 | 6,40 | 13 | -33,33 | ||||
| 2026-04-14 | 13F | Nbc Securities, Inc. | 22 | 0,00 | 0 | |||||
| 2026-02-12 | 13F | Davy Global Fund Management Ltd | 29.771 | -10,76 | 318 | -41,11 | ||||
| 2026-02-12 | 13F | Federation des caisses Desjardins du Quebec | 10 | 0,00 | 0 | |||||
| 2026-04-23 | 13F | Shikiar Asset Management Inc | 24.000 | -7,17 | 0 | |||||
| 2026-01-30 | 13F | R Squared Ltd | 14.464 | 155 | ||||||
| 2026-02-13 | 13F | National Bank Of Canada /fi/ | 37 | 0,00 | 0 | |||||
| 2026-02-13 | 13F | Morgan Stanley | 48.271 | 11,06 | 516 | -26,70 | ||||
| 2026-02-17 | 13F | Citadel Advisors Llc | Put | 37.905 | -51,29 | 405 | -67,86 | |||
| 2025-11-13 | 13F | Riggs Asset Managment Co. Inc. | 0 | -100,00 | 0 | |||||
| 2026-02-09 | 13F | Geode Capital Management, Llc | 11.286 | 0,00 | 121 | -34,07 | ||||
| 2026-01-23 | 13F | Westside Investment Management, Inc. | 500 | 100,00 | 5 | 25,00 | ||||
| 2026-02-17 | 13F | Susquehanna International Group, Llp | Put | 133.100 | -60,55 | 1.423 | -73,98 | |||
| 2026-02-12 | 13F | Jane Street Group, Llc | Call | 0 | -100,00 | 0 | ||||
| 2026-02-17 | 13F | Millennium Management Llc | 23.597 | 252 | ||||||
| 2026-02-17 | 13F | Susquehanna International Group, Llp | Call | 111.100 | -5,29 | 1.188 | -37,53 | |||
| 2026-02-17 | 13F | Citadel Advisors Llc | Call | 18.855 | 202 | |||||
| 2025-11-13 | 13F | Quadrature Capital Ltd | 0 | -100,00 | 0 | -100,00 | ||||
| 2026-02-11 | 13F | Parallel Advisors, LLC | 3 | 0,00 | 0 | |||||
| 2026-01-27 | 13F | Zurcher Kantonalbank (Zurich Cantonalbank) | 629 | -3,38 | 7 | -40,00 | ||||
| 2026-02-13 | 13F | Wells Fargo & Company/mn | 1.360 | -36,95 | 15 | -58,82 | ||||
| 2026-02-13 | 13F | Rhumbline Advisers | 615 | 6,22 | 7 | -33,33 | ||||
| 2026-02-17 | 13F | Ancora Advisors, LLC | 32 | 0,00 | 0 | |||||
| 2026-02-11 | 13F | Group One Trading, L.p. | 10.994 | -7,68 | 118 | -39,06 | ||||
| 2026-01-23 | 13F | Avion Wealth | 35 | 0,00 | 0 | |||||
| 2026-02-17 | 13F | Citadel Advisors Llc | 0 | -100,00 | 0 | |||||
| 2026-04-06 | 13F | GAMMA Investing LLC | 4.443 | 10,00 | 45 | 4,65 | ||||
| 2026-04-24 | 13F | Key FInancial Inc | 5 | 0,00 | 0 | |||||
| 2026-02-17 | 13F | Jones Financial Companies Lllp | 51 | 2,00 | 1 | |||||
| 2026-02-12 | 13F | Steward Partners Investment Advisory, Llc | 1.160 | 0,00 | 12 | -33,33 | ||||
| 2026-02-17 | 13F | Caption Management, LLC | Put | 0 | -100,00 | 0 | ||||
| 2026-01-27 | 13F | WealthCollab, LLC | 85 | 0,00 | 1 | -100,00 | ||||
| 2026-02-11 | 13F | Jpmorgan Chase & Co | 10 | 0,00 | 0 | |||||
| 2025-11-03 | 13F | Golden State Wealth Management, LLC | 0 | -100,00 | 0 | |||||
| 2026-02-12 | 13F | CIBC Private Wealth Group, LLC | 62 | 0,00 | 1 | -100,00 | ||||
| 2026-02-17 | 13F | Bank Of America Corp /de/ | 1.266 | -31,16 | 14 | -55,17 | ||||
| 2025-11-14 | 13F | Northwestern Mutual Wealth Management Co | 0 | -100,00 | 0 | |||||
| 2026-02-13 | 13F | Van Eck Associates Corp | 10.630 | -3,37 | 0 | |||||
| 2026-01-23 | 13F | Assetmark, Inc | 0 | -100,00 | 0 | |||||
| 2026-01-27 | 13F | TD Waterhouse Canada Inc. | 5 | 0,00 | 0 | |||||
| 2026-02-11 | 13F | Atlantic Private Wealth, LLC | 2 | -75,00 | 0 | |||||
| 2026-02-17 | 13F | DZ BANK AG Deutsche Zentral Genossenschafts Bank, Frankfurt am Main | 0 | -100,00 | 0 | |||||
| 2026-02-13 | 13F | Quarry LP | 0 | -100,00 | 0 | |||||
| 2026-04-13 | 13F | Salem Investment Counselors Inc | 5 | 0 | ||||||
| 2026-02-13 | 13F | Smartleaf Asset Management LLC | 1 | 0 | ||||||
| 2026-04-22 | 13F | Coston, McIsaac & Partners | 35 | 0,00 | 0 | |||||
| 2026-02-10 | 13F | Belvedere Trading LLC | Call | 11.100 | 6 | |||||
| 2026-02-17 | 13F | Credit Agricole S A | 509.678 | 293,49 | 5.448 | 159,68 | ||||
| 2026-02-12 | 13F | Groupe la Francaise | 0 | -100,00 | 0 | |||||
| 2026-02-06 | 13F | EverSource Wealth Advisors, LLC | 212 | 11,58 | 2 | -33,33 | ||||
| 2026-02-10 | 13F | Goldman Sachs Group Inc | 27.481 | 80,42 | 294 | 19,11 | ||||
| 2025-11-14 | 13F | Raymond James Financial Inc | 0 | -100,00 | 0 | -100,00 | ||||
| 2026-02-14 | 13F | Rockefeller Capital Management L.P. | 54 | 100,00 | 1 | |||||
| 2026-02-10 | 13F | Performa Ltd (US), LLC | 10.100 | 16,76 | 108 | -23,57 | ||||
| 2026-02-17 | 13F | Heights Capital Management, Inc | 0 | -100,00 | 0 | -100,00 | ||||
| 2025-11-14 | 13F | Cubist Systematic Strategies, LLC | 12.005 | -43,40 | 194 | -22,71 | ||||
| 2026-04-13 | 13F | Creative Financial Designs Inc /adv | 7 | 0,00 | 0 | |||||
| 2026-02-12 | 13F | Renaissance Technologies Llc | 29.513 | 315 | ||||||
| 2026-02-18 | 13F | GWM Advisors LLC | 2 | 0,00 | 0 | |||||
| 2026-02-12 | 13F | BlackRock, Inc. | 7.766 | 0,00 | 83 | -33,60 | ||||
| 2025-11-14 | 13F | CastleKnight Management LP | 0 | -100,00 | 0 | -100,00 | ||||
| 2026-02-17 | 13F | Tower Research Capital LLC (TRC) | 769 | -35,11 | 8 | -57,89 | ||||
| 2026-02-11 | 13F | TCTC Holdings, LLC | 147 | 0,00 | 2 | -50,00 | ||||
| 2026-02-05 | 13F | Allworth Financial LP | 112 | 0,90 | 1 | 0,00 | ||||
| 2026-02-13 | 13F | MAI Capital Management | 78 | 4,00 | 1 | -100,00 | ||||
| 2025-11-14 | 13F | Wolverine Trading, Llc | Call | 0 | -100,00 | 0 | ||||
| 2026-02-17 | 13F | Royal Bank Of Canada | 8.221 | -0,42 | 88 | -34,33 | ||||
| 2026-02-17 | 13F | MIRAE ASSET GLOBAL ETFS HOLDINGS Ltd. | 9.590 | -49,24 | 103 | -66,67 | ||||
| 2025-11-19 | 13F/A | Danske Bank A/s | 0 | 0 | ||||||
| 2026-02-17 | 13F | Susquehanna Portfolio Strategies, LLC | 12.240 | -44,43 | 131 | -63,48 | ||||
| 2026-02-17 | 13F | Susquehanna International Group, Llp | 0 | -100,00 | 0 | |||||
| 2026-02-13 | 13F | Pathstone Holdings, LLC | 0 | -100,00 | 0 | |||||
| 2026-01-29 | 13F | UBS Group AG | 66.060 | -89,78 | 706 | -93,26 | ||||
| 2026-02-09 | 13F | Keating Financial Advisory Services, Inc. | 4 | 0 | ||||||
| 2026-04-07 | 13F | Farther Finance Advisors, LLC | 39 | 5,41 | 0 | |||||
| 2026-02-03 | 13F | SBI Securities Co., Ltd. | 362 | -35,59 | 4 | -66,67 | ||||
| 2026-02-12 | 13F | Principal Securities, Inc. | 0 | -100,00 | 0 | |||||
| 2026-02-13 | 13F | Headlands Technologies LLC | 0 | -100,00 | 0 | |||||
| 2026-02-13 | 13F | Citigroup Inc | 150 | -29,25 | 2 | -66,67 | ||||
| 2026-01-30 | 13F | American Capital Advisory, LLC | 12 | 0,00 | 0 | |||||
| 2026-02-27 | 13F | Strategic Investment Solutions, Inc. /IL | 50 | 0,00 | 0 | |||||
| 2025-11-12 | 13F | Banco Santander, S.A. | 0 | -100,00 | 0 |